Networking with Microsoft Windows Vista- P9
Bạn đang xem bản rút gọn của tài liệu. Xem và tải ngay bản đầy đủ của tài liệu tại đây (1.49 MB, 50 trang )
■ If the host computer connects
directly to the Internet but your ISP
supplies you with a dynamic IP
address each time you connect, use
the IPCONFIG utility to determine
your current IP address. (That is,
select Start, All Programs,
Accessories, Command Prompt to
get to the command line, type
ipconfig
, and press Enter.) Make
note of the
IPv4 Address
value
returned by IPCONFIG (you might need to scroll the output up to see
it) and use that address to connect to the Remote Desktop host.
■ If your network uses a router, determine that router’s external IP
address by examining the router’s status page. See Chapter 3,
“Configuring Your Router,” for the details. When you set up your
Remote Desktop connection, you connect to the router, which will then
forward your connection (thanks to your efforts in the next section) to
the Remote Desktop host.
➔ To learn how to view the status page in some popular routers, see “Checking the Router Sta-
tus,” p. 90.
Setting Up Port Forwarding
If your network uses a router, you need to configure it to forward data sent to
the port specified in step 1 to the Remote Desktop host computer. This is port
forwarding, and the steps you follow depend on the device. The next few sec-
tions show you how to configure port forwarding on some popular routers.
Belkin
Here are the steps to follow to configure port forwarding on most Belkin
routers:
1. Under Firewall, click the Virtual Servers link to display the Virtual
Servers page.
2. In the first LAN IP Address text box, type the last three digits of the
Remote Desktop host’s IP address.
3. In the Protocol Type list, select TCP.
384
Networking with Microsoft
®
Windows Vista
™
16
Another way to deter-
mine your router’s exter-
nal IP address is to navigate to
any of the free services for deter-
mining your current IP. Here are
two:
WhatISMyIP (http://
www.whatismyip.com)
DynDNS (http://
checkip.dyndns.org)
tip
Please purchase PDF Split-Merge on www.verypdf.com to remove this watermark.
4. In LAN Port text box, type the Remote Desktop listening port you speci-
fied earlier.
5. In Public Port text box, type the Remote Desktop listening port you
specified earlier.
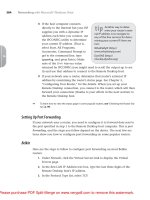
6. Activate the Enable check box. Figure 16.11 shows a Belkin router con-
figured to forward port 12345 to the computer with the address
192.168.1.110.
CHAPTER 16 Making Remote Network Connections
385
16
FIGURE 16.11
On most Belkin routers, use the Virtual Servers page to configure port forwarding.
7. Click Set. The Belkin router applies the new setting.
D-Link
For most D-Link routers, follow these steps to configure port forwarding:
1. Click the Advanced tab.
2. Click Port Forwarding to open the Port Forwarding Rules page.
3. In the first rule, activate the check box.
4. In the Name text box, type a name
for the rule, such as
RDP
or
Remote
Desktop
.
5. In the IP Address text box, type the
IP address of the Remote Desktop
host’s IP address.
If the Remote Desktop
host computer appears
in the Computer Name list, select
the computer and then click <<
to automatically add the host’s IP
address.
tip
Please purchase PDF Split-Merge on www.verypdf.com to remove this watermark.
6. In Port column, use the Start text box to type the Remote Desktop lis-
tening port you specified earlier.
7. In Port column, use the End text box to type the Remote Desktop listen-
ing port you specified earlier.
8. In the Traffic Type list, select TCP. Figure 16.12 shows a D-Link router
configured to forward port 12345 to the computer with the address
192.168.1.110.
386
Networking with Microsoft
®
Windows Vista
™
16
FIGURE 16.12
On your D-Link router, use the Port Forwarding Rules page to configure port forwarding.
9. Click Save Settings. The router saves the new settings.
10. Click Continue.
Linksys
Here are the steps to follow to configure port forwarding on most Linksys
routers:
1. Click the Applications & Gaming tab.
2. Click the Port Range Forward subtab to display the Port Range Forward
page.
3. In the Application text box, type a name for the rule, such as
RDP
or
Remote Desktop
.
4. Use the Start text box to type the Remote Desktop listening port you
specified earlier.
Please purchase PDF Split-Merge on www.verypdf.com to remove this watermark.
5. Use the End text box to type the Remote Desktop listening port you
specified earlier.
6. In the Protocol list, select TCP.
7. In the IP Address text box, type the last three digits of the Remote
Desktop host’s IP address.
8. Activate the Enable check box. Figure 16.13 shows a Linksys router
configured to forward port 1235 to the computer with the address
192.168.1.110.
CHAPTER 16 Making Remote Network Connections
387
16
FIGURE 16.13
On most Linksys routers, use the Port Range Forward page to configure port forwarding.
9. At the bottom of the page, click Save Settings. The router reports that
the
Settings are successful
.
10. Click Continue.
Netgear
Follow these steps to configure port forwarding on most Netgear routers:
1. In the Advanced section, click the Port Forwarding / Port Triggering
link. The Port Forwarding / Port Triggering page appears.
2. Select the Port Forwarding option.
3. Click Add Custom Service to display the Ports - Custom Services page.
Please purchase PDF Split-Merge on www.verypdf.com to remove this watermark.
4. Use the Service Name text box to type a name for the rule, such as
RDP
.
5. In the Service Type list, select TCP.
6. Use the Starting Port text box to type the Remote Desktop listening port
you specified earlier.
7. Use the Ending Port text box to type the Remote Desktop listening port
you specified earlier.
8. Use the Server IP Address text boxes to enter the IP address of the
Remote Desktop host. Figure 16.14 shows a Netgear router configured
to forward port 1235 to the computer with the address 192.168.1.110.
388
Networking with Microsoft
®
Windows Vista
™
16
FIGURE 16.14
On most Netgear routers, use the Port Forwarding / Port Triggering page to configure port for-
warding.
9. Click Apply. The router adds the service to the Port Forwarding / Port
Triggering page.
Connecting Using the IP Address and New Port
You’re now ready to make the connection to the Remote Desktop host via the
Internet. Here are the steps to follow:
Please purchase PDF Split-Merge on www.verypdf.com to remove this watermark.
1. Connect to the Internet.
2. Select Start, All Programs, Accessories, Remote Desktop Connection.
The Remote Desktop Connection dialog box appears.
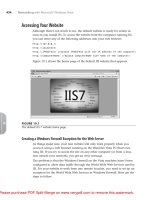
3. In the Computer text box, type the external IP address of the router or
remote computer and the alternative port you specified in step 1, sepa-
rated by a colon. Figure 16.15 shows an example.
CHAPTER 16 Making Remote Network Connections
389
16
FIGURE 16.15
In the Remote Desktop Connection dialog box, type the external IP address, a colon, and then
the new Remote Desktop listening port.
4. Set up your other Remote Desktop options as needed. For example,
click Options, display the Experience tab, and then select the appropri-
ate connection speed, such as Modem (28.8 Kbps), Modem (56 Kbps),
or Broadband (128 Kbps–1.5 Mbps).
5. Click Connect.
Using Dynamic DNS to Access Your Network
If you want to use Remote Desktop via the Internet regularly, constantly mon-
itoring your dynamic IP address can be a pain, particularly if you forget to
check it before heading out of the office. A useful solution is to sign up with a
dynamic DNS (DDNS) service, which supplies you with a static domain name.
The service also installs a program on your computer that monitors your IP
address and updates the service’s DDNS servers to point your domain name to
your IP address. Here are some DDNS services to check out:
DynDNS ()
TZO ()
No-IP.com ()
D-Link ()
However, you may not want to rely on a program to keep your network exter-
nal IP address and your domain name synchronized. For example, you may
Please purchase PDF Split-Merge on www.verypdf.com to remove this watermark.
want to turn off the computer when you’re
away from home or the office. In that case,
most routers offer a DDNS feature that will
handle this for you. You specify your DDNS
provider, your domain name, and your
logon data, and the router does the rest.
The next few sections show you how to
configure DDNS on some popular routers.
D-Link
For most D-Link routers, follow these steps to configure DDNS:
1. Click the Tools tab.
2. Click DDNS to display the Dynamic DNS page.
3. Activate the Enable DDNS check box.
4. Use the Server Address text box to type the address of your DDNS
provider.
5. Use the Host Name text box to type your domain name.
6. Use the Username, Password, and Verify Password text boxes to type
the logon data for your account with the DDNS provider. Figure 16.16
shows a completed version of the Dynamic DNS page.
390
Networking with Microsoft
®
Windows Vista
™
16
If you use either D-Link
DDNS service or
DynDNS, select the appropriate
service from the list and then
click << to automatically add the
service address.
tip
FIGURE 16.16
On your D-Link router, use the Dynamic DNS page to configure dynamic DNS.
Please purchase PDF Split-Merge on www.verypdf.com to remove this watermark.
7. Click Save Settings. The router saves the new settings.
8. Click Continue.
Linksys
Here are the steps to follow to configure DDNS on most Linksys routers:
1. Click the Setup tab.
2. Click the DDNS subtab.
3. In the DDNS Service list, select either DynDNS.org or TZO.com. Note
that how you proceed from here depends on the service you choose.
The rest of these steps assume you’re using DynDNS.org.
4. Use the User Name and Password text boxes to type the logon data for
your account.
5. Use the Host Name text box to type your domain name. Figure 16.17
shows a completed version of the DDNS page.
CHAPTER 16 Making Remote Network Connections
391
16
FIGURE 16.17
On most Linksys routers, use the DDNS page to configure dynamic DNS.
6. Click Save Settings. The router reports that the
Settings are
successful
.
7. Click Continue.
Please purchase PDF Split-Merge on www.verypdf.com to remove this watermark.
Netgear
Follow these steps to configure dynamic
DNS on most Netgear routers:
1. In the Advanced section, click the
Dynamic DNS link. The Dynamic
DNS page appears.
2. Activate the Use a Dynamic DNS Service check box.
3. Use the Service Provider to select a DDNS service.
4. Use the Host Name text box to type your domain name.
5. Use the Username and Password text boxes to type the logon data for
your account with the DDNS provider. Figure 16.18 shows a completed
version of the Dynamic DNS page.
392
Networking with Microsoft
®
Windows Vista
™
16
My Netgear router
only supports
DynDNS. Yours may support
other services.
note
FIGURE 16.18
On most Netgear routers, use the Dynamic DNS page to configure dynamic DNS.
6. Click Apply.
Please purchase PDF Split-Merge on www.verypdf.com to remove this watermark.
From Here
■ To learn how to view the status page in some popular routers, see
“Checking the Router Status,” p. 90.
■ For the details on setting up a user account in Windows Vista, see
“Creating User Accounts for Sharing,” p. 189.
■ To learn more about what constitutes a strong password, see “Building
a Strong Password,” p. 292.
■ For other ethernet network security techniques, see Chapter 14,
“Implementing Network Security,” p. 313.
■ For other wireless network security techniques, see Chapter 15,
“Implementing Wireless Security,” p. 335.
CHAPTER 16 Making Remote Network Connections
393
16
Please purchase PDF Split-Merge on www.verypdf.com to remove this watermark.
This page intentionally left blank
Please purchase PDF Split-Merge on www.verypdf.com to remove this watermark.
17
CHAPTER
IN THIS CHAPTER
■
Monitoring Network
Performance
■
Monitoring Shared Folders
■
From Here
Monitoring Your Network
I
f you’re the unofficial administrator of your home or small
office network, I imagine you’re already saddled with a
fairly long to-do list of network chores: adding and
upgrading network devices, configuring your router, adding
and maintaining users, creating passwords, adding shared
folders, setting permissions, and on and on. The last thing
you probably need is yet another set of chores tacked on to
that list. Well, sorry, but I’m afraid I’m going to do just that in
this chapter as I show you how to monitor three aspects of
your network: performance, shared folders, and users.
The good news is that none of the monitoring tasks you
learn about in this chapter are activities you need to do very
often. In all cases, in fact, you may need to perform the mon-
itoring chores only once in a while, or on an as-needed basis.
For example, you might want to check your network per-
formance now to get a baseline for comparison, then you
might want to check it again only if the network feels slow or
if you upgrade your equipment.
Remember, however, that even a network with just a few
computers is still a fairly large and unwieldy beast that
requires a certain amount of vigilance to keep things run-
ning smoothly. Therefore, it’s worth it to keep an eye on the
network to watch for things going awry.
Please purchase PDF Split-Merge on www.verypdf.com to remove this watermark.
Monitoring Network Performance
By far the most important aspect of your network that you should monitor is
the network’s performance. A network’s job is to transfer data, and if your
data is getting transferred at a rate that’s substantially slower than it should
be, you and your users won’t be happy or productive.
The easiest way to check network performance is to check the current status of
wired and wireless network connections (see Figure 17.1). I explained how to
do this in Chapter 5, “Working with Vista’s Basic Network Tools and Tasks.” In
particular, you want to look at the Speed value: If it says, for example, that
you have a 100Mbps connection but you thought you were using Gigabit
Ethernet equipment, you need to check that equipment.
➔ To learn how to view the status of a network connection, see “Viewing the Current Network
Status,” p. 123.
396
Networking with Microsoft
®
Windows Vista
™
17
Connection speed
FIGURE 17.1
In the Status dialog box for your network connection, check the Speed value to ensure your
connection is operating at the correct rate.
Please purchase PDF Split-Merge on www.verypdf.com to remove this watermark.
Monitoring Network Performance with Task
Manager
The Task Manager utility is excellent for
getting a quick overview of the current
state of the system, and it offers a couple
of tools that help you monitor your network.
To get Task Manager onscreen, follow these steps:
1. Press Ctrl+Alt+Delete. Vista displays its security window.
2. Select Start Task Manager.
If your network feels sluggish, it could be that the remote computer you’re
working with is sharing data slowly or that network traffic is exceptionally
high. To see whether the latter situation is the cause of the problem, you can
check out the current network utilization value, which is the percent of avail-
able bandwidth that your network adapter is currently using.
To check network utilization, display Task Manager’s Networking tab, shown
in Figure 17.2. Use the graph or the Network Utilization column to monitor
the current network utilization value. Notice that this value is a percentage.
This means that the utilization is a percentage of the bandwidth shown in the
Link Speed column. So, for example, if the current network utilization is 10%
and the Link Speed value is 1Gbps, the network is currently using about
100Mbps bandwidth.
The Network Utilization value combines the data sent by the computer and
the data received by the computer. If the utilization is high, it’s often useful to
break down the data stream into the separate sent and received components.
To do that, select View, Network Adapter History, and then select Bytes Sent
(which displays as a red line on the graph) or Bytes Received (which displays
as a yellow line on the graph).
If you’re feeling ambitious or curious, you can view much more information
than what you see in the default Networking tab. Follow these steps to add
one or more columns to the view:
1. Select the View, Select Columns command. Task Manager displays the
Select Columns dialog box, as shown in Figure 17.3. This dialog box
offers a long list of networking measures that you can monitor.
CHAPTER 17 Monitoring Your Network
397
17
To bypass the security
window, either press
Ctrl+Shift+Esc or right-click an
empty section of the taskbar, and
then click Task Manager.
tip
Please purchase PDF Split-Merge on www.verypdf.com to remove this watermark.
FIGURE 17.2
Use Task Manager’s Networking tab to check the current network utilization percentage.
398
Networking with Microsoft
®
Windows Vista
™
17
FIGURE 17.3
Use the Select Columns dialog box to choose which values you want to monitor in the
Networking tab.
Please purchase PDF Split-Merge on www.verypdf.com to remove this watermark.
2. Activate the check box of a value
that you want to monitor.
3. Repeat step 2 for each value you
want to add to the networking tab.
4. Click OK.
Here’s a summary of some of the more
useful columns you can add:
Adapter This column shows the description of the network adapter.
Description
Network This is the network utilization value.
Utilization
Link Speed This value shows the network adapter’s connection speed.
State This column displays the general state of the adapter.
Bytes Sent This value shows the percentage of connection bandwidth
Throughput used by traffic sent from Windows Vista.
Bytes Received This value shows the percentage of connection bandwidth
Throughput used by traffic received by Windows Vista.
Bytes This value shows the percentage of connection bandwidth
Throughput used by traffic both sent from and received by Windows
Vista.
Bytes Sent This column tells you the total number of bytes sent from
Windows Vista over the network adapter during the current
session (that is, since the last boot).
Bytes Received This column tells you the total number of bytes received by
Windows Vista over the network adapter during the current
session.
Bytes This column tells you the total number of bytes sent from
and received by Windows Vista over the network adapter
during the current session.
Bytes Sent This value shows the total number of bytes sent from
Per Interval Windows Vista over the network adapter during the most
recent update interval. (For example, if the Update Speed
value is set to Low, the display updates every 4 seconds, so
the Bytes Sent Per Interval value is the number of bytes
sent during the most recent 4-second interval.)
CHAPTER 17 Monitoring Your Network
399
17
By default, the Network-
ing tab doesn’t collect
data when you’re viewing some
other Task Manager tab. If you
prefer that the Networking tab
always collect data, select
Options, Tab Always Active.
tip
Please purchase PDF Split-Merge on www.verypdf.com to remove this watermark.
Bytes Received This value shows the total number of bytes received by
Per Interval Windows Vista over the network adapter during the most
recent update interval.
Bytes Per This value shows the total number of bytes sent from and
Interval received by Windows Vista over the network adapter dur-
ing the most recent update interval.
On your small network, you can use these measures to watch out for extreme
values. That is, with normal network traffic, the values should never be either
really small or really large for long periods. If you notice small (or zero) val-
ues for long periods, it could indicate that your computer isn’t able to send or
receive data; if you notice high values (particularly on the various
“Throughput” measures, where “high” means values near 100%) for an
extended time, it could indicate a software problem where a rogue application
is bombarding your computer with data.
Monitoring Network Performance with Performance Monitor
For more advanced performance monitoring, Windows Vista offers the
Performance Monitor tool, which you display by following these steps:
1. Select Start, Control Panel to open the Control Panel window.
2. Select System and Maintenance to open the System Maintenance
window.
3. Select Administrative Tools to open the Administrative Tools window.
4. Double-click Reliability and Performance Monitor. The User Account
Control dialog box appears.
5. Enter your UAC credentials to continue. Windows Vista displays the
Reliability and Performance
Monitor.
The Reliability and Performance branch
displays the Resource Monitor, which is
divided into six sections:
■ Resource Overview. This section
shows graphs of the data in the
CPU, Disk, Network, and Memory
sections.
■ CPU. This section shows the per-
centage of CPU resources that your
400
Networking with Microsoft
®
Windows Vista
™
17
You can also open the
Reliability and Perfor-
mance Monitor by pressing Win-
dows Logo+R (or selecting Start,
All Programs, Accessories, Run) to
open the Run dialog box, typing
perfmon
, clicking OK, and then
entering your UAC credentials
when prompted. (Alternatively,
select Start, type
perfmon
in the
Search box, and then click perf-
mon in the search results.)
tip
Please purchase PDF Split-Merge on www.verypdf.com to remove this watermark.
system is using. Click anywhere on the CPU bar to expand the section
and show the percentage of resources that each running process is
using.
■ Disk. This section shows the total hard disk input/output transfer rate
(disk reads and writes in kilobytes per second). Click anywhere on the
Disk bar to expand the section to see the files involved in the current
disk I/O operations.
■ Network. This section shows the total network data-transfer rate (data
sent and received in kilobits per second). Click anywhere on the
Network bar to expand the section to see the remote computers and
other processes involved in the current network transfers, as shown in
Figure 17.4.
CHAPTER 17 Monitoring Your Network
401
17
FIGURE 17.4
The new Reliability and Performance Monitor enables you to monitor various aspects of your
system.
■ Memory. This section shows the average number of hard memory
faults per second and the percentage of physical memory used. Click
anywhere on the Memory bar to expand the section to view the indi-
vidual processes in memory.
■ Learn More. This section contains links to the Reliability and
Performance Monitor help files.
Please purchase PDF Split-Merge on www.verypdf.com to remove this watermark.
For more detailed network performance monitoring, select the Reliability and
Performance Monitor, Monitoring Tools, Performance Monitor branch. The
Performance Monitor appears, as shown in Figure 17.5.
402
Networking with Microsoft
®
Windows Vista
™
17
Add
Properties
FIGURE 17.5
You can use Performance Monitor to keep an eye on your network performance.
Performance Monitor’s job is to provide you with real-time reports on how
various system settings and components are performing. Each item is called a
counter, and the displayed counters are
listed at the bottom of the window.
Windows Vista shows just one counter at
first—the % Processor Time, which tells
you the percentage of time the processor is
busy. However, as you see in the next sec-
tion, you can add more counters to moni-
tor what you want. Each counter is
assigned a different colored line, and that
color corresponds to the colored lines
shown in the graph. Note, too, that you
can get specific numbers for a counter—
the most recent value, the average, the
minimum, and the maximum—by click-
ing a counter and reading the boxes just
below the graphs.
By default, Performance
Monitor samples the
performance data every second.
To change the sample interval,
right-click Performance Monitor
and then select Properties. (You
can also press Ctrl+Q or click the
Properties button in the toolbar,
pointed out in Figure 17.5.) In the
Performance Monitor Properties
dialog box, display the General
tab, and modify the value in the
Sample Every X Seconds text box.
Click OK to put the new sample
interval into effect.
tip
Please purchase PDF Split-Merge on www.verypdf.com to remove this watermark.
The idea is that you should configure Performance Monitor to show the
processes you’re interested in (such as current network bandwidth) and then
keep Performance Monitor running while you perform your normal chores. By
examining the Performance Monitor readouts from time to time, you gain an
appreciation of what is typical on your system. Then, if you run into perform-
ance problems, you can check Performance Monitor to see whether you’ve run
into any bottlenecks or anomalies.
Adding Performance Counters
To add another setting to the Performance Monitor window, follow these steps:
1. Right-click Performance Monitor and then click Add Counters. (You can
also press Ctrl+I or click the Add button in the toolbar; see Figure 17.5.)
The Add Counters dialog box appears
2. Double-click the counter category
you want to work with.
3. Select the counter you want. If you
need more information about the
object, activate the Show
Description check box.
4. If the counter has multiple instances
(see Figure 17.6), select the instance
you want from the Instances of
Selected Object List. (For example, if
you choose Network Interface as the
performance object and your system
has multiple network interface
cards, you need to choose which
NIC you want to monitor. You can
also usually select
<All Instances>
to monitor the total of all the
instances.)
5. Click Add. Performance Monitor
places the counter in the Added
Counters list.
6. Repeat steps 2–5 to add any other
counters you want to monitor.
7. Click OK.
CHAPTER 17 Monitoring Your Network
403
17
The graph is only useful
if you can see the results
properly. Unfortunately, some-
times the scale of the graph isn’t
appropriate for the numbers gen-
erated by a particular counter.
The default scale is from 0 to 100;
so if a counter regularly gener-
ates numbers larger than 100, all
you’ll see is a straight line across
the top of the graph. Similarly, if a
counter regularly generates very
small numbers, the counter’s
graph will be a straight line
across the bottom of the graph.
To fix this, you can change the
scale used by the Performance
Monitor graph. Right-click Perfor-
mance Monitor, and then select
Properties. (You can also press
Ctrl+Q or click the Properties but-
ton in the toolbar.) In the Perfor-
mance Monitor Properties dialog
box, display the Graph tab and
modify the values in the Maxi-
mum and Minimum text boxes. I
also find that activating the Hori-
zontal Grid check box helps you
to interpret the graph. Click OK to
put the new settings into effect.
tip
Please purchase PDF Split-Merge on www.verypdf.com to remove this watermark.



![Tài liệu Microsoft Windows Vista Tutorials [VTC] pptx](https://media.store123doc.com/images/document/13/ce/pe/medium_pew1387001705.jpg)
