Báo cáo y học: "Strength training improves muscle quality and insulin sensitivity in Hispanic older
Bạn đang xem bản rút gọn của tài liệu. Xem và tải ngay bản đầy đủ của tài liệu tại đây (367.67 KB, 9 trang )
Int. J. Med. Sci. 2007, 4
19
International Journal of Medical Sciences
ISSN 1449-1907 www.medsci.org 2007 4(1):19-27
© Ivyspring International Publisher. All rights reserved
Research Paper
Strength training improves muscle quality and insulin sensitivity in
Hispanic older adults with type 2 diabetes
Naomi Brooks
1
, Jennifer E. Layne
1
, Patricia L. Gordon
1 3
, Ronenn Roubenoff
1 2
, Miriam E. Nelson
1 2 4
,
Carmen Castaneda-Sceppa
1 2
1. Jean Mayer USDA Human Nutrition Research Center on Aging, Tufts University, Boston MA, USA.
2. The Friedman School of Nutrition Science and Policy, Tufts University, Boston MA, USA.
3. Department of Physiological Nursing, University of California, San Francisco, CA, USA.
4. John Hancock Center for Physical Activity and Nutrition, Tufts University, Boston, MA, USA
Correspondence to: Carmen Castaneda-Sceppa, M.D., Ph.D., Tufts University, 711 Washington St.; Boston, MA 02111. Telephone (617)
556-3081 Fax (617) 556-3083 E-mail
Received: 2006.11.08; Accepted: 2006.12.16; Published: 2006.12.18
Hispanics are at increased risk of morbidity and mortality due to their high prevalence of diabetes and poor
glycemic control. Strength training is the most effective lifestyle intervention to increase muscle mass but limited
data is available in older adults with diabetes. We determined the influence of strength training on muscle quality
(strength per unit of muscle mass), skeletal muscle fiber hypertrophy, and metabolic control including insulin
resistance (Homeostasis Model Assessment –HOMA-IR), C-Reactive Protein (CRP), adiponectin and Free Fatty
Acid (FFA) levels in Hispanic older adults. Sixty-two community-dwelling Hispanics (>55 y) with type 2 diabetes
were randomized to 16 weeks of strength training plus standard care (ST group) or standard care alone (CON
group). Skeletal muscle biopsies and biochemical measures were taken at baseline and 16 weeks. The ST group
show improved muscle quality (mean±SE: 28±3) vs CON (-4±2, p<0.001) and increased type I (860±252µm
2
) and
type II fiber cross-sectional area (720±285µm
2
) compared to CON (type I: -164±290µm
2
, p=0.04; and type II:
-130±336µm
2
, p=0.04). This was accompanied by reduced insulin resistance [ST: median (interquartile range)
-0.7(3.6) vs CON: 0.8(3.8), p=0.05]; FFA (ST: -84±30µmol/L vs CON: 149±48µmol/L, p=0.02); and CRP [ST:
-1.3(2.9)mg/L vs CON: 0.4(2.3)mg/L, p=0.05]. Serum adiponectin increased with ST [1.0(1.8)µg/mL] compared
to CON [-1.2(2.2)µg/mL, p<0.001]. Strength training improved muscle quality and whole-body insulin sensitivity.
Decreased inflammation and increased adiponectin levels were related with improved metabolic control. Further
studies are needed to understand the mechanisms associated with these findings. However, these data show that
strength training is an exercise modality to consider as an adjunct of standard of care in high risk populations
with type 2 diabetes.
Key words: diabetes, strength training, Hispanic, skeletal muscle, insulin sensitivity
1. Introduction
Type 2 diabetes is a chronic disease characterized
by hyperglycemia and disturbances of carbohydrate,
fat and protein metabolism [1]. Diet, exercise and
weight loss are cornerstones of diabetes management
to improve glycemic control, reduce muscle wasting
and mortality [2]. Targeted interventions are needed to
improve long-term diabetes control in high risk groups,
like Hispanic older adults for whom diabetes and poor
glycemic control are prevalent [3].
Endurance training has traditionally been
advocated for people with diabetes [4]. More recently,
strength training has been tested as a means to build
muscle mass, strength and quality in healthy
individuals and those suffering from chronic
conditions like diabetes. Muscle quality, defined as
maximal force production per unit of muscle mass,
may be a better indicator of muscle
function than
strength alone [5]. There are many properties of
skeletal muscle which contribute to muscle quality
including fiber type, composition and size; contractile
properties; innervation; capillarity and metabolic
capacity [6]. Muscle quality has been shown to be
lower in older than younger individuals [7] and
recently, it has been noted that people with diabetes
have significantly lower muscle quality than those
without the disease [8].
Adipokines are soluble proteins released from
adipocytes in response to metabolic signals and are
involved in insulin resistance and inflammation [9]. In
contrast to other adipokines, adiponectin levels
decrease with increasing fat mass and higher levels of
plasma adiponectin are independently associated with
reduced risk of type 2 diabetes in healthy individuals
[10]. Adiponectin also has an anti-inflammatory action
[11]. Since diabetes and obesity are considered chronic
inflammatory states, we chose to measure a prominent
systemic marker of low-grade tissue inflammation,
C-reactive Protein (CRP) [12]. Circulating levels of
CRP are associated with adiponectin [12] and
individuals with the metabolic syndrome have higher
Int. J. Med. Sci. 2007, 4
20
levels of CRP [13].
There is relatively sparse amount of literature on
high-intensity strength training and diabetes in high
risk populations. Maiorana et al. [14] circuit training
intervention found increase in muscle mass and
strength, and cardiovascular fitness. Similalry, Cauza
et al. [15] , Tokmakidis et al. [16], and Eriksson et al [17]
showed that moderate-intensity strength training is an
effective exercise modality to achieve glycemic control
and improve insulin sensitivity in subjects with type 2
diabetes. More recently, two randomized control trials
of high-intensity strength training by Dunstan et al. [18]
and Castaneda et al. [19], with the latter representing
the parent study from which the present investigation
has been derived; have shown that long-term strength
significantly improves glycemic control and increases
skeletal muscle mass. In addition, strength training has
also been shown to influence a number of factors
associated with whole-body insulin sensitivity such as
CRP and pro-inflammatory cytokines [20]. A few
recent studies have investigated exercise training on
circulating adiponectin levels. These studies have
shown that greater increases in adiponectin levels are
associated with higher intensities of endurance
exercise training [21, 22] and strength training [23].
To our knowledge no previous studies have
investigated the effects of high-intensity strength
training on muscle quality and whole-body insulin
sensitivity in a high risk population of older adults
with diabetes. This is why we chose to conduct this
investigation in Hispanic older adults with type 2
diabetes. We hypothesized that 16 weeks of
high-intensity strength training would result in
improved muscle quality, skeletal muscle fiber
hypertrophy as well as improved metabolic control (as
measured by reduced insulin resistance and
inflammation) in these study subjects.
2. Research Design and Methods
Subject characteristics
Sixty-two Hispanic individuals, 55 years and
older with type 2 diabetes were randomized to 16
weeks of strength training plus standard care (ST
group, n=31) or standard care alone (CON group,
n=31). General methodology has been previously
reported [19]. Briefly, diabetes was confirmed by a
fasting plasma glucose ≥ 7.0 mmol/L or use of diabetic
medications. Exclusion criteria included the following:
myocardial infarction (within past 6 months), any
unstable chronic condition including dementia,
alcoholism, dialysis, retinal hemorrhage or detachment,
or current participation in resistance training. Written
informed consent was given in Spanish, as approved
by the Institutional Review Board at Tufts
University-New England Medical Center.
Intervention
Strength training (ST) group
Subjects reported to the Jean Mayer USDA
Human Nutrition Research Center on Aging (HNRCA)
3x/week for 16 weeks for exercise training. Exercise
sessions included 35-min strength training using five
pneumatic machines: upper back, chest press, leg press,
knee extension and flexion (Keiser Sports Health
Equipment Inc., Fresno, CA) with 3 sets of 8 repetitions
on each machine preceded by 5-min warm-up and
ended with 5-min cool-down. Training intensity
during wks 1-8 were 60-80% of baseline 1-repetition
maximum (1RM), and during wks 10-14 were 70-80%
of mid-study 1RM. Postprandial blood glucose was
monitored before and after exercise using a One Touch
Glucometer (Lifescan Inc., Johnson & Johnson Co.,
Milpitas, CA).
Control (CON) group
Subjects randomized to this group were asked to
continue their usual standard of care. This included
actions known to favorably affect health
outcomes
such as: glycemic control, blood glucose
self-monitoring, engaging in healthy food choices and
physical activity, and compliance with medications
and doctor’s visits [24]. Subjects in this group received
phone calls every other week and came to the HNRCA
for testing at baseline and 16 weeks. We chose this
approach rather than an attention-control to test the
effect of standard of care alone.
Outcome measures
Baseline measures were taken prior to
randomization. Post-intervention measures were
performed in a blinded manner except for muscle
strength.
Body composition
Body mass index (BMI) was calculated from body
weight and height as kg/m
2
. Whole-body and regional
lean and fat mass were determined by Dual-X ray
absorptiometry (DXA) using an Hologic QDR2000
(Waltham, MA) scanner operating in array mode with
software 5.64A, with a coefficient of variation of 1.4%
and 1.8% for lean and fat mass, respectively [25]. DXA
has been validated against multicompartment
methods and in-vivo neutron inelastic scattering [25].
Waist circumference was determined by standard
technique.
Muscle strength
Muscle strength 1RM was assessed twice at
baseline and once during week 16 on each training
machine. Initial training loads and analyses used the
highest of the two 1RM values assessed at baseline.
The coefficient of variation for repeated measures at
baseline was less than 10%. Upper and lower body
strength at baseline and 16 weeks was calculated as the
sum of 1RM measures for each upper and lower body
exercise performed.
Muscle quality
Skeletal muscle quality as defined by the ratio of
strength per unit of muscle mass [7]. There are a
number of ways to express muscle quality. We chose to
calculate muscle quality from leg 1RM strength (leg
press, knee extension and knee flexion) in kg divided
by leg lean body mass in kg, without bone mineral
Int. J. Med. Sci. 2007, 4
21
content, as measured by DXA. The appendicular
fat-free mass derived from leg measurement of DXA is
assumed to be a valid estimation of skeletal muscle
[26].
Skeletal muscle histology: Fiber type and cross-sectional area
(CSA)
Skeletal muscle samples were obtained from a
sub-set of individuals who agreed to have the
procedure (n = 24 ST, n = 18 CON). Percutaneous
needle biopsies were taken from the non-dominant
vastus lateralis using a 5 mm Bergstrom needle [27] at
baseline and 72 h after final 1RM strength testing (wk
16). Muscle samples were oriented longitudinally,
mounted in embedding medium (Tissue-Tek OCT,
Miles Laboratories, Elkhart, IN), and frozen in
isopentane cooled in liquid nitrogen. Transverse
sections (10µm) were cut using a Leica
CM1850-Cryostat (Leica Microsystem, Nussloch,
Germany). Staining for myofibrillar adenosine
triphosphatase (mATPase) was done at pH 4.3 [28].
Type I and II muscle fiber cross-sectional areas were
determined in 75-250 fibers for each subject at each
time point. Samples were analyzed under light
microscopy and areas determined using an Image
Software version 1.39 (Dr. W. Rasband, National
Institute of Aging, Bethesda, MD), modified for our
laboratory by Chun-ShanYam Ph.D. (SyLoc
Consulting LLP, Lexington, MA) with CV of 3% [28].
Biochemical measures
Fasting blood measures were taken at baseline
and 72 h after final 1RM strength testing (wk 16).
Fasting plasma glucose was determined by the
hexokinase enzymatic method (Sigma Diagnostics, St.
Louis, MO) and insulin levels by radioimmunoassay
(ICN Biomedical Inc., Costa Mesa, CA) with CV of 5%.
Free fatty acids (FFA) were determined by in vitro
enzymatic colorimetric endpoint method for
quantification of non-esterified FFA in serum (Walo
Chemicals USA, Inc., Richmond, VA) with CV of 6%.
Serum C-Reactive Protein (CRP) levels were measured
by an immunoturbidimetric commercially available kit
in a Cobas Fara II automated centrifugal analyzer (CRP
SPQ Test System, DiaSorin Inc., Stillwater, MN) with
CV of 5%. Serum adiponectin was determined in
duplicate using a highly sensitive, quantitative
sandwich enzyme immunoassay technique (Human
Adiponectin/Acrp30 Quantikine Immunoassay, R&D
Systems, Minneapolis, MN) with CV of 3%.
HOMA-IR
Whole-body insulin resistance was estimated
using the homeostasis model assessment of insulin
resistance (HOMA-IR) which correlates well with the
euglycemic hyperinsulinemic clamp in people with
diabetes [29]. The following formula was used:
HOMA-IR = [fasting Glucose (mmol/L)*fasting
Insulin (uU/ml)]/22.5.
Subject Monitoring
Subjects continued their usual medical care and
received Spanish translated recommendations for
diabetes self-management [24]. They were not given
dietary counseling other than to follow standard
recommendations given by their health care providers.
Both groups were administered a weekly symptom
checklist to document blood glucose self-monitoring,
diabetes control, medical visits, medication changes,
acute illness, and hospitalizations. Past seven-day,
self-reported leisure and household physical activity
was monitored using the Physical Activity Scale for the
Elderly [30]. Dietary intake was assessed using a food
frequency questionnaire adapted for the Hispanic
population [31].
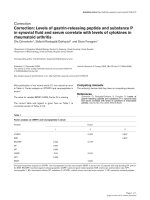
Table 1: Baseline Subject Characteristics
ST Group
N=31
CON Group
N=31
P value
a
Age (years) 66 ± 2 66 ± 1 0.76
Sex (male/female) 21/10 19/12 0.59
BMI (kg/m
2
) 30.9 ± 1.1 31.2 ± 1.0 0.81
Whole-Body Fat Mass (kg) 35.0 ± 2.2 33.7 ± 2.4 0.70
Waist Circumference (cm) 99.7 ± 2.3 100.1 ± 2.6 0.63
Fasting Glucose (mmol/L) 8.79 ± 0.48 9.85 ± 0.69 0.21
Fasting Insulin (pmol/L) 116 (124) 115 (131) 0.58
HOMA-IR 7.1 (5.7) 6.7 (9.0) 0.96
Glycosylated Hb A1C (%) 8.7 ± 0.3 8.4 ± 0.3 0.58
Diabetes Duration (y) 8 ± 1 11 ± 1 0.22
Insulin Therapy (n) 15 5 0.02
Data are mean ± SE except for not normally distributed variables (insulin
and HOMA-IR) which show median (interquartile range).
a
Baseline comparisons between groups were assessed by
independent sample t-test comparisons for continuous and log
transformed variables or Chi-square for categorical variables.
Statistical Analysis
Statistical analysis was based on intention-to-treat
analysis using SPSS 12.0 for Windows (SPSS, Inc.,
Evanston, IL). Results were considered statistically
significant with a two-tailed p-value < 0.05. Data are
shown as mean and standard error (SE), except for
non-normally distributed variables (insulin, HOMA-IR,
CRP, adiponectin) for which group median and
interquartile ranges are shown. The non-normally
distributed variables were log-transformed, checked
for normality after log transformation, and used as
continuous log-transformed variables for analyses.
Baseline comparisons were assessed by independent
sample t-test or Chi-square as appropriate. Repeated
measures analysis of covariance (ANCOVA) was used
to assess differences in outcome measures (muscle
quality, muscle fiber size and metabolic parameters)
between the two groups across time, as well as
time-by-group interactions adjusting for insulin
therapy as this was the only variable different between
groups at baseline (Table 1), and for the observed
changes in leisure time physical activity and diabetes
medications observed after the intervention.
Secondary model-building stepwise regression
analyses of the change (weeks 16-0) in type I muscle
fiber CSA (as the dependent variable) were carried out
by group in order to determine the associations of
selected factors on the change in type I CSA.
Independent variables included in the models were the
changes in HOMA-IR, CRP, adiponectin, and FFA.
Int. J. Med. Sci. 2007, 4
22
3. Results
Baseline characteristics and study monitoring
The subject characteristics at baseline are shown
in Table 1. The ST and CON groups did not differ by
age, sex, body composition or metabolic characteristics,
except that a higher proportion of prescribed insulin
therapy was found in participants randomized to the
ST group. As previously described [19], diabetic
medication regimens were reduced in 22 out of the 31
(72 %) subjects in the ST group with 13 subjects having
a reduction in sulfonylureas, 7 in biguanides, and 2 in
insulin therapy. In contrast, CON subjects showed the
opposite pattern. Thirteen out of 31 (42 %) subjects
experienced an increase in their diabetes medication
dosages, with 4 subjects having an increase in
sulfonylureas, 6 in biguanides, and 3 in insulin therapy.
The changes in medications, as prescribed by subjects’
primary care physicians, were different between
groups (p= 0.03). Another change resulting from the
intervention was a significant increase in leisure time
physical activity in the ST group, outside of training
regimen, as compared to CON subjects (ST: 187 ± 27
kcal/wk vs CON: -50 ± 19 kcal/week; p<0.001). Finally,
there was no change in dietary intake as a result of this
intervention (data not shown).
Muscle quality and muscle fiber size
Compliance to strength training was 90 ± 10 %.
Muscle strength, lean tissue mass, muscle quality, and
vastus lateralis muscle fiber cross-sectional area are
shown in Table 2. Mean upper and lower body muscle
strength was significantly improved in with ST
compared to CON subjects. This is not surprising
given that the mean training intensity achieved by the
ST group was 70.2 ± 1.3 % of 1RM (range: 66 to 75 %).
Whole-body lean body mass also increased in the ST
group, while leg lean tissue mass did not change
between the groups. Muscle quality, a functional
measurement of strength per unit volume of muscle
(calculated from lower body muscle strength values in
kg and leg lean tissue mass in kg), was significantly
improved in the ST group vs CON group. Finally, we
observed hypertrophy of type I and type II muscle
fiber CSA in the ST group compared to CON subjects.
Metabolic control
As shown in Table 3, overall glycemic control (as
determined by glycosylated hemoglobin A1C levels)
was improved with strength training, while there was
virtually no change in the CON group. Similarly,
insulin resistance determined by HOMA-IR, was
significantly reduced in the ST group after 16 weeks of
training compared with the CON group. The change in
HOMA-IR was driven by a reduction in insulin
concentration in the ST group, albeit not statistically
significant when compared to the CON group. In
addition, serum FFA and CRP levels decreased in the
ST group compared to CON subjects. Finally,
circulating adiponectin concentrations increased
significantly in the ST group compared with controls.
Table 2: Muscle Quality and Muscle Fiber Size
ST Group CON Group
N=31 Change N=31 Change
P value
a
Upper Body Muscle Strength (kg)
Baseline 66 ± 4 62 ± 4
Final 90 ± 6 24 ± 2 58 ± 4 - 4 ± 2 <0.001
Lower Body Muscle Strength (kg)
Baseline 338 ±
27
300 ±
28
Final 568 ±
34
173 ± 19 285 ±
27
- 19 ± 7 <0.001
Whole-Body Lean Tissue Mass (kg)
Baseline 44.3 ±
1.7
44.9 ±
1.9
Final 45.5 ±
1.9
1.1 ± 0.3 44.8 ±
1.7
0.4 ± 0.2 0.04
Leg Lean Tissue Mass (kg)
Baseline 12.9 ±
0.6
12.7 ±
0.6
Final 13.1 ±
0.6
0.2 ± 0.1 12.8 ±
0.5
0.1 ± 0.2 0.28
Muscle Quality
Baseline 61 ± 5 51 ± 4
Final 100 ± 6 28 ± 3 48 ± 4 - 4 ± 2 <0.001
Type I muscle fiber area (µm
2
)
Baseline 4068 ±
256
4546 ±
270
Final 4928 ±
372
860 ± 252 4381 ±
304
- 164 ±
290
0.04
Type II muscle fiber area (µm
2
)
Baseline 3885 ±
278
4330 ±
346
Final 4605 ±
283
720 ± 285 4201 ±
336
- 130 ±
336
0.04
Data are the mean ± SE of baseline and final values and of the change on
each variable in each group.
Muscle Quality data calculated for all participants. Baseline and final
muscle biopsies were obtained in a subset of the study population (n
= 24 ST; n = 18 CON).
a
Time-by-group interactions were assessed by repeated measures
ANCOVA of baseline and final values for each variable adjusted for
insulin therapy, change in physical activity and change in diabetes
medications.
Secondary analyses
We further assessed the association of specific
physiological and biochemical measures and the
observed changes in type I muscle fiber CSA. Type I
fibers were chosen for this analysis because they have
higher insulin sensitivity, greater oxidative capacity,
more mitochondria, and are more closely associated
with leanness than type II fibers [32, 33]. In univariate
analysis, there was a negative correlation between the
changes observed in type I muscle fiber CSA and those
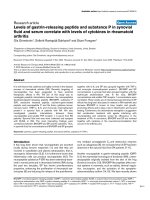
seen for HOMA-IR in the ST group (Figure 1A) but not
in the CON group (Figure 1B). This is in line with the
strong inverse correlation between glycosylated
hemoglobin A1C and muscle cross-sectional area
observed by other investigators [17].
There were no associations between the changes
in CRP, FFA, adiponectin, lower body muscle strength
or leg lean body mass and the change in type I fiber
CSA for either group, nor between the changes in
HOMA-IR with any of the changes observed in CRP,
FFA, adiponectin levels in either group. Using
multiple regression models, we found that the change
Int. J. Med. Sci. 2007, 4
23
in HOMA-IR was the only independent variable
negatively associated with the change seen in type I
muscle fiber CSA after 16 weeks of strength training,
accounting for 53% of its variability (p=0.03). There
were no variables significantly associated with the
change in type I CSA in the CON group.
Figure 1. Univariate linear association between the absolute change in type I muscle fiber cross-sectional area and the change
in HOMA-IR for each subject in the ST group (A: r= - 0.50, p=0.01) and the CON group (B: r= - 0.10, p=0.42) are shown.