Pentaho Reporting 3.5 for Java Developers- P6
Bạn đang xem bản rút gọn của tài liệu. Xem và tải ngay bản đầy đủ của tài liệu tại đây (818.47 KB, 50 trang )
Chapter 9
[
233
]
The
ReportActionEvent
object returned in the callback provides the
following information:
// The PreviewPane object
public Object getSource();
// The reporting node object
public RenderNode getNode();
// The action parameter specified in the report.
public Object getActionParameter();
To register a
ReportActionListener
, you must call
PreviewDrawablePanel.addRe
portActionListener(listener)
. The
PreviewDrawablePanel
is accessible via the
PreviewPane.getReportPreviewArea()
API call.
ReportMouseListener
The
org.pentaho.reporting.engine.classic.core.modules.gui.base.event.
ReportMouseListener
interface provides the following callbacks:
public void reportMouseClicked(ReportMouseEvent event);
public void reportMousePressed(ReportMouseEvent event);
public void reportMouseReleased(ReportMouseEvent event);
These are triggered when a user has clicked, pressed, or released their mouse within
a report. Each listener registered is called for every element found at the specic X,
Y location within the report. If there are two or more elements overlapping, multiple
event calls will be made, one for each of the report elements. The
ReportMouseEvent
provides the following information when a callback occurs:
// The PreviewPane object
public Object getSource();
// The reporting node object
public RenderNode getSourceNode();
// The original java.awt.event.MouseEvent
public MouseEvent getSourceEvent();
To register a
ReportMouseListener
, you must call
PreviewDrawablePanel.addRe
portMouseListener(listener)
. The
PreviewDrawablePanel
is accessible via the
PreviewPane.getReportPreviewArea()
API call.
This material is copyright and is licensed for the sole use by David Martone on 16th September 2009
710 South Avenue West, , Westfield, , 07090Please purchase PDF Split-Merge on www.verypdf.com to remove this watermark.
Building Interactive Reports
[
234
]
By combining these callbacks with additional API calls using the
PageDrawable
API, you can resolve the elements at any particular X, Y location within a report.
The
PageDrawable
API denes the following methods:
// Retrieves ReportNodes based on x and y location.
// A namespace and name filter may be applied to only
// retrieve nodes that define a certain attribute.
public RenderNode[] getNodesAt (final double x,
final double y, final String namespace, final String name);
// Retrieves nodes within a window, starting at an x,y
// location and stretching out to the defined pixel width
// and height. A namespace and name filter may be applied
// to only retrieve nodes that define a certain attribute.
public RenderNode[] getNodesAt (final double x,
final double y, final double width, final double height,
final String namespace, final String name);
The
PageDrawable
object is accessible via the
PreviewDrawablePanel.
getPageDrawable()
API call.
Interactive Swing example
In this example, you'll combine the three listener interfaces into a simple report that
demonstrates the various callbacks. To begin, you need to set up your environment.
First, you need to create a new folder called
chapter9,
and copy over the JAR les
from the
chapter3/lib
folder into
chapter9/lib
. Also, copy the
chapter3/data
folder to
chapter9/data
so that you may reuse the already congured ElectroBarn
data source. Finally, copy the
chapter3/build.xml
le into the
chapter9
folder so
that you can build the example.
You'll reuse the
Chapter2SwingApp
class from Chapter 2 as a shell to build
from. Copy
chapter2/src/Chapter2SwingApp.java
to
chapter9/src/
Chapter9SwingApp.java
, and rename the class to
Chapter9SwingApp
.
Now that you've created the
Chapter9SwingApp
class, you're ready to begin
designing the report, along with adding the various Swing event listeners to your
Swing
PreviewDialog
. Launch Pentaho Report Designer and create a new report.
For the master report, dene the following ElectroBarn SQL query, which you used
in Chapter 8:
SELECT
"ENDOFDAY"."SESSIONID",
"ENDOFDAY"."EMPLOYEEID",
"ENDOFDAY"."ACTUALCHECKTOTAL",
This material is copyright and is licensed for the sole use by David Martone on 16th September 2009
710 South Avenue West, , Westfield, , 07090Please purchase PDF Split-Merge on www.verypdf.com to remove this watermark.
Chapter 9
[
235
]
"ENDOFDAY"."ACTUALCASHTOTAL",
"ENDOFDAY"."CHECKOUTTIME"
FROM
"ENDOFDAY"
ORDER BY
"ENDOFDAY"."SESSIONID" ASC
In the Details band of the master report, place two labels with the text
Session
ID
and
Employee ID
, along with dragging and dropping the SESSIONID and
EMPLOYEEID elds into the band. For the SESSIONID eld, also specify the
following formula for the Swing
action
attribute:
=[SESSIONID]
Later in this example, you'll register a
ReportActionListener
, which will receive
the SESSIONID as an input parameter, when clicked on the SESSIONID eld.
Also, enable row banding by adding a background rectangle and setting its visible
style formula to the following:
=IF(ISODD([SESSIONID]);TRUE();FALSE())
Now, place an inline sub-report element below the content within the Details band.
Set the sub-report visible style attribute to the following formula:
=AND(NOT(ISNA([REPORT_PARAM_SESSIONID])); [SESSIONID] = [REPORT_PARAM_
SESSIONID])
This will evaluate to true if the parameter
REPORT_PARAM_SESSIONID
matches the
currently selected session. This parameter will be passed into the report when a user
clicks on the SESSIONID eld.
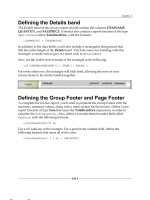
The Details band of the master report should look similar to this:
You're now ready to begin editing the sub-report. Double-click on the sub-report
element or right-click and select the Edit sub-report menu option to bring up the
sub-report for editing.
This material is copyright and is licensed for the sole use by David Martone on 16th September 2009
710 South Avenue West, , Westfield, , 07090Please purchase PDF Split-Merge on www.verypdf.com to remove this watermark.
Building Interactive Reports
[
236
]
The rst step to setting up the sub-report is to create a new data source query.
Create the following ElectroBarn SQL query as part of the sub-report:
SELECT
"PURCHASES"."SESSIONID",
"PURCHASES"."PAYMENTTYPE",
"PURCHASES"."PURCHASETIME",
"PURCHASES"."PURCHASEID",
"PURCHASEITEMS"."QUANTITY",
"INVENTORY"."SALEPRICE",
"INVENTORY"."ITEMNAME"
FROM
"PURCHASEITEMS" INNER JOIN "INVENTORY" ON
"PURCHASEITEMS"."ITEMID" = "INVENTORY"."ITEMID"
INNER JOIN "PURCHASES" ON "PURCHASEITEMS"."PURCHASEID" =
"PURCHASES"."PURCHASEID"
WHERE
"PURCHASES"."SESSIONID" = ${SESSIONID}
ORDER BY
"PURCHASES"."PURCHASEID" ASC
This query selects details only for the current SESSIONID. You must customize the
parameters that are available to the sub-report. You can do this by bringing up the
Sub-report Parameters dialog by right-clicking on the sub-report's Parameters tree
item under the Data tab and selecting the Edit Sub-report Parameters… menu item.
The following dialog will appear:
Now that you've dened the sub-report query, place a chart element in the report
header of the sub-report. Select the Pie chart type. Edit the chart element, setting the
value-column to QUANTITY and the series-by-eld to PURCHASEID.
This material is copyright and is licensed for the sole use by David Martone on 16th September 2009
710 South Avenue West, , Westfield, , 07090Please purchase PDF Split-Merge on www.verypdf.com to remove this watermark.
Chapter 9
[
237
]
Next to the chart, place two rectangle elements, along with two label elements
titled
Action 1
and
Action 2
within the rectangles. Set the name attribute of the
rectangles to Action1 and Action2—the names of the rectangles will be used by a
ReportMouseListener
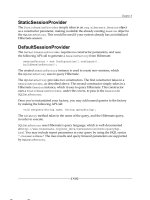
later in this example. Also, add a label below the rectangles
titled Google Reference. Set the url style formula of this label to a Google query,
which will search for the rst item in the dataset:
=" & [ITEMNAME]
The
&
symbol concatenates the ITEMNAME to the end of the query string. You'll
use this label to demonstrate the
ReportHyperlinkListener
. The sub-report should
look similar to this:
Save the master report as
chapter9/data/interactive_swing.prpt
. You're now
ready to update the
Chapter9SwingApp
class with event listeners.
This material is copyright and is licensed for the sole use by David Martone on 16th September 2009
710 South Avenue West, , Westfield, , 07090Please purchase PDF Split-Merge on www.verypdf.com to remove this watermark.
Building Interactive Reports
[
238
]
First, update the example to render the
interactive_swing.prpt
report in a
separate method:
public MasterReport createReport() throws IOException,
ResourceException {
ResourceManager manager = new ResourceManager();
manager.registerDefaults();
Resource res = manager.createDirectly(
new URL("file:data/interactive_swing.prpt"),
MasterReport.class);
MasterReport report = (MasterReport) res.getResource();
return report;
}
Replace the loading of the report in the
onPreview
method with the following code:
MasterReport report = createReport();
Now, you'll dene three event listeners. The rst event listener to be added is a
ReportActionListener
. This listener will re-render the report, displaying the
details of the clicked selection. You must rst set up a mechanism to pass the
current Session ID. Dene a class member of type String called
sessionId
:
Integer sessionId = null;
Add the following code at the end of the
createReport
method, which sets the
sessionId
as an input parameter if it's available:
if (sessionId != null) {
report.getParameterValues().put("REPORT_PARAM_SESSIONID", sessionId);
}
Now, add the following code right after the
preview.addWindowListener()
call:
preview.getPreviewPane().getReportPreviewArea().
addReportActionListener(new ReportActionListener() {
public void reportActionPerformed(ReportActionEvent event) {
Integer newSessionId = ((Number)event.getActionParameter()).
intValue();
if (!newSessionId.equals(sessionId)) {
sessionId = newSessionId;
SwingUtilities.invokeLater(new Runnable() {
public void run() {
try {
preview.setReportJob(createReport());
} catch (Exception e) {
e.printStackTrace();
This material is copyright and is licensed for the sole use by David Martone on 16th September 2009
710 South Avenue West, , Westfield, , 07090Please purchase PDF Split-Merge on www.verypdf.com to remove this watermark.
Chapter 9
[
239
]
}
}
});
}
}
});
Note that this example uses
SwingUtilities
to update the report once the current
event processing is complete.
The second listener to be added is the hyperlink listener. This listener will display a
message dialog. In a real application, this might launch a browser window. Add
the following code after the previously dened report action listener:
preview.getPreviewPane().addReportHyperlinkListener(new
ReportHyperlinkListener() {
public void hyperlinkActivated(final ReportHyperlinkEvent event)
{
SwingUtilities.invokeLater(new Runnable()
{public void run() {JOptionPane.showMessageDialog(null,
"Link Clicked: " + event.getTarget());}
});
}
});
The nal listener will determine which rectangle was clicked.
preview.getPreviewPane().getReportPreviewArea().addReportMouseListener
(new ReportMouseListener() {
public void reportMouseClicked(ReportMouseEvent event) {
if (event.getSourceNode() !=
null && event.getSourceNode().getName().equals("Action1")) {
JOptionPane.showMessageDialog(null, "Action 1 Rectangle Clicked");
} else if (event.getSourceNode() !=
null && event.getSourceNode().getName().equals("Action2")) {
JOptionPane.showMessageDialog(null, "Action 2 Rectangle Clicked");
}
}
public void reportMousePressed(ReportMouseEvent event) {}
public void reportMouseReleased(ReportMouseEvent event) {}
});
Remember, the mouse listener is called for every element that you clicked on. In this
case, you may have clicked on the label and the rectangle, a scenario which would
result in the event handler being called twice.
This material is copyright and is licensed for the sole use by David Martone on 16th September 2009
710 South Avenue West, , Westfield, , 07090Please purchase PDF Split-Merge on www.verypdf.com to remove this watermark.
Building Interactive Reports
[
240
]
Also, make sure to add the following imports to the beginning of the class le:
import org.pentaho.reporting.engine.classic.core.modules.gui.base.
event.ReportHyperlinkListener;
import org.pentaho.reporting.engine.classic.core.modules.gui.base.
event.ReportHyperlinkEvent;
import org.pentaho.reporting.engine.classic.core.modules.gui.base.
event.ReportActionListener;
import org.pentaho.reporting.engine.classic.core.modules.gui.base.
event.ReportActionEvent;
import org.pentaho.reporting.engine.classic.core.modules.gui.base.
event.ReportMouseListener;
import org.pentaho.reporting.engine.classic.core.modules.gui.base.
event.ReportMouseEvent;
import javax.swing.SwingUtilities;
import javax.swing.JOptionPane;
Now that you've added the event listeners, you're ready to build and run the report.
Add the following Ant target to the
build.xml
le:
<target name="runswinginteractive" depends="compile">
<java fork="true" classpathref="runtime_classpath" classname="Chap
ter9SwingApp"/>
</target>
Type
ant runswinginteractive
on the command line to verify the results.
The report should look similar to this:
This material is copyright and is licensed for the sole use by David Martone on 16th September 2009
710 South Avenue West, , Westfield, , 07090Please purchase PDF Split-Merge on www.verypdf.com to remove this watermark.
Chapter 9
[
241
]
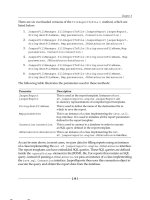
Click on the Session ID row to view the details of each session, and click on the
action rectangles and Google Reference label to view the alerts, triggered by the
report listeners.
Interactive reports in HTML
In addition to dening interactive reports in Swing, it is also possible to dene
highly customized interactive reports within the HTML/JavaScript environment.
Pentaho Reporting denes a set of properties, which when specied, allow for rich
interactivity between the user and a report. In this section, you will get an overview
of these properties, along with a rich example that demonstrates potential uses.
Interactive HTML report properties
All reporting elements share a common set of HTML-related properties that may
be used to create a dynamic report. Below is a list of properties and their uses:
HTML Properties
class
This property sets the class attribute of the current HTML entity
to the specied value.
name
This property sets the name attribute of the current HTML entity
to the specied value.
title
This property sets the title attribute of the current HTML entity to
the specied value.
xml-id
This property allows the naming of the current HTML entity,
setting the id attribute, making it possible to reference in outside
scripts.
append-body
This property allows the placement of raw HTML within the
body of the HTML document, prior to the rendering of the
current element.
append-body-footer
This property allows the placement of raw HTML within the
body of the HTML document, after the rendering of the current
element.
append-header
Dened only at the master report level, this property allows
the inclusion of raw HTML within the header of the HTML
document generated. This location is traditionally used to load
additional CSS les, as well as external JavaScript les.
This material is copyright and is licensed for the sole use by David Martone on 16th September 2009
710 South Avenue West, , Westfield, , 07090Please purchase PDF Split-Merge on www.verypdf.com to remove this watermark.
Building Interactive Reports
[
242
]
HTML Events
on-click
This property renders an onclick HTML attribute on
the currently dened element. This property is a string of
JavaScript that is executed within the browser when a user
clicks on the element.
on-double-click
This property renders an ondblclick HTML attribute on
the currently dened element. This property is a string of
JavaScript that is executed within the browser when a user
double-clicks on the element.
on-mouse-down
This property renders an onmousedown HTML attribute on
the currently dened element. This property is a string of
JavaScript that is executed within the browser when a user
presses a mouse button. This might be used to detect the
beginning of a drag operation.
on-mouse-up
This property renders an onmouseup HTML attribute on
the currently dened element. This property is a string of
JavaScript that is executed within the browser when a user
releases a mouse button.
on-mouse-move
This property renders an onmousemove HTML attribute on
the currently dened element. This property is a string of
JavaScript that is executed within the browser when a user
moves the mouse.
on-mouse-over
This property renders an onmouseover HTML attribute on
the currently dened element. This property is a string of
JavaScript that is executed within the browser when a user
moves the mouse over the element.
on-key-down
This property renders an onkeydown HTML attribute on
the currently dened element. This property is a string of
JavaScript that is executed within the browser when a user
presses a key down.
on-key-pressed
This property renders an onkeypressed HTML attribute
on the currently dened element. This property is a string of
JavaScript that is executed within the browser when a user
presses a key.
on-key-up
This property renders an onkeyup HTML attribute on
the currently dened element. This property is a string of
JavaScript that is executed within the browser when a user
releases a key.
This material is copyright and is licensed for the sole use by David Martone on 16th September 2009
710 South Avenue West, , Westfield, , 07090Please purchase PDF Split-Merge on www.verypdf.com to remove this watermark.
Chapter 9
[
243
]
Manipulating the reporting HTML DOM
It is possible to alter the HTML document object model dynamically, by combining
the
xml-id
property, along with the
on-click
event. For instance, by setting a label's
xml-id
to
example
, and setting the following JavaScript in the
on-click
property,
you can toggle between two text values:
document.getElementById('example').innerHTML= (document.getElementById
('example').innerHTML == 'Hello') ? 'Goodbye' : 'Hello';
Including an external CSS or JavaScript
resource
Using the master report object's
append-header
property, it is possible to include
CSS or JavaScript in your report. This is useful if you have written a large amount of
JavaScript that you would like to keep separate from your report, or if you want to
include a useful JavaScript library, as demonstrated in the example that will follow.
An example of the
append-header
value might be:
<link type="text/css" rel="stylesheet" href="custom.css" />
When implementing the server, it's important to make sure that the relative path
of the les referenced are accessible from the current document.
Interactive HTML example
As a demonstration of how an interactive report might work, this example walks you
through building a dashboard that includes rendering an HTML report with lters
and charts, with the ability to view the result in PDF format.
To begin, you'll need to create a standard report. Note that the master report in this
example does not require a query. You'll populate only the Report Header with two
sub-reports. First, add a label to the Report Header entitled Session ID, and add
a text eld that references the SESSIONID input parameter. Note that you do not
need to dene the input parameter in Report Designer, as this will be managed by
the web application. You'll now add two sub-reports to the Report Header. Place
two sub-report objects within the report header below the session information. The
result should look like this:
This material is copyright and is licensed for the sole use by David Martone on 16th September 2009
710 South Avenue West, , Westfield, , 07090Please purchase PDF Split-Merge on www.verypdf.com to remove this watermark.
Building Interactive Reports
[
244
]
You'll reuse the chart and summary sub-report denitions dened in Chapter 8 as
part of the side-by-side sub-report example. Follow the instructions in Chapter 8
for populating these sub-reports.
Also, you must create two identical master reports with the same content and query
as the sub-reports. Save these master reports as
chapter9/data/subreport_chart.
prpt
and
chapter9/data/subreport_summary.prpt
.
When complete, the chart sub-report should look like this:
And the summary sub-report should look like this:
When this dashboard example is complete, the sub-reports will be executed in two
different manners. The rst is rendered as a sub-report in the master report. The
second is an independent report, which will be executed via a call from the browser
and embedded within the existing report for dynamic updating. Save your report as
chapter9/data/dashboard.prpt
.
Now that you've dened the basic report without interactive capabilities, you'll set
up the server as well. Copy the
chapter3/src/Chapter3Servlet.java
example
to
DashboardServlet.java
in the
chapter9/src
folder. Rename the class to
DashboardServlet
. Also, copy
chapter3/war/WEB-INF/web.xml
to
chapter9/
war/WEB-INF/web.xml
. Open the
web.xml
le and change all references of
Chapter3Servlet
to
DashboardServlet
.
The new
DashboardServlet
requires the HTTP parameter
reportName
to be passed
so that the correct report is rendered. The two changes you'll need to make include
updating the Servlet to render reports as HTML, and to pass in the
sessionId
as
a report input parameter. First, you'll need to update the Session ID input parameter.
Update the
getParameterValues().put()
call to pass the
sessionId
as
SESSIONID
:
This material is copyright and is licensed for the sole use by David Martone on 16th September 2009
710 South Avenue West, , Westfield, , 07090Please purchase PDF Split-Merge on www.verypdf.com to remove this watermark.
Chapter 9
[
245
]
report.getParameterValues().put("SESSIONID", sessionId);
For the second modication, HTML documents require additional code to render,
as external les such as CSS, and images, must be cached and available over HTTP
after the report has already been generated. First, add a member variable of type
int
called
reportNum
:
int reportNum = 0;
Now, after the Excel rendering code, add the following lines of code:
} else if ("html".equals(outputFormat)) {
String reportLoc = "report_" + reportNum++;
String path = this.getServletContext().getRealPath(reportLoc);
File folder = new File(path);
folder.mkdir();
HtmlReportUtil.createDirectoryHTML(report,
path + File.separator + "index.html");
response.sendRedirect(reportLoc + "/index.html");
Note that this code creates a new folder with CSS, HTML, and images for every
request made to the server. In a production environment, these les would be hosted
temporarily while the report loaded, and then cleaned out automatically. Make sure
to add the following imports to complete the code changes:
import org.pentaho.reporting.engine.classic.core.modules.output.table.
html.HtmlReportUtil;
You'll now create the
chapter9/war/index.html
le with links to the three
regular reports:
<html>
<body>
<h1>Interactive Dashboard Example</h1>
<p>This is an example application demonstrating how to create an html
based interactive report.</p>
<a href="report?reportName=dashboard&outputFormat=html&sessionId=1">
Master Report</a> |
<a href="report?reportName=subreport_chart&outputFormat=html&sessionId
=1">Chart Report</a> |
<a href="report?reportName=subreport_summary&outputFormat=html&session
Id=1">Summary Report</a>
</body>
</html>
This material is copyright and is licensed for the sole use by David Martone on 16th September 2009
710 South Avenue West, , Westfield, , 07090Please purchase PDF Split-Merge on www.verypdf.com to remove this watermark.
Building Interactive Reports
[
246
]
You're now ready to test the base set of reports, which you'll use for the interactive
example. First, update the
build.xml
to build a
chapter9/war
folder vs. the
chapter2/war
folder. Now, type
ant war
, along with
ant start_tomcat
, and visit
http://localhost:8080/chapter9
in your web browser to view the three reports.
The rst is the master report.
The second is the chart report.
Finally, the last one is the summary report.
This material is copyright and is licensed for the sole use by David Martone on 16th September 2009
710 South Avenue West, , Westfield, , 07090Please purchase PDF Split-Merge on www.verypdf.com to remove this watermark.
Chapter 9
[
247
]
Now that you have the three reports rendering, you're ready to add interactive
elements, thereby creating a dynamic dashboard.
Adding interactive elements to the dashboard
The rst step is to add a commonly used JavaScript library known as
prototype.js
to the
dashboard.prpt
report. You can download
prototype.js
from
http://www.
prototypejs.org
. Place the
prototype.js
le in the
chapter9/war
folder.
This example uses version 1.6 of
prototype.js
. To include this JavaScript le
in your report, add the following text to the
append-header
property of the master
report object:
<script src="../prototype-1.6.0.3.js"></script>
Now, you're ready to add the Session ID select input. Place a label at the top of
the Report Header, in the space left available. Set the label text to
Select a
Session:
. Update the label's append-body-footer property to the following
HTML and JavaScript:
<script>
// this function removes cells and rows from
// the generated HTML report for dynamic rendering
function removeNodes(node) {
if (node) {
var next = node.nextSibling;
node.parentNode.removeChild(node);
removeNodes(next);
This material is copyright and is licensed for the sole use by David Martone on 16th September 2009
710 South Avenue West, , Westfield, , 07090Please purchase PDF Split-Merge on www.verypdf.com to remove this watermark.
Building Interactive Reports
[
248
]
}
}
// this function is triggered when a change occurs in the
// selection list
function filterChanged() {
var select = $('selection');
var currentValue = select.options[select.selectedIndex].text;
// remove cells to allow room for dynamic iframe reports
var summary = $('summary');
removeNodes(summary.nextSibling);
removeNodes(summary.parentNode.nextSibling);
summary.colSpan = "7";
summary.className= "";
// update the chart component with the correct filter
$('chart').innerHTML = "<iframe width='261' height='240'
scrolling='no' frameborder='0'
src='../report?reportName=subreport_chart&outputFormat=
html&sessionId="+currentValue+"'/>";
// update the pdf link with the correct filter
summary.innerHTML = "<iframe width='375' height='300' scrolling='no'
frameborder='0'
src='../report?reportName=subreport_summary&outputFormat=
html&sessionId="+currentValue+"'/>";
var pdfLink = document.getElementById('pdfLink');
pdfLink.sessionId.value = currentValue;
}</script>
<form style="display:inline">
<select id="selection" name="sessionid" onchange="filterChanged()">
<option>1</option>
<option>2</option>
<option>3</option>
<option>4</option>
<option>5</option>
</select>
</form>
This JavaScript references the HTML document object model locations of the
sub-reports. In order for this to be successful, you need to specify the
xml-id
attribute for both the sub-reports as
chart
and
summary
.
This material is copyright and is licensed for the sole use by David Martone on 16th September 2009
710 South Avenue West, , Westfield, , 07090Please purchase PDF Split-Merge on www.verypdf.com to remove this watermark.
Chapter 9
[
249
]
The above JavaScript rst removes cells from the HTML document, and then places
two IFRAME elements within the HTML DOM. Pentaho Reporting renders a single
HTML table as output, so sub-reports don't get wrapped by a single HTML parent
element. The IFRAME elements must be used instead of direct HTML placements.
This is to make sure that CSS styles, and relative directory paths of images within
sub-reports, are both accessible.
Add a label with a single space to the right side of the report. You'll add a View As
PDF button at this location. Edit the append-body attribute of the empty label with
the following HTML and JavaScript:
<form style="display:inline" id="pdfLink" action="../report"
method="get">
<input type="hidden" name="reportName" value="dashboard"/>
<input type="hidden" name="outputFormat" value="pdf"/>
<input type="hidden" name="sessionId" value="1"/>
<input type="submit" value="View As PDF"/>
</form>
To demonstrate some of the event callback methods, specify the following
JavaScript within the
on-click
attribute of the
chart
sub-report element, within
the master report:
alert("You've clicked on the Chart");
Also, specify the following JavaScript within the
on-double-click
attribute of the
chart
sub-report element, within the master report:
alert("You've double clicked on the chart");
The nal master report should look like this in design mode within Report Designer:
You're now ready to save the changes and deploy them to the server. Note that there
are no changes necessary on the server side to enable this interactive report. In your
command prompt, type
ant war
to build the web archive, and
ant start_tomcat
to restart the server.
This material is copyright and is licensed for the sole use by David Martone on 16th September 2009
710 South Avenue West, , Westfield, , 07090Please purchase PDF Split-Merge on www.verypdf.com to remove this watermark.
Building Interactive Reports
[
250
]
When running the interactive report, your browser should show a selection list, as
well as a View As PDF button:
Select another Session ID, and notice how the chart and summary sub-reports
are dynamically updated. Finally, click the View as PDF button. Notice that the
append-body
attributes dened earlier do not render within the PDF document.
Summary
In this chapter, you learned how to build interactive reports using Swing and HTML
as outputs. You learned how to modify report denitions to generate hyperlink
events, swing action events, and many different HTML JavaScript events. You built
from the ground up a Swing demonstration that selectively shows details of sales
sessions from the ElectroBarn data source, along with demonstrating feedback via
the
ReportMouseListenter
API.
You also learned how to render an HTML report on a server, along with including
external script les within the HTML rendered report. You learned how to modify
the report HTML document object model dynamically when events are triggered
from the report. You also learned to view an HTML report as a dashboard, nally
allowing the HTML report to be rendered as PDF.
This material is copyright and is licensed for the sole use by David Martone on 16th September 2009
710 South Avenue West, , Westfield, , 07090Please purchase PDF Split-Merge on www.verypdf.com to remove this watermark.
API-based Report Generation
In this chapter, you'll learn about Pentaho Reporting's
.prpt
bundle le format,
along with the details of Pentaho Reporting's Java API. You'll be introduced to
the schemas of the various XML les that persist the data source, parameters,
expressions, layout, and style of a report.
With examples of Pentaho's Java API, you'll learn how easy it is to build a report
programmatically. You'll walk through a complete example that demonstrates
creating different reporting bands, as well as different elements within a report.
Finally, you'll be introduced to the Pentaho Wizard Java API.
Understanding the serialized report
format
Pentaho Reports are saved as
.prpt
bundle les. This is a ZIP-based le format that
includes all the necessary resources to render a report, also referred to as a bundle.
The
.prpt
bundle le contains a set of XML les that are crucial to rendering a
report, as well as additional resources such as embedded images and sub-reports.
This format is based on the OpenDocument format.
This section goes into detail about each of the primary les that make up a report,
along with providing a simple example of a report written by hand. With the
knowledge of the underlying le format, it is possible to generate reports outside
of the Java environment.
The key les that make up a report include
settings.xml
datadefinition.xml
,
along with individual data source les,
layout.xml
and
styles.xml
.
This material is copyright and is licensed for the sole use by David Martone on 16th September 2009
710 South Avenue West, , Westfield, , 07090Please purchase PDF Split-Merge on www.verypdf.com to remove this watermark.
API-based Report Generation
[
252
]
settings.xml
The
settings.xml
le contains global conguration properties for a report,
as well as a placeholder for future runtime information.
<?xml version="1.0"?>
<settings xmlns=" />classic/bundle/settings/1.0">
<configuration>
<property name="org.pentaho.reporting.engine.classic.core.
function.LogFormulaFailureCause">true</property>
</configuration>
<runtime/>
</settings>
One example of a conguration setting is related to the execution of formula
expressions. If you set the property
org.pentaho.reporting.engine.classic.
core.function.LogFormulaFailureCause
to
true
, and you have your Log4J
logging set to debug, you'll receive a stack trace, in addition to an error message,
when the formula fails.
Additional conguration properties are available, primarily for use in design tools
such as Pentaho Report Designer. Rarely would you need to dene a conguration
property while generating a report.
datadenition.xml and the datasources folder
The
datadefinition.xml
le contains information about report input parameters,
the report data source, as well as report functions and expressions. The root element in
this XML le is
data-definition
, and uses the
/>namespaces/engine/classic/bundle/data/1.0
namespace for XML validation.
Parameters
Parameters are dened as children to the
data-definition/parameter-definition
element. There are two types of parameters—plain parameters and list parameters.
Plain parameters are represented in XML as a
plain-parameter
element. Plain
parameters dene four attributes:
This material is copyright and is licensed for the sole use by David Martone on 16th September 2009
710 South Avenue West, , Westfield, , 07090Please purchase PDF Split-Merge on www.verypdf.com to remove this watermark.