(Luận văn thạc sĩ) economic growth the role of knowledge economy in the context of selected asian countries
Bạn đang xem bản rút gọn của tài liệu. Xem và tải ngay bản đầy đủ của tài liệu tại đây (1.11 MB, 28 trang )
4
Nguyen Van Dung et al. / Journal of Economic Development 24(1) 04-31
Economic growth:
The role of knowledge economy in the context
of selected Asian countries
NGUYEN VAN DUNG
University of Economics HCMC –
NGUYEN TRONG HOAI
University of Economics HCMC –
NGUYEN SON KIEN
Vietnam–The Netherlands Programme (VNP) – University of Economics HCMC –
ARTICLE INFO
Article history:
Received:
Sep. 16, 2016
Received in revised form:
Dec. 26, 2016
Accepted:
Dec. 31, 2016
Keywords:
Knowledge economy
Economic growth
Education
Information and communication technology
Innovation
Institutions
ABSTRACT
This study examines the role of different knowledge economy components in economic growth as well as the simultaneous effects of information and communication technology (ICT) infrastructure, education, and innovation on economic growth of selected Asian countries over the 1990–2014 period, using Driscoll-Kraay estimation
method and seemingly unrelated regression (SUR) and three stage
least squares (3SLS). The results confirm that there exists a positive
association between economic growth and four components of the
knowledge economy framework. Furthermore, there is also evidence
of the multidimensional effects of ICT infrastructure, education, and
innovation on economic growth. As a result, policy makers should pay
more attention to improving innovation, education, information and
communication infrastructure, and institutional regime systematically
to achieve sustainable economic growth.
Nguyen Van Dung et al. / Journal of Economic Development 24(1) 04-31
1. Introduction
Economic growth is based on capital, labor, technology (Solow, 1956, 1957), natural resources (Sachs & Warner, 1995, 1999,
2001; Labra et al., 2016) and other “new”
factors of growth such as knowledge and innovation (Lucas, 1988; Romer, 1990;
Mankiw et al., 1992; Powell & Snellman,
2004; World Bank, 2007). In the 21th century, the engines of growth, especially in developed countries, tend to shift to
knowledge, innovation factors (WEF,
2015). As a result, knowledge economy
model is regarded as a new growth model to
achieve the quality of growth and sustainable development (Powell & Snellman, 2004;
Suh & Chen, 2007; World Bank, 2007).
Asia consists of more than 40 countries
with GDP (PPP) accounting for approximately 40% of the world (IMF, 2016). Asian
economies are focusing more and more on
new determinants of growth including improving education, information and communication infrastructure, innovation besides
traditional engines of natural resources and
labor intensive production so as to sustain
long-term economic growth (ADB, 2016).
Some questions may arise following this
trend: “Does these factors have an impact on
economic growth?” and “How do they take
effect?” Hence, this study aims to: (i) examine the role of different knowledge economy
components in economic growth of selected
Asian countries; and (ii) investigate the simultaneous effects of ICT infrastructure, education, and innovation on economic growth
of selected Asian countries.
Knowledge economy has received much
5
attention in recent times. Many studies focused on the conceptual framework of
knowledge economy such as OECD (1996),
World Bank (1999), Powell & Snellman
(2004), Suh and Chen (2007), and World
Bank (2007). Several studies, including Karagiannis (2007), Sundać and Fatur Krmpotić (2011), and Labra et al. (2016), investigated the impacts of multiple components
of knowledge economy framework on economic growth. Moreover, a majority of empirical studies focused on the impacts of individual components of knowledge economy framework on economic growth (Education: Barro, 1991; Hanushek & Kimko,
2000; Cohen & Soto, 2007; Suri et al., 2011;
Barro, 2013; Hanushek, 2013; Hassan &
Cooray, 2015; Innovation system: Lederman & Maloney, 2003; Agénor & Neanidis,
2015; Inekwe, 2015; Castellacci & Natera,
2016; Information and communication infrastructure: Jorgenson & Vu, 2005; Inklaar
et al., 2008; Vu, 2011; Erumban & Das,
2015; Jorgenson et al., 2015; Pradhan et al.,
2015; Institution: Barro, 1991; Barro, 1996;
Knack & Keefer, 1995; Mauro, 1995; Kaufmann et al., 1999; Acemoglu et al., 2001).
However, most previous studies have put a
stress on this issue in developed countries.
To the best of our knowledge, there is a lack
of studies on this topic in the context of
Asian countries. Therefore, this study contributes to the literature as a comprehensive
study for the case of Asian economies. In
terms of research methodology, our study
has a significant contribution by employing
Driscoll and Kraay’s (1998) estimation approach, which may capture most of the diag-
6
Nguyen Van Dung et al. / Journal of Economic Development 24(1) 04-31
nostic problems including heteroscedasticity, autocorrelation, and cross-sectional dependence (Hoechle, 2007). Furthermore, we
employ the SUR technique, which accounts
for cross-equation error correlation, estimates the full information estimators of different equations simultaneously, and correct
the problem of endogeneity (Zellner, 1996;
Baltagi, 2008; Greene, 2012).
The rest of the study is structured as follows. Section 2 presents the literature review, which covers the roles of different
components of knowledge economy as well
as natural resources in economic growth. In
section 3, we describe the econometric
method and data used for estimation. Section
4 discusses main estimation results. Finally,
Section 5 concludes and suggests some policy implications.
2. Literature review
2.1.
The concept of knowledge economy
The concept of “knowledge economy” is
widely mentioned in development literature
(OECD, 1996; World Bank, 1999; Powell &
Snellman, 2004; Suh & Chen, 2007; World
Bank, 2007); it can be defined as “production and services based on knowledge-intensive activities that contribute to an accelerated pace of technical and scientific advance, as well as rapid obsolescence. The
key component of a knowledge economy is a
greater reliance on intellectual capabilities
than on physical inputs or natural resources” (Powell & Snellman, 2004).
Knowledge economy can also be defined as
“one that uses knowledge as the key engine
of economic growth. It is an economy in
which knowledge is acquired, created, disseminated, and used effectively to enhance
economic development” (Suh & Chen,
2007). In general, knowledge economy considers knowledge as the main resource and
driver of the economy compared to other
material resources. It is also as important as
land and labor in the agricultural economy,
or natural resources and machinery in the industrial economy, and is even more important due to the continuous innovation and
creativeness to increase labor productivity
and the quality of growth.
2.2.
Structure of knowledge economy
To establish a benchmark for measuring
the progress of a country toward knowledge
economy and increase policy markers’
awareness, the World Bank Institute introduces the project “Knowledge for Development” (K4D) using the “Knowledge Assessment
Methodology
–
KAM”
(www.worldbank.org/kam) to establish the
World Bank’s Knowledge Economy Index
(KEI). According to World Bank (2007), the
knowledge economy consists of four pillars:
(i) Economic and institutional regime; (ii)
Education; (iii) Innovation system; (iv) Information and communication infrastructure. “Economic and institutional regime”
refers to the macroeconomic, legal framework that supports the efficient distribution
of resources and fosters entrepreneurship as
well as the generation, diffusion, and utilization of knowledge. “Education” involves the
process of educating and training an educated and skilled workforce so that they can
use knowledge effectively. “Innovation sys-
Nguyen Van Dung et al. / Journal of Economic Development 24(1) 04-31
tem” includes companies, research institutes, universities, and other organizations
that can access and keep up with technology
to acquire new knowledge and adapt it for
specific demand. Finally, “Information and
communication infrastructure” facilitates
the exchange, process, and dissemination of
information effectively. Information and
communication technologies (ICT), including telephone networks and the Internet, is
the essential infrastructure of the global
economy based on information and
knowledge in the 21st century (World Bank,
2007).
2.3. Roles of components of knowledge
economy and natural resources in economic
growth
Empirical studies on the impacts of the
components of knowledge economy on economic growth are extensive. Regarding the
pillar of “Education,” some distinguishing
studies include Barro (1991), Hanushek and
Kimko (2000), and Cohen and Soto (2007),
which present the positive impacts of education on economic growth. Recent studies
such as Suri et al. (2011), Barro (2013),
Hanushek (2013), and Hassan and Cooray
(2015) mostly find evidence of the crucial
role of education in growth. For example,
Barro (2013), using data of 100 economies
during the period from 1960 to 1995, finds
that economic growth has a positive association with years of attending school for adult
males at secondary and higher levels, but it
is insignificant given the case of females.
Regarding the quality of education, using
comparable test scores among countries, it is
7
found that science tests scores have a positive association with growth. A study by
Hanushek (2013) shows that developing
countries have made significant advancement to catch up with developed ones regarding school enrollment. However, in
terms of educational quality—cognitive
skills, developing countries have not
achieved much compared to developed
economies. Hassan and Cooray (2015) investigated the impacts of school enrolment
on economic growth with different gender
groups in Asian context, and the results reveal that the impacts of education are significantly positive for both males and females
at all educational levels including primary,
secondary, and tertiary ones.
Regarding “Innovation system,” a variety of studies show that innovation has a
considerable positive impact on economic
growth. For instance, Lederman and Maloney (2003), employing the data from 1975 to
2000 of 53 countries, find that when the proportion of R&D expenditure in GDP goes up
by 1 percentage point, GDP growth rate increases by 0.78 percentage point. Similarly,
Agénor and Neanidis (2015), using data
from 38 countries (mostly OECD) from
1981 to 2008, also show that more innovation performance boosts economic growth
directly. Inekwe (2015) examined the role of
R&D spending in economic growth of developing economies during the period 2000
- 2009 with the sample of 66 countries including both upper middle-income and
lower middle-income countries. The findings show that R&D expenditure has a positive impact on growth in upper middle-income countries, but it is insignificant in the
8
Nguyen Van Dung et al. / Journal of Economic Development 24(1) 04-31
case of lower income countries. Moreover,
dealing with simultaneity and endogeneity
by simultaneous equation models reveals
that R&D expenditure is still advantageous
for growth. Castellacci and Natera (2016)
adopted Johansen cointegration method with
data from 1970 to 2010 of 18 Latin American economies, demonstrating that the countries with strong innovation policies
achieved higher growth rates than those only
focusing on imitation policies.
As for the pillar of “Information and
communication infrastructure,” the impacts
of ICT on economic growth were investigated in several studies including Jorgenson
and Vu (2005), Inklaar et al. (2008), Vu
(2011), Erumban and Das (2015), Jorgenson
et al. (2015), and Pradhan et al. (2015), and
there is strong evidence that ICT has a positive impact on economic growth. Jorgenson
and Vu (2005) documented the effect of investment in information technology (IT) on
the economic growth of the global economy.
With the data of 110 countries from 1989 to
2003, they find that the role of IT investment
in growth is significant, especially in industrialized and developing Asian countries.
Inklaar et al. (2008) also reveals that more
investment in ICT raises labor productivity
in service markets (such as wholesale/retail
trade, hotels, and restaurants, etc.) considerably in both Europe and the US. Vu (2011)
examined the impacts of ICT on economic
growth in 102 countries during 1996–2005.
The estimation results confirm that ICT,
namely personal computers, mobiles
phones, and the Internet, has a positive impact on growth. Recent evidence from Pradhan et al. (2015) also shows that there is a
causal relationship between ICT infrastructure and economic growth in Asian countries
during 2001–2012.
A large body of studies investigated the
relationship between institution and economic growth. Some seminal papers include
Barro (1991), Barro (1996), Knack and
Keefer (1995), Mauro (1995), Kaufmann et
al. (1999), and Acemoglu et al. (2001).
Barro (1991) shows that political instability
(represented by a number of coups/years and
the assassination of political figures/one
million people/year) has a negatively effect
on economic growth. Mauro (1995) studied
the impact of corruption on growth, indicating the negative association between these
two factors. Because there is the possibility
of reverse causation from growth to institution, Mauro used ethnolinguistic fractionalization index (the probability of two people
chosen randomly in a country does not belong to the same cultural language group) as
an instrumental variable for institutions to
control endogeneity. Knack and Keefer
(1995) surveyed the impact of property
rights on economic growth. By using the risk
assessment criteria of potential foreign investors (namely contract enforceability and
risk of expropriation) to represent property
ownership, they find that property ownership has a significant impact on growth.
Therefore, protection of property rights
plays an important role in promoting growth.
Barro (1996) examined the factors affecting economic growth in about 100 countries
in the period 1960-1990. The results show
that rule of law has a statistically significant
and positive impact on economic gr owth;
Nguyen Van Dung et al. / Journal of Economic Development 24(1) 04-31
the countries following the rule-of-law principle reflect better economic growth. Moreover, the relationship between democracy
and growth has an inverted U-shape, with
the degree of political freedom maximizing
growth locating between democracy and
dictatorship. Kaufmann et al. (1999) studied
the impact of governance on per capita income, using a dataset covering more than
150 countries with the aggregated data of
more than 300 indicators from various
sources, divided into six major groups of indicators including: (i) voice and accountability; (ii) political instability and violence;
(iii) government effectiveness; (iv) regulatory burden; (v) rule of law; and (vi) graft.
Their results show that governance has a
strong and positive impact on per capita income, implying that better governance leads
to higher per capita income.
Acemoglu et al. (2001) studied the impact of institution on per capita income. To
control for the endogenous problems, the authors used European settler mortality rates,
namely the death rate of soldiers, bishops,
and sailors arrived in the colony from the
17th century to the 19th, as an instrument for
existing institution. Their empirical results
show that institutions have a significant effect on current per capita income. Recent evidence was accumulated by Flachaire et al.
(2014), who re-examined the role of institution in economic growth by applying data
from both developed and developing countries during 1975–2005. The findings show
that political institutions lead to economic
institutions, and economic institutions have
a direct effect on growth, supporting the argument that political institutions are one of
9
the root causes of economic growth.
Existing literature also revealed the impacts of multiple components of knowledge
economy framework on economic growth
(Karagiannis, 2007; Sundać & Fatur Krmpotić, 2011; Labra et al., 2016). Karagiannis
(2007) examined the impacts of knowledgebased economy factors on economic growth.
Employing the data of 15 economies of the
EU from 1990 to 2003, the estimation results
indicate that R&D expenditure from abroad,
public expenditure on education, and ICT
have significantly positive effects on GDP
growth rates. As a result, in the long run, investments in knowledge-related pillars by
both the government and private sectors are
several main engines of economic and
productivity growth in EU countries. Sundać
and Fatur Krmpotić (2011) considered the
impacts of various knowledge economy
components on economic growth in 118
economies (divided into three income
groups based on GDP per capita—PPP in
2006). The knowledge economy indicators
are from World Bank KAM 2007 and 2008.
The study shows that there is a statistically
positive association between Education,
ICT, and GDP per capita in low-income
countries, while Law and Institutions, Education, and ICT affect positively GDP per
capita in middle-income countries. In the
case of high-income economies, labor-force
quality and ICT have beneficial effects on
GDP per capita. Labra et al. (2016), in addition, find a positive nexus between innovation capabilities and GDP growth in natural
resource-driven economies.
Overall, a wide variety of empirical investigations has demonstrated the role of
10
Nguyen Van Dung et al. / Journal of Economic Development 24(1) 04-31
different components of knowledge economy in the growth process: better institutions, education, innovation system, and information and communication infrastructure
altogether lead to higher economic growth.
The evidence, in general, is relatively robust
with different datasets in different countries
and time spans as well as different research
methods.
3. Data and methodology
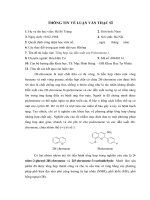
3.1.
knowledge economy. Seemingly, there exist
positive correlations between the natural
logarithm of GDP per capita and innovation,
education, information and communication
infrastructure, and institutional regime in selected Asian countries in the period 19902014, which is a good trend in the path toward knowledge economy. Further investigation by econometric methods to understand the nature of these relationships will be
conducted in later parts of the study.
Data
We construct a panel of 37 countries in
Asia from 1990 to 2014. The data are collected from World Development Indicators
(WDI), Worldwide Governance Indicators
(WGI), International Financial Statistics
(IFS), UN Comtrade. The dependent variable is natural logarithm of per capita GDP,
PPP, at 2011 constant USD. Independent
variables include four pillars of knowledge
economy, namely innovation, education, information and communication infrastructure, and institutional regime. Other control
variables cover conditions for economic
growth such as labor force, capital, FDI, and
so on. Detailed definition, sources of variables, and summary statistics are presented in
Table A.1. in Appendix.
Table A.2. in Appendix describes the
correlation matrix of main variables. It is apparent that there are strong correlations
among six different institutional indicators,
which suggests that they should be estimated
separately in different regressions to avoid
the problem of muticollinearity.
Figure 1 shows the scatter plot of economic growth and each of four pillars of
3.2.
Methodology
3.2.1. The Driscoll-Kraay estimation
It is common to rely on fixed effects
model (FEM) or random effects model
(REM) in panel data regression. Nevertheless, the problems of heteroscedasticity, autocorrelation, and cross-sectional dependence may arise. Concerning this issue, in this
paper, we employ Driscoll and Kraay’s estimation approach. Driscoll and Kraay (1998)
clarified the mechanism of standard error estimation and corrected the problems of heteroscedasticity
and
autocorrelation
(Hoechle, 2007; Baltagi, 2005). The asymptotic characteristic from the diagonal element in the mechanism of covariance matrix
is defined as follows:
V ( ) ( X ' X ) 1 S T ( X ' X ) 1
(1)
where S T is denoted by Newey and West
(1986) as:
S T 0
m (T )
w( j, m)[
j 1
'
j
j]
(2)
In this way of analysis, Driscoll-Kraay
Nguyen Van Dung et al. / Journal of Economic Development 24(1) 04-31
11
12
Nguyen Van Dung et al. / Journal of Economic Development 24(1) 04-31
y1 11 x1 12 x2 1
(3)
y2 21 y1 22 x2 2
(4)
We have a series of equations that present joint determination of causal effect and
recursive models (Wooldridge, 2010;
Greene, 2011; Paxton et al., 2011). It means
that the first estimation of the equation is a
Figure 1. Correlations between economic completely causal effect of a group of exgrowth and all four pillars of knowledge
ogenous variables. Then, in comparison
economy
with the first equation, the second is exmeasurement can capture most of the diag- plained by another group of variables that
nostic problems including heteroscedastic- could include some factors in the previous
ity, autocorrelation, and cross-sectional de- one. As a result, the mechanism of mediation
effect may appear; the following figure illuspendence (Hoechle, 2007).
3.2.2. Simultaneity and econometric esti- trates the causal (direct) effects and mediation (indirect) effects mechanism:
mations
Since Haavelmo’s (1943) initial research
on the issue of simultaneity in economic
equations, the modeling framework of simultaneous equation regression has developed
remarkably as a cornerstone in econometric
literature (Hausman & Taylor, 1983;
Greene, 2011; Paxton, 2011). We consider
the two following structural models:
We use seemingly unrelated regression
(SUR) and three stage least squares (3SLS)
in our analysis of the simultaneous effects of
ICT infrastructure, education, and innovation on economic growth of selected Asian
countries. Zellner and Theil (1962) constructed the mechanism of the structural
Figure 2. Causal and mediation effects
Source: Paxton et al. (2011)
Nguyen Van Dung et al. / Journal of Economic Development 24(1) 04-31
equation that forms the common idiosyncrasy of simultaneity in the seemingly unrelated regression (SUR) and the regression of
three-stage least square (3SLS). A statistical
framework and conditions have been presented for the simultaneous estimation that
satisfied most of the causal and mediation
analysis (Baltagi, 2005; Greene, 2011).
The advantage of SUR technique is that
it will account for cross-equation error correlation and estimate the full information estimators as well as all N equations simultaneously. As a result, it could be more consistent in comparison with the limited information estimation (such as two stage least
squares – 2SLS) which constructs a single
equation in each stage of measurement
(Zellner, 1996; Baltagi, 2008; Greene,
2012). The primary conditions of SUR
model are as follows:
E t | xt 0 &
E t t' | xt
(5)
The idiosyncrasy of the multiplication
between the sum of squares and identity matrix will give the efficient coefficients of the
generalized least square (GLS) estimation as
follows:
GLS X 1 I X X 1 I y
(6)
1
In addition, the regression of 3SLS obtains both the 2SLS and GLS techniques. In
nature, the final coefficient of cross-measurements of this technique is quite similar
with the SUR methods:
3SLS
1
Z 1 I Z Z 1 I y
(7)
13
The main difference here is that the Z-hat
components are derived from the 2SLS estimation, then added in the GLS mechanism.
(Zellner & Theil, 1962; Baltagi, 2005;
Greene, 2011).
3.3.
Model specification
We estimate the growth model that concerns the impact of the four pillars of
knowledge economy including innovation,
education, information and communication
technologies (ICT), and institutional regime.
As shown in Stern et. al. (2000), Bilbao‐
Osorio and Rodríguez‐Pose (2004), Schneider (2005), Gyimah-Brempong (2006),
Schiffbauer (2007), Agénor (2012), Agénor
and Neanidis (2015), and Suri et al. (2011),
it is possible that there are reciprocal relationships and multidimensional effects between innovation, education, infrastructure,
and economic growth. Besides, as shown in
the correlation matrix, it is apparent that
there are strong correlations among six different institutional indicators. Hence, they
should be estimated separately in different
regressions to avoid the problem of muticollinearity. Due to these reasons, we construct
the impacts of four pillars of knowledge
economy on economic growth in separate
equations as follows:
Ln (GDP per capita)it = β0 + β1 (innovation)it + β2 (NR, intensity)it + β3 (labor
force)it + β4 (gross fixed capital formation)it
+ β5 (FDI inflow)it + β5 (trade openness)it +
β6 (Inflation)it +εit.
Ln (GDP per capita)it = β0 + β1 (education)it + β2 (NR, intensity)it + β3 (labor
force)it + β4 (gross fixed capital formation)it
+ β5 (FDI inflow)it + β5 (trade openness)it +
14
Nguyen Van Dung et al. / Journal of Economic Development 24(1) 04-31
β6 (Inflation)it +εit.
Ln (GDP per capita)it = β0 + β1 (ICT)it +
β2 (NR, intensity)it + β3 (labor force)it + β4
(gross fixed capital formation)it + β5 (FDI
inflow)it + β5 (trade openness)it + β6 (Inflation)it +εit.
Ln (GDP per capita)it = β0 + β1 (aspects
of institutional regime)it + β2 (NR, intensity)it
+ β3 (labor force)it + β4 (gross fixed capital
formation)it + β5 (FDI inflow)it + β5 (trade
openness)it + β6 (Inflation)it +εit.
Next, we will investigate the reciprocal
and multidirectional relationships between
innovation, education, ICT infrastructure,
and economic growth. Based on Agénor
(2012) and Agénor and Neanidis (2015), we
compute the following equations:
Ln (GDP per capita)it = β0 + β1 (innovation)it + β2 (education)it + β3 (ICT)it + β4 (labor force)it + β5 (gross fixed capital formation)it + β6 (FDI inflow)it + β7 (trade
openness)it + β8 (Inflation)it +εit.
(Innovation)it = β0 + β1 (ln of GDP
per capita)it + β2 (education)it + β3 (ICT)it +
β4 (government expenditure)it + β5 (education expenditure)it + β6 (non_tax_rev)it + β7
(bud_balance)it + εit.
(Education)it = β0 + β1 (ln of GDP per
capita)it + β2 (ICT)it + β3 (government expenditure)it + β4 (education expenditure)it +
β5 (non-tax revenue)it + β6 (budget balance)it
+ β7 (life expectancy)it+ β8 (ln_population)it
+ β9 (rate of urbanization)it + εit.
(ICT)it = β0 + β1 (government expenditure)it + β3 (education expenditure)it + β4
(non-tax revenue)it + β5 (budget balance)it +
β6 (rate of urbanization)it + β7 (ln of initial
GDP per capita)it + εit.
However, unlike Agénor (2012) and
Agénor and Neanidis (2015), which did not
consider the reverse impacts of the economic growth on innovation and education,
we take into account these relationships. Actually, Bilbao‐Osorio and Rodríguez‐Pose
(2004) and Schneider (2005) explored the
two-way relationship between the economic
growth and innovation. Also, GyimahBrempong et al. (2006) and Suri et al. (2011)
examined the reciprocal relationship between the economic growth and education.
As a result, besides the analysis of direct and
indirect effects mechanism, we take a further
step of analyzing the reverse effects from
economic growth toward two factors—innovation and education.
Compared with the study of Agénor and
Neanidis (2015), this study has a significant
difference by employing SUR technique besides 3SLS. The reason is that Agénor and
Neanidis (2015) employed initial GDP on a
system of equations as a substitute for the
real instrumental variable (which should be
constructed based on literature and be
strictly exogenous variables). In this case,
3SLS model would become SUR model
when the form of the adjusted value—the Z
elements in the initial step of 2SLS—gets
the weak instrumental variable since the instrumental variable in nature is not found.
Therefore, the beta estimation in the step of
GLS in the 3SLS will be biased, as the predicted value in the initial step is inconsistent
(Hausman, 1983; Baltagi, 2008; Greene,
2012). As a result, the mechanism of full information estimation from the SUR model
should be employed, while the 3SLS model
is just considered a reference in this case.
Nguyen Van Dung et al. / Journal of Economic Development 24(1) 04-31
4. Findings and discussion
Table 1 presents nine different models
that capture the impacts of four knowledge
economy pillars on economic growth. The
first three models examine the effects of
three pillars—innovation, education, and
ICT infrastructure. As shown in Table 1, all
these three pillars have positive impacts on
economic growth at 1% level, which is consistent with most of previous literature (Education: Barro, 1991; Hanushek & Kimko,
2000; Cohen & Soto, 2007; Suri et al., 2011;
Barro, 2013; Hanushek, 2013; Hassan &
Cooray, 2015; Innovation system: Lederman & Maloney, 2003; Agénor & Neanidis,
2015; Inekwe, 2015; Castellacci & Natera,
2016; Information and communication infrastructure: Jorgenson & Vu, 2005; Inklaar
et al., 2008; Vu, 2011; Erumban & Das,
2015; Jorgenson et al., 2015; Pradhan et al.,
2015).
The next six models investigate the impacts of various aspects of institutions on
economic growth. These indicators come
from Worldwide Governance Indicators
(WGI) that summarizes different views on
the institution in a country. The estimation
results verify the significant positive effects
of better institutional quality on economic
growth in all six models (at 1% level). In
general, our study confirms the positive influences of all the four pillars of knowledge
economy on economic growth.
In addition, there is evidence of a significant contribution of natural resources intensity toward the growth of a country. This result may be due to the fact that most Asian
countries, especially Middle East ones in the
15
studied period relied on natural resources
export for national development. However,
too much dependence on natural resources
causes unsustainability due to the possible
problems of over-exploration, rent-seeking
behaviors, low competitiveness of manufacturing industries, or a number of issues related to environment (Corden & Neary,
1982; Joya, 2015; Labra et al., 2016).
We also include some macro control variables in the nine presented models. The
negative effect of labor factor is found in
most of these models. There could probably
be a situation of the inefficient employment
of labor force in economic progress. The effects of remaining macro variables are inconsistent across the models, which could lie
in a case of erroneous coefficients due to the
endogenous problem that will be investigated in the next section.
Table 2 presents a system of simultaneous equations including four models: Model
1 presenting the impacts of three pillars of
knowledge economy (i.e. education, innovation, ICT infrastructure) on economic
growth; Models 2 and 3 exhibiting the reverse effects of economic growth on innovation and education; Model 4 concerning the
determinants of ICT infrastructure. At the
same time, the indirect impacts of ICT infrastructure on economic growth are investigated in the education and the ability to innovate (Models 2 and 3); additionally, the
education’s indirect effect on growth is examined via the innovation channel in Model
2.
16
Nguyen Van Dung et al. / Journal of Economic Development 24(1) 04-31
Table 1.
Impacts of four pillars of knowledge economy on economic growth using Driscoll and Kraay’s (1998) estimation approach
Variables
pat_1000
Model 1
Model 2
Model 3
Model 4
Model 5
Model 6
Model 7
Model 8
Model 9
0.618***
(0.000)
gro_tertiary
0.024***
(0.000)
inter_100
0.014***
(0.000)
rul_law
0.869***
(0.000)
re_qual
0.969***
(0.000)
cont_corr
0.855***
(0.000)
gov_effect
0.982***
(0.000)
pol_stab_a~o
0.388***
(0.000)
voi_acc
0.505***
(0.000)
NR_inten100
8.860***
laborpop100
gfcf
fdi_inf
9.559***
6.855***
(0.000)
(0.000)
(0.000)
-0.020***
-0.008***
-0.004
(0.000)
0.013**
(0.002)
0.006
(0.231)
0.005
(0.021)
(0.254)
-0.022**
-0.025
6.802***
7.234***
6.640***
(0.000)
(0.000)
(0.000)
-0.005*
-0.012***
-0.005
(0.090)
-0.009
(0.000)
0.013**
(0.167)
-0.011**
(0.138)
(0.127)
(0.030)
-0.017
0.012*
-0.007
7.703***
7.088***
9.623***
(0.000)
(0.000)
(0.000)
-0.010***
-0.009***
-0.004
(0.000)
-0.009*
(0.003)
-0.009**
(0.133)
0.005
(0.045)
(0.052)
(0.044)
(0.147)
0.012*
0.015**
-0.009
0.003
17
Nguyen Van Dung et al. / Journal of Economic Development 24(1) 04-31
trade
inflation
_cons
N
R-squared
(0.018)
0.003***
(0.000)
-0.008
(0.231)
8.970***
(0.000)
443
0.6803
(0.131)
0
(0.882)
-0.012**
(0.049)
8.481***
(0.000)
416
0.6077
(0.106)
0.003***
(0.007)
-0.011*
(0.072)
8.620***
(0.000)
528
0.5388
(0.098)
-0.001**
(0.022)
-0.003
(0.740)
9.516***
(0.000)
409
0.7596
(0.434)
-0.002***
(0.000)
-0.003
(0.755)
9.377***
(0.000)
409
0.7405
(0.058)
-0.002***
(0.000)
-0.006
(0.430)
9.760***
(0.000)
409
0.7559
(0.049)
-0.003***
(0.000)
0.002
(0.833)
9.738***
(0.000)
409
0.7728
Notes: Standard deviations are in parentheses. ***, ** and * respectively represent significance at 1%, 5% and 10%.
(0.243)
0.001**
(0.042)
-0.027***
(0.001)
9.781***
(0.000)
409
0.5853
(0.775)
0.002***
(0.002)
-0.028***
(0.000)
9.045***
(0.000)
409
0.6046
18
Nguyen Van Dung et al. / Journal of Economic Development 24(1) 04-31
Table 2
Simultaneous impacts of education, innovation, and ICT infrastructure on economic growth
(model 1)
(model 2)
(model 3)
(model 4)
depend=growth
depend=patent
depend = gro_tertiary
depend = inter_100
3SLS
SUR
Ln_gdpperca
Pat_1000
Gro_tertiary
Inter_100
SUR
3SLS
SUR
0.568***
0.470***
2.609
3.170*
(0.000)
(0.000)
(-0.357)
(0.086)
3SLS
SUR
0.634***
0.450***
(0.000)
(0.000)
0.013**
0.015***
0.005
0.019***
(0.003)
(0.000)
(0.991)
(0.000)
0.005
0.008***
0.024***
0.010***
0.291
0.301***
0.476
(0.004)
(0.000)
(0.000)
(0.100)
(0.000)
0.028**
0.024**
0.789
1.016***
-0.656*
-0.872**
(0.027)
(0.039)
(0.023)
(0.000)
(0.091)
(0.022)
-0.219***
-0.274***
1.303
1.495**
3.239***
3.060**
(0.000)
(0.000)
(0.173)
(0.049)
(0.007)
(0.010)
-0.001
0.009
-1.370
-1.354***
-1.276***
-1.024***
(0.964)
(0.476)
(0.000)
(0.000)
(0.001)
(0.007)
-0.012
-0.031**
1.500
1.463***
-0.259
-0.470
(0.600)
(0.027)
(0.000)
(0.000)
(0.561)
(0.282)
Gov_ex
Edu_ex
Non_tax_rev
Bud_balance
Laborpop100
3SLS
-0.012*
-0.013**
(0.060)
(0.023)
19
Nguyen Van Dung et al. / Journal of Economic Development 24(1) 04-31
Gfcf
Fdi_inf
Trade
Inflation
0.025***
0.028***
(0.000)
(0.000)
-0.012
-0.019
(0.436)
(0.221)
0.000
0.002*
(0.764)
(0.070)
0.001
0.000
(0.675)
(0.913)
Life_expect
Ln_pop
Urban
0.357
0.230
(0.575)
(0.423)
-1.670**
-1.705***
(0.015)
(0.022)
0.280
0.272***
0.707***
0.723***
(0.032)
(0.001)
(0.000)
(0.000)
1.344
3.155
(0.664)
(0.309)
Ln_ini_gdp
Cons.
R-squared
Breusch-Pagan test of independence:
chi2(6) =
51.116, Pr=
8.011***
7.927***
-4.843***
-3.786***
-11.806
-40.110**
-29.646
-44.590**
(0.000)
(0.000)
(0.000)
(0.000)
(0.730)
(0.022)
(0.163)
(0.036)
0.5002
0.5732
0.6262
0.6944
0.7367
0.7319
0.4253
0.4195
0.000
0.000
0.000
Notes: Standard deviations are in parentheses. ***, **, and * respectively represent significance at 1%, 5%, and 10%.
0.000
20
Nguyen Van Dung et al. / Journal of Economic Development 24(1) 04-31
As shown in Models 1, 2, and 3, there is
a significant positive two-way nexus between two pillars of knowledge economy
and economic growth. First, the reciprocal
relationship between economic growth and
innovation are positively significant, implying: (i) the economic growth of Asian country will be increased when it obtains more
capacity to innovate; and (ii) the activities of
innovation could be improved when the
economy progresses. A robust confirmation
is that innovation is a key determinant in
stimulating the growing process of a country
(Lederman & Maloney, 2003; Bilbao‐
Osorio & Rodríguez‐Pose, 2004; Agénor &
Neanidis, 2015; Inekwe, 2015; Castellacci
& Natera, 2016). Additionally, the latter relationship has been verified by some papers
such as Stern et al. (2000), Bilbao‐Osorio
and Rodríguez‐Pose (2004), and Schneider
(2005). They regard GDP growth as a representation of national wealth, and a proxy for
the country’s knowledge stock that in turn
can have a positive effect on the capacity to
innovate. Second, there exist reciprocal effects between economic growth and education: (i) the positive contribution of education on economic growth; and (ii) a slightly
reverse effect of economic growth on education. Again, the former result confirms the
results of the above regression (DriscollKraay estimation). This is similar to Barro
(1991), Hanushek and Kimko (2000), Cohen
1
We conduct the full information tests for the SUR model
(the Breusch-Pagan test of independence – the presence of
simultaneous relationships and reverse impacts of economic
growth and the pillars of knowledge economy). The test results show that there exists correlation among the mentioned
variables. This test is constructed based on the mechanism of
full information likelihood which is considered more advan-
and Soto (2007), Suri et al. (2011), Barro
(2013), Hanushek (2013), Hassan and
Cooray (2015), which confirms that education is one of agents fostering the growth of
a country. Nevertheless, the latter outcome
is rather unconvincing since it statistically
insignificant coefficients can be detected in
the 3SLS model. Actually, we employ the
results of SUR model due to the problem of
the above-mentioned unreal instrumental
variables1. Following Suri et. al. (2011) and
Gyimah-Brempong (2006) discussion of the
endogenous problem in educational variables and confirmation of the significant
feedback effects from economic growth on
human development, we also find a positive
reverse effect of the economic growth on education.
Besides the reciprocal relationship, this
section involves addressing the mediation
effects of various pillars of knowledge on
growth. The impacts of ICT infrastructure
on economic growth are illustrated indirectly through the education and the ability
to innovate (Models 2 and 3). The significant
coefficients in Models 2 and 3 confirm the
positive impacts of ICT infrastructure on
economic growth via indirect channels. Additionally, education indirectly affects
growth via the innovation channel with positive effects in Model 2.
In general, the evidence of multidimensional simultaneity in this study show the
tageous in comparison with the limited information likelihood test of the 3SLS models (Hausman, 1983; Baltagi,
2008; Greene, 2012). Furthermore, as mentioned above, there
are not actual real instrumental variables based on the literature review. Hence, 3SLS model is just a reference in our
study and tests for endogeneity in our 3SLS model is not necessary because it is just for the weak instruments only, not for
the real nature of instrumental variables.
Nguyen Van Dung et al. / Journal of Economic Development 24(1) 04-31
mechanism of stimulating economic growth:
(i) public infrastructure (ICT) has positive
effect on education and innovation that in
turn promote economic growth; (ii) improving educational outcome enhances innovation, which indirectly foster economic
growth; and (iii) innovation, education, and
ICT infrastructure altogether directly contribute positively to the growth process.
In addition, as constructed in the papers
of Agénor and Neanidis (2015) and Labra et
al. (2016), a set of control variables are included in the system of equations. First,
Model 1 verifies the significant impact of
some macro control variables on economic
growth including: (i) the negative effect of
the labor force variable which may due to
the inefficient allocation of labor force in the
growth progress; and (ii) the positive effect
of gross fixed capital formation and trade
openness. Second, Models 2, 3, and 4 employ several fiscal indicators, including: (i)
government expenditure and education expenditure; and (ii) non-tax revenue and
budget balance. With respect to the former
group, government expenditure has positive
contribution to innovation and education in
Asian countries in the period of this research. However, government expenditure
exhibits negative impact in the model of infrastructure. The possible explanation is that
the components of government spending on
the ICT infrastructure have been inefficiently used. Regarding education expenditure, it has significant positive impact on education and ICT infrastructure, but not innovation. The reasonable explanation is that
there is still a gap between education expenditure and innovation. The latter group
21
shows the negative impact of non-tax revenue on ICT infrastructure and education, and
the significant positive contribution of
budget balance to education. Third, Models
3 and 4 include some demographic variables
such as life expectancy, population growth,
and rate of urbanization. Regression results
show the negative impact of population
growth on education and the significantly
positive contribution of urbanization to ICT
infrastructure and education.
5. Conclusion and policy implications
The study employs Driscoll-Kraay estimation method and seemingly unrelated regression (SUR) and three stage least squares
(3SLS) to investigate the role of different
knowledge economy components and natural resource factor in economic growth as
well as the simultaneous effects of ICT infrastructure, education, and innovation on
economic growth of selected Asian countries over the 1990–2014 period. The results
show that there is a positive association between economic growth and four components of the knowledge economy framework. Moreover, there is also evidence of
the simultaneous effects of ICT infrastructure, education, and innovation on economic
growth.
Given the empirical results, it is suggested that the development toward a fine
knowledge economy is critical to gaining
higher and sustainable economic growth;
therefore, policy makers should concentrate
on improving all the four pillars of the
knowledge economy. First, improving the
quality of education, especially the quality
of university system is essential for building
22
Nguyen Van Dung et al. / Journal of Economic Development 24(1) 04-31
up well-trained labor force to operate in different sectors of the economy, especially
high-tech ones. There should be more cooperation between university and industry,
which helps update students with state-ofthe-art development in the real world. Second, more resources should also be paid to
innovation, R&D at firms level as well as the
macro perspective of the government to increase global competiveness. It also includes
the improved relationship between university and firms to conduct R&D activities.
Third, investments should also be channeled
more on developing ICT infrastructure, especially Internet coverage, which boosts existing industries as well as new industries
such as e-commerce, and application in all
fields of society, especially e-government.
Finally, a simultaneous strategy to foster
economic growth toward knowledge economy is to: (i) enhance ICT infrastructure to
support innovation which may result in
higher economic growth; and (ii) improve
education quality to foster innovation which
may also contribute positively to economic
growth
References
Acemoglu, D., Johnson, S., & Robinson, J. A.
(2001). The colonial origins of comparative
development: An empirical investigation.
American Economic Review, 91(5), 1369–
1401.
Agénor, P. R. (2012). Public capital, growth and
welfare: Analytical foundations for public
policy. Princeton University Press.
panel data (3rd Edition). John Wiley & Sons.
Barro, R. J. (1991). Economic growth in a cross
section of countries. The Quarterly Journal
of Economics, 106(2), 407–443.
Barro, R. J. (1996). Determinants of economic
growth: A cross–country empirical study.
NBER Working Paper 5698.
Barro, R. J. (2013). Education and economic
growth. Annals of Economics and Finance,
14(2), 301–328.
Bilbao‐Osorio, B., & Rodríguez‐Pose, A. (2004).
From R&D to innovation and economic
growth in the EU. Growth and Change,
35(4), 434–455.
Castellacci, F., & Natera, J. (2016). Innovation,
absorptive capacity and growth heterogeneity: Development paths in Latin America
1970–2010. Structural Change And Economic Dynamics, 37, 27–42.
Cohen, D., & Soto, M. (2007). Growth and human capital: Good data, good results. Journal
of Economic Growth, 12(1), 51–76.
Corden, W. M., & Neary, J. P. (1982). Booming
sector and de-industrialization in a small
open economy. Economic Journal, 825–848.
Driscoll, J. C., & Kraay, A. C. (1998). Consistent
covariance matrix estimation with spatially
dependent panel data. Review of Economics
and Statistics, 80(4), 549–560.
Erumban, A. A., & Das, D. K. (2015). Information and communication technology and
economic growth in India. Telecommunications Policy.
Flachaire, E., García–Palosa, C., & Konte, M.
(2014). Political versus economic institutions
in the growth process. Journal of Comparative Economics, 42(1), 212–229.
Greene, W. H. (2011). Econometric analysis (7th
Edition). Pearson.
Agénor, P. R., & Neanidis, K. C. (2015). Innovation, public capital, and growth. Journal of
Macroeconomics, 44, 252–275.
Gyimah–Brempong, K., Paddison, O., & Mitiku,
W. (2006). Higher education and economic
growth in Africa. The Journal of Development Studies, 42(3), 509–529.
Baltagi, B. (2005). Econometric analysis of
Haavelmo, T. (1943). The statistical implications
Nguyen Van Dung et al. / Journal of Economic Development 24(1) 04-31
of a system of simultaneous equations. Econometrica, 11(1), 1–12.
Hanushek, E. A. (2013). Economic growth in developing countries: The role of human capital. Economics of Education Review, 37,
204–212.
Hanushek, E. A., & Kimko, D. D. (2000).
Schooling, labor–force quality, and the
growth of nations. American Economic Review, 1184–1208.
Hassan, G., & Cooray, A. (2015). Effects of male
and female education on economic growth:
Some evidence from Asia. Journal of Asian
Economics, 36, 97–109.
Hausman, J. A. (1983). Specification and estimation of simultaneous equation models. Handbook of Econometrics, 1, 391–448.
Hoechle, D. (2007). Robust standard errors for
panel regressions with cross-sectional dependence. Stata Journal, 7(3), 281.
IMF. (2016). IMF data mapper. International
Monetary Fund.
Inekwe, J. N. (2015). The contribution of R&D
expenditure to economic growth in developing economies. Social Indicators Research,
124(3), 727–745.
Inklaar, R., Timmer, M. P., & Van Ark, B.
(2008). Market services productivity across
Europe and the US. Economic Policy, 23(53),
140–194.
Jorgenson, D. W., & Vu, K. (2005). Information
technology and the world economy. The
Scandinavian Journal of Economics, 107(4),
631–650.
Jorgenson, D. W., Ho, M. S., & Samuels, J. D.
(2015). The impact of information technology on postwar US economic growth. Telecommunications Policy.
Joya, O. (2015). Growth and volatility in resource-rich countries: Does diversification
help? Structural Change and Economic Dynamics, 35, 38–55.
Karagiannis, S. (2007). The knowledge-based
economy, convergence and economic
23
growth: Evidence from the European Union.
The Journal of Economic Asymmetries, 4(2),
65–85.
Kaufmann, D., Kraay, A., & Mastruzzi, M.
(2010). The worldwide governance indicators methodology and analytical issues. Policy Research Working Paper 5430. World
Bank.
Kaufman, D., Kraay, A., & Zaido–Lobaton, P.
(1999). Governance matters. World Bank
Working Paper No. 2196. Washington, DC.
Knack, S., & Keefer, P. (1995). Institutions and
economic performance: Cross-country tests
using alternative measures. Economics and
Politics, 7, 207–227.
Labra, R., Rock, J. A., & Álvarez, I. (2016).
Identifying the key factors of growth in natural resource-driven countries: A look from
the knowledge-based economy. Ensayos sobre Política Económica.
Lucas, R. E. (1988). On the mechanics of economic development. Journal of Monetary
Economics, 22, 3–42.
Mankiw, N. G., Romer, D., & Weil, D. (1992).
A contribution to the empirics of economic
growth. Quarterly Journal of Economics,
107(2), 407–437.
Mauro, P. (1995). Corruption and growth. Quarterly Journal of Economics, 110, 681–712.
Newey, W. K., & West, K. D. (1986). A simple,
positive semi–definite, heteroskedasticity and
autocorrelation consistent covariance matrix. NBER Technical Working Papers
No.55.
OECD. (1996). The knowledge economy. Paris:
OECD.
Paxton, P., Hipp, J. R., Marquart–Pyatt, S., &
Marquart–Pyatt, S. T. (2011). Nonrecursive
models: Endogeneity, reciprocal relationships, and feedback loops (Vol. 168). Sage
Publications.
Powell, W. W., & Snellman, K. (2004). The
knowledge economy. Annual Review of Soci-
24
Nguyen Van Dung et al. / Journal of Economic Development 24(1) 04-31
ology, 30(1), 199–220. doi: 10.1146/annurev.soc.29.010202.100037
Pradhan, R. P., Arvin, M. B., & Norman, N. R.
(2015). The dynamics of information and
communications technologies infrastructure,
economic growth, and financial development: Evidence from Asian countries. Technology in Society, 42, 135–149.
Romer, P. M. (1990). Endogenous technological
change. Journal of Political Economy, 98(5),
S71–S10.
Sachs, J. D., & Warner, A. M. (1995). Natural
resource abundance and economic growth.
NBER Working Paper No.5398.
Sachs, J. D., & Warner, A. M. (1999). The big
push, natural resource booms and growth.
Journal of Development Economics, 59, 43–
76.
Sachs, J. D., & Warner, A. M. (2001). Natural
resources and economic development: The
curse of natural resources. European Economic Review, 45, 827–838.
Schiffbauer, M. (2007). Calling for innovations:
Infrastructure and sources of growth. Working Paper No. 18. Economic and Social Research Institute.
Schneider, P. H. (2005). International trade, economic growth and intellectual property
rights: A panel data study of developed and
developing countries. Journal of Development Economics, 78(2), 529–547.
Solow, R. M. (1956). A contribution to the theory of economic growth. The Quarterly Journal of Economics, 65–94.
Solow, R. M. (1957). Technical change and the
aggregate production function. The Review of
Economics and Statistics, 312–320.
Stern, S., Porter, M. E., & Furman, J. L. (2000).
The determinants of national innovative capacity. NBER Working Paper No. 7876.
Suh, J., & Chen, D. H. C. (2007). Korea as a
knowledge economy: Evolutionary process
and lessons learned. World Bank Institute
Development Studies. World Bank.
Sundać, D., & Fatur Krmpotić, I. (2011).
Knowledge economy factors and the development of knowledge-based economy. Croatian Economic Survey, (13), 105–141.
Suri, T., Boozer, M. A., Ranis, G., & Stewart, F.
(2011). Paths to success: The relationship between human development and economic
growth. World Development, 39(4), 506–
522.
Vu, K. M. (2011). ICT as a source of economic
growth in the information age: Empirical evidence from the 1996–2005 period. Telecommunications Policy, 35(4), 357–372.
WEF. (2015). World Economic Forum’s global
competitiveness report, 2014–2015. World
Economic Forum.
Wooldridge, J. M. (2010). Econometric analysis
of cross section and panel data. MIT University Press.
World Bank. (1999). World development report
1998/99: Knowledge for development. Oxford.
World Bank. (2007). Building knowledge economies: Advanced strategies for development.
World Bank Institute Development Studies,
World Bank.
Zellner, A., & Theil, H. (1962). Three–stage
least squares: Simultaneous estimation of
simultaneous equations. Econometrica, 54–
78.
25
Nguyen Van Dung et al. / Journal of Economic Development 24(1) 04-31
Appendix
Table A.1.
Variable definitions and summary statistics
Variables
Signs
Definitions
Sources
Observations
Mean
Std.
Dev.
WDI
860
9.162
1.282
Dependent variable
Economic
Growth
ln_gdpperca
Natural logarithm of per
capita GDP, PPP, at 2011
constant USD.
Independent variables
Four pillars of Knowledge Economy
Innovation
patent_1000
Patent application (nonresident + resident) per 1000
people.
WDI
567
0.393
0.865
Education
gro_tertiary
Gross enrolment tertiary,
both sexes (%): “Gross enrollment ratio is the ratio of
total enrollment, regardless
of age, to the population of
the age group that officially
corresponds to the level of
education shown. Tertiary
education, whether or not
to an advanced research
qualification, normally requires, as a minimum condition of admission, the
successful completion of
education at the secondary
level.”
WDI
614
24.993
18.798
Information
and communication infrastructure
inter_100
“Internet users (per 100
people)”
WDI
770
16.740
23.437
Institu-
26
Nguyen Van Dung et al. / Journal of Economic Development 24(1) 04-31
Variables
Signs
Definitions
Sources
Observations
Mean
Std.
Dev.
Worldwide
Governance
Indicators
(WGI)
590
-0.218
0.853
tional regime
of
rul_law
“Perceptions of the extent
to which agents have confidence in and abide by the
rules of society, and in particular the quality of contract enforcement, property
rights, the police, and the
courts, as well as the likelihood of crime and violence. Estimate gives the
country’s score on the aggregate indicator, in units
of a standard normal distribution, i.e. ranging from
approximately -2.5 to 2.5.”
Regulatory quality
re_qual
“Perceptions of the ability
of the government to formulate and implement
sound policies and regulations that permit and promote private sector development. Estimate gives the
country’s score on the aggregate indicator, in units
of a standard normal distribution, i.e. ranging from
approximately -2.5 to 2.5.”
589
-0.204
0.876
Control of
corruption
cont_corr
“Perceptions of the extent
to which public power is
exercised for private gain,
including both petty and
grand forms of corruption,
as well as "capture" of the
state by elites and private
interests. Estimate gives
the country’s score on the
aggregate indicator, in
589
-0.250
0.875
Rule
law
27
Nguyen Van Dung et al. / Journal of Economic Development 24(1) 04-31
Variables
Signs
Definitions
Sources
Observations
Mean
Std.
Dev.
units of a standard normal
distribution, i.e. ranging
from approximately -2.5 to
2.5.”
Government effectiveness
gov_effect
“Government Effectiveness captures perceptions
of the quality of public services, the quality of the
civil service and the degree
of its independence from
political pressures, the
quality of policy formulation and implementation,
and the credibility of the
government’s commitment
to such policies. Estimate
gives the country’s score
on the aggregate indicator,
in units of a standard normal distribution, i.e. ranging from approximately 2.5 to 2.5.”
589
-0.105
0.870
Voice &
accountability
voi_acc
“Perceptions of the extent
to which a country’s citizens are able to participate
in selecting their government, as well as freedom of
expression, freedom of association, and a free media.
Estimate gives the country’s score on the aggregate
indicator, in units of a
standard normal distribution, i.e. ranging from approximately -2.5 to 2.5.”
590
-0.661
0.727
Political
stability
pol_stab_ab
_vio
“Political Stability and Absence of Violence/Terrorism measures perceptions
590
-0.460
1.069
28
Variables
Nguyen Van Dung et al. / Journal of Economic Development 24(1) 04-31
Signs
Definitions
Sources
Observations
Mean
Std.
Dev.
of the likelihood of political instability and/or politically-motivated violence,
including terrorism. Estimate gives the country’s
score on the aggregate indicator, in units of a standard
normal distribution, i.e.
ranging from approximately -2.5 to 2.5.”
Control variables
Natural
resources
intensity
NR_inten100
“Natural resources exports
as share of GDP (% of
GDP)”. Natural resources
data are collected with the
following classified codes
in the SITC list: 2(27-28),
3, and 6(68).
UN
Comtra
de
643
5.208
8.048
Labor
force
laborpop100
“Labor force (total) as
share of total population
(% of population)”
WDI
922
42.244
10.971
Capital
gfcf
“Gross fixed capital formation (% of GDP): including land improvements
(fences, ditches, drains,
and so on); plant, machinery, and equipment purchases; and the construction of roads, railways, and
the like, including schools,
offices, hospitals, private
residential dwellings, and
commercial and industrial
buildings.”
WDI
836
25.003
8.898
Foreign
direction
investment
fdi_flow
“Foreign direct investment,
net inflows (% of GDP)”
WDI
833
3.268
4.673