IP Behavior - Part 1
Bạn đang xem bản rút gọn của tài liệu. Xem và tải ngay bản đầy đủ của tài liệu tại đây (542.84 KB, 32 trang )
3 - 1
IP Behavior I – SANS GIAC LevelTwo
- ©2000, 2001
1
IP Behavior - Part 1
Welcome back to the SANS GIAC LevelTwo TCP/IP course. In this section, we introduce some
more detail to topics discussed in the previous section, as well as introduce some new concepts all
together.
Technical editors:
William Ralph
Stephen Northcutt
Alan Paller
Judy Novak
3 - 2
IP Behavior I – SANS GIAC LevelTwo
- ©2000, 2001
2
Objectives
• Introduction to tcpdump and tcpdump output
• TCP concepts
Specifically, we will present an introduction to tcpdump and tcpdump output. We will cover TCP
concepts that are the foundations of how TCP communicates.
3 - 3
IP Behavior I – SANS GIAC LevelTwo
- ©2000, 2001
3
tcpdump
Section 1
tcpdump is a program that will dump traffic on a network for Unix
hosts.
• Available at
• You will also need to download libpcap.tar.Z
windump
is the Windows counterpart:
• Available at />• libpcap available at />In section 1, we will explore tcpdump.
3 - 4
IP Behavior I – SANS GIAC LevelTwo
- ©2000, 2001
4
tcpdump
0101001110 111010010011000 00100011011
Network
packets
tcpdump running on a host “sniffing”
network packets
tcpdump output
07:00:48.036746 ping.net > myhost.com: icmp: echo request (DF)
07:00:48.036776 myhost.com > ping.net: icmp: echo reply (DF)
07:02:12.622460 log.net.3155 > syslog.com.514: udp 101
07:03:01.132414 send.net.32938 > mail.com.25: S 248631:248631(0) win 8760
On slide “tcpdump”, we see that tcpdump is a program that will read traffic on the network. By
default, it will collect and print, in a standard format, all the traffic passing on the network. There
are command line options for tcpdump that will alter the default behavior, either by collecting
specified records, printing in a more verbose mode (-v), printing in hexadecimal (-x) or writing
records as “raw packets” to a file (-w) instead of printing as standard output.
tcpdump filters can be used to specify records to be collected. Rather than gather all traffic passing
on the network on which the host resides, tcpdump can be instructed to collect records with a
specific trait. Examples of filters would be to collect only TCP records, or collect records to a given
port, say telnet, port 23, for instance. You can limit the purview of what is collected to a specific IP
or host. Combinations of traits can be used to get more restrictive in what is collected. Just about
any field in an IP datagram, including the actual data payload, can be used to select the records that
are collected.
We see on this slide, a host running tcpdump and gathering records from the network interface. We
see the records that tcpdump has collected below. tcpdump has a default standard output based on
the protocol (TCP, UDP, ICMP) of the record that is displayed. While each of the various protocols
has a similar format to the other, they are also distinct in what is displayed.
3 - 5
IP Behavior I – SANS GIAC LevelTwo
- ©2000, 2001
5
Sample tcpdump UDP output
timestamp source.port dest.port : udp bytes
timestamp: hour:minutes:seconds.fractions of seconds
source.port: source IP/hostname.source port
dest.port: destination IP/host.destination port
udp: may or may not expressly label the UDP protocol
bytes: number of bytes of UDP data (payload)
09:39:19.470000 nmap.edu.728 > dns.net.111: udp 56
If we examine a line of tcpdump UDP output on slide “Sample tcpdump UDP output”, we first see
a timestamp. This is when the tcpdump host read the record. The timestamp is in the format of hour,
colon, minutes, colon, seconds, period, followed by fractions of a second. As you can see, tcpdump
allows for 6 fractional digits or millionths of a second. The record we see with the value 470000 has
a precision of hundredths of a second. This is a limitation of the Linux Redhat 5.2 operating system
on which this tcpdump record was collected, but this is corrected in more current Redhat releases.
Next, we see before the greater than sign, the source information for the tcpdump record. This
includes the source host name, nmap.edu, or IP number depending upon whether the IP can be
resolved. If you do not want names resolved, tcpdump can be run with the -n parameter. Next, the
trace is followed by a period and the source port, in this case 728. Immediately following the greater
than sign, you see the destination host or IP, dns.net followed by a period, followed by the destination
port, in this case port 111 or what is more commonly known as the portmapper or sunrpc port. In this
record, you see the word “UDP” to help identify this protocol. Not all UDP records will be labeled
expressly “UDP”. DNS, or port 53, is a notable exception. It is analyzed at the application layer so
that is why you don’t see the word “UDP”. Other protocols such as Simple Network Management
Protocol (SNMP) and Network Time Protocol (ntp) are also analyzed at the application level.
tcpdump will analyze or decode traffic at the highest layer that it is familiar with.
The final field is the number of bytes found of the UDP data. Recall that UDP data is wrapped in a
UDP header first and encapsulated in an IP header before it is sent out on the network.
3 - 6
IP Behavior I – SANS GIAC LevelTwo
- ©2000, 2001
6
Sample tcpdump TCP output
timestamp source.port dest.port flags beginning: ending bytes window
seq # seq #
09:32:43.910000 nmap.edu.1173 > dns.net.21: S 62697789:62697789(0) win 512
flags: TCP flags ( P
SH, RST, SYN, FIN)
beginning seq #: for the initial connection, this is the initial sequence number (ISN)
from the source IP
ending seq #: this is the beginning sequence number + data bytes
bytes: data bytes (payload) in the TCP packet
window size: nmap.edu receive window (TCP buffer)
Our next slide is titled “Sample tcpdump TCP output”, the tcpdump TCP record is identical to the
UDP record as far as timestamp, source and destination host and port. What distinguishes the TCP
format from the others are the TCP flags, sequence numbers, acknowledgements, acknowledgement
numbers, and TCP options.
In this record, we see the flag of SYN or S set following the destination port of 21 which, by the way, is
the port for ftp. The SYN flag indicates a request to begin a TCP session. Other possible flag values
are P for PUSH that sends data, R for RESET that aborts a connection and F for FIN, which terminates
a connection more gracefully. While not an actual flag bit like the others, if you see a period in the flag
field, it simply means that none of the PUSH, RESET, SYN or FIN flags is set. In a way, this is an
informative placeholder.
Next is the beginning sequence number. One of the mechanisms that TCP uses to guarantee reliable
packet delivery is keeping track of the data it has received; this is partially done by using sequence
numbers. In this case, since this is an initial connection, it is known as the Initial Sequence Number or
ISN. The ending sequence number is the sum of the initial sequence number plus the number of TCP
data bytes sent in this TCP segment. A SYN connection sends no data bytes, as represented by the zero
in parentheses. Data should not be sent until the client and server actually establish the connection.
Finally, there is the window size. In this record, we see nmap.edu advertising a window size of 512
bytes. It is informing dns.net that it has an incoming TCP buffer size of 512 bytes. If dns.net is a larger
faster host, it will have to slow itself and pace the data sent so it doesn’t overwhelm the buffer size of
nmap.edu. You might also see TCP options as well on the output.
3 - 7
IP Behavior I – SANS GIAC LevelTwo
- ©2000, 2001
7
Absolute and Relative Sequence
client.com.38060 > telnet.com.telnet: S 3774957990:3774957990(0) win
8760 <mss 1460> (DF)
telnet.com.telnet > client.com.38060: S 2009600000
:2009600000(0) ack
3774957991 win 1024 <mss 1460>
client.com.38060 > telnet.com.telnet: .ack 1
win 8760 (DF)
client.com.38060 > telnet.com.telnet: P 1
:28(27) ack 1 win 8760 (DF)
On the next slide titled “Absolute and relative sequence”, we show a handy feature of tcpdump.
Notice the top line, we have the number 3774957990 in bold. That is an absolute sequence number.
If we were to convert the field from hex stored in the actual record to decimal this is what we would
come up with.
Sequence numbers help us track how much data has been sent by a connection. However, these
numbers get pretty ugly. So tcpdump can provide the information as relative sequence numbers as
well. On the third line of your slide, after the ack you see a 1 in bold. That means one sequence
number has been consumed in the the TCP process for this connection. When we look more closely
at TCP, we will see our friends absolute and relative sequence again.
3 - 8
IP Behavior I – SANS GIAC LevelTwo
- ©2000, 2001
8
Sample tcpdump ICMP output
ICMP format 1
timestamp source dest icmp: icmp message
14:59:30.220000 ping.net > hosta.mysite.com: icmp: echo request
14:59:38.140000 hosta.mysite.com > ping.net: icmp: echo reply
ICMP format 2
timestamp router source icmp: dest icmp message
02:09:47.600000 foreign.router > tryinghost.com: icmp: host desired.com unreachable
In slide “Sample tcpdump ICMP output”, we see ICMP output generated by tcpdump. ICMP is
the protocol used for error control and message handling. There are many different types of ICMP
records that have different messages. We display two of the basic formats on this slide.
The first two ICMP records have a similar format. In the first ICMP record, we have a timestamp
followed by a source host – ping.net in the first record. Following the greater than sign, we see the
destination host – in this record hosta.mysite.com. Remember, ICMP doesn’t use ports to
communicate like TCP and UDP do. The ICMP message type follows the destination host; in the
first record we see an ICMP echo request which is generated by a commonly used program known as
ping.
The second record is a response from the ping from hosta.mysite.com to ping.net – this is known as
an ICMP echo reply.
The third record shows a slightly different format. Often times a router will be involved when some
kind of error is detected. In this record, foreign.router delivers a message to tryinghost.com that host
desired.com is not reachable. This implies that tryinghost.com first attempted to send some kind of
traffic to desired.com and foreign.router intervened to inform tryinghost.com when it discovered a
problem.
3 - 9
IP Behavior I – SANS GIAC LevelTwo
- ©2000, 2001
9
tcpdump output in hex
• Command line option -x displays records in
hexadecimal
• Hex more difficult to read and decrypt
• Shows entire IP datagram, even fields that tcpdump
doesn’t display in standard output
• “Entire” packet is shown using -s (snaplen)
parameter
Slide “tcpdump output in hex” reiterates what we discussed earlier. tcpdump output can be
displayed in hexadecimal.
As you become more advanced in analyzing records, you'll want to be able to look for the protocol
and the only sure way to do that is in the hexadecimal information. We'll go over that, but don't worry
if you don't understand it all. Over time, the cumulative discussions of binary and hexadecimal
arithmetic will begin to look familiar and almost friendly.
Displaying output in hexadecimal is done using the –x command line option of tcpdump.
Hexadecimal output is indeed more difficult to read or decipher. But, if the snaplen, the -s parameter is
as large or larger than the datagram, the -x parameter will show the entire datagram, something that
the standard tcpdump output doesn’t do.
This can be used as a tool to investigate a particular field or value. Additionally, it can be used to
uncover any kind of anomalies in the datagram such as length values that may not be accurate. Fields
in a datagram can be “crafted” by a program instead of using normal system calls to create a number
of very interesting, illegal datagrams. tcpdump hexadecimal output gives us all the data to look for
signs of this kind of tampering.
3 - 10
IP Behavior I – SANS GIAC LevelTwo
- ©2000, 2001
10
Sample hexadecimal output
04:19:31.800000 1.2.3.4 > 192.168.5.5: icmp: echo
reply (DF)
4500 0028 b5cb 4000 fe01 b229 0102 0304
IP Header
c0a8 0505 0000 bc9c bf3c 51ff 0018 f81b
000d d5f0 000d 63e8 0000 0000 0000
ICMP message
Turning to slide “Sample hexadecimal output”, we see the output of a datagram displayed in
hexadecimal. The record is first displayed as you would see it in normal tcpdump output.
In this slide, we are looking at the bowels of an ICMP echo reply packet. Each character in the hex
output represents 4 bits, two consecutive 4 bit values with no intervening spaces represent a byte.
The IP header in this datagram has 20 bytes. The IP header is displayed between the first and second
arrows.
This is followed by an ICMP message that is found between the second and third arrows.
What do these hex value represent? Well, you’ll have to get a standard layout of what an IP header
looks like and similarly, you’ll need to acquire a layout of an ICMP message format. One of the best
sources for this and understanding TCP/IP, in general, is TCP/IP Illustrated, Volume 1
by Richard
Stevens.
3 - 11
IP Behavior I – SANS GIAC LevelTwo
- ©2000, 2001
11
Finding the protocol in the IP header
BYTE 0 1 2 3 4 5 6 7 8 9 10 11 12 13 14 15
4500 0028 b5cb 4000 fe b229 0102 0304
16 17 18 19
c0a8 0505
01
IP protocol field
ICMP = 01
TCP = 06
UDP = 17 = 11 hexadecimal
16
1
x 1 + 16
0
x 1 = 17
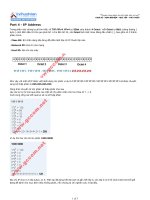
We get a feel for how this works by turning to slide “Finding the protocol in the IP header”. Here
we have displayed the IP header. One of the hardest things to master when you first begin to look at
tcpdump output is exactly what protocol is being displayed. We saw where ICMP is pretty obvious
about announcing itself in the output somewhere. We saw where TCP is a little bit more subtle with
flags and sequence numbers and acknowledgement numbers. Finally, UDP may or may not announce
its presence.
How can you determine the protocol of a record when it is not obvious to you looking at the standard
tcpdump output? First, you have to have that record stored in a tcpdump raw packet file. This means
that you have gathered tcpdump output and written it to a file using the tcpdump –w option rather than
display it. If you read the file in which the record is stored and display it in hexadecimal, you should be
able to determine the protocol.
To do this we need to know a couple of pieces of information. First, the IP protocol field is 9 bytes into
the IP header. Counting begins with 0 so if we look at the slide, the byte that has the gray background
represents the IP protocol. The current value that we see is 01 or the value for ICMP. Other values
that you may see are 06, which is TCP, and 17, which is UDP. Seventeen is the decimal value of the
number, but the IP header is in hexadecimal. Seventeen in decimal is 11 in hexadecimal. If you
remember the hexadecimal numbering system the least significant 1 (the rightmost character) is equal
to base 16 to the zero power. Anything to the 0 power is 1 so the rightmost character is 1 times 1. The
most significant character or leftmost character is also 1, which represents base 16 to the first power, or
16. 16 times 1 is 16. So, 16 + 1 is seventeen decimal.
3 - 12
IP Behavior I – SANS GIAC LevelTwo
- ©2000, 2001
12
tcpdump review
• “Sniffs” packets off network
• Dumps packets in standard output format depending
on protocol
• UDP packets may or may not have “udp” in output
• TCP packets are distinguishable because of flags
• ICMP packets will have ICMP message description
• Can display records in hexadecimal format
Slide “tcpdump review” wraps up what we have learned in section 1 about tcpdump. tcpdump can
sniff packets off of the network. It dumps the packets in a standard output format depending on the
protocol – TCP, UDP or ICMP.
As you saw UDP datagrams may be labeled as UDP – although this is not always guaranteed. TCP
segments are distinguishable because of flags, and other fields as the sequence and acknowledgement
numbers, to name a few. ICMP messages will have the ICMP message description contained in them.