nghiên cứu biến tính vật liệu sba15 làm chất hấp phụ và xúc tác quang phân hủy một số hợp chất hữu cơ ô nhiễm trong môi trường nước
Bạn đang xem bản rút gọn của tài liệu. Xem và tải ngay bản đầy đủ của tài liệu tại đây (1.92 MB, 53 trang )
<span class='text_page_counter'>(1)</span><div class='page_container' data-page=1>
<b>MỞ ĐẦU </b>
Ơ nhiễm mơi trường đang ảnh hưởng xấu và ngày càng nghiêm
trọng đến đời sống của con người ở mức độ tồn cầu. Vì thế, nghiên
cứu xử lý, tách loại các hợp chất ô nhiễm, trong đó có các hợp chất
hữu cơ độc hại trong môi trường nước là việc làm quan trọng và cấp
thiết. Để giải quyết vấn đề này, trên thế giới đã có nhiều kỹ thuật
được áp dụng như: bay hơi, điện động học, giải hấp phụ nhiệt, loại
bằng sinh học, xúc tác quang hóa, hấp phụ và chiết pha lỏng. Tuy
nhiên, trong số đó, phương pháp hấp phụ và xúc tác quang được
nghiên cứu rộng rãi do giá thành thấp, dễ vận hành và có tính khả thi.
Vật liệu mao quản trung bình trật tự (MQTBTT) có diện tích bề
mặt lớn và kích thước mao quản rộng, đồng nhất cho phép những
phân tử cồng kềnh dễ dàng khuyếch tán vào bên trong và tiếp xúc với
các tâm hoạt động, hứa hẹn nhiều tiềm năng ứng dụng trong lĩnh vực
hấp phụ và xúc tác. Một đại diện trong số đó, vật liệu SBA-15 có cấu
trúc lục lăng với độ trật tự cao, dễ tổng hợp, kích thước lỗ có thể thay
đổi được, tường mao quản dày đang thu hút sự quan tâm nghiên cứu
của nhiều nhà khoa học. Việc nghiên cứu biến tính vật liệu MQTBTT
nói chung và SBA-15 nói riêng là một hướng nghiên cứu mạnh mẽ
trên thế giới. Tuy nhiên, ở Việt Nam, hướng nghiên cứu này vẫn còn
rất hạn chế. Đa số các cơng trình nghiên cứu tập trung vào việc tạo ra
vật liệu oxit silic MQTBTT chứa các kim loại, oxit kim loại chuyển
tiếp dùng trong xúc tác và hấp phụ. Trong khi đó, chỉ có một số ít
cơng trình nghiên cứu chức năng hóa (functionalized) các vật liệu
này bằng nhóm chức hữu cơ.
</div>
<span class='text_page_counter'>(2)</span><div class='page_container' data-page=2>
quang ở trên được thiết kế dựa trên nguyên lý của hai phương pháp
biến tính đưa các vật liệu bán dẫn chỉ hoạt động trong vùng tử ngoại
<i>trở nên hoạt động trong vùng khả kiến: (i) giảm năng lượng vùng </i>
<i>cấm (đối với ZnO là pha tạp N) và (ii) ghép với một chất bán dẫn </i>
<i>khác có thể hoạt động trong vùng khả kiến, ở đó nó đóng vai trị như </i>
chất cảm quang. Đối với TiO2, chất bán dẫn ghép là CdS. Riêng đối
với các chất hữu cơ độc hại được chọn để nghiên cứu trong luận án
này là phenol và các phẩm nhuộm.
<i><b>Những điểm mới của luận án: </b></i>
Đây là cơng trình đầu tiên nghiên cứu tổng hợp vật liệu SBA-15
biến tính bởi nhóm cacbonyl và khảo sát có hệ thống mối liên quan
giữa tính chất bề mặt của vật liệu hấp phụ với tính chất của chất bị
hấp phụ đến khả năng hấp phụ của vật liệu. Lần đầu tiên sử dụng
SBA-15 làm chất nền tổng hợp vật liệu xúc tác quang ZnO pha tạp N
và vật liệu kết hợp đồng thời 2 chất bán dẫn là TiO2 và CdS để tạo ra
vật liệu có khả năng xúc tác trong vùng ánh sáng khả kiến.
<b>Chương 1 </b>
<b>TỔNG QUAN TÀI LIỆU </b>
Phần tổng quan giới thiệu chung về vật liệu MQTB, SBA-15, ứng
dụng của vật liệu SBA-15, các phương pháp biến tính vật liệu
MQTB, vật liệu xúc tác quang và một số phương pháp sử lí chất hữu
cơ độc hại trong môi trường nước.
<b>Chương 2 </b>
<b> NỘI DUNG, PHƯƠNG PHÁP NGHIÊN CỨU VÀ THỰC NGHIỆM </b>
<b>2.1. MỤC TIÊU </b>
Biến tính bề mặt vật liệu SBA-15 bằng oxit sắt và nhóm cacbonyl
để tạo ra vật liệu có khả năng hấp phụ tốt các hợp chất hữu cơ trong
dung dịch nước.
Tổng hợp vật liệu xúc tác ZnO pha tạp nitơ và TiO2 kết hợp
CdS trên nền vật liệu SBA-15 có khả năng xúc tác quang trong vùng
ánh sáng khả kiến nhằm ứng dụng phân hủy các hợp chất hữu cơ độc
hại trong môi trường nước dưới điều kiện ánh sáng khả kiến.
<b>2.2. NỘI DUNG </b>
</div>
<span class='text_page_counter'>(3)</span><div class='page_container' data-page=3>
- Nghiên cứu quá trình hấp phụ phenol, xanh metylen và Alizasrin
Red S trên vật liệu tổng hợp được.
-Tổng hợp vật liệu xúc tác quang trên nền vật liệu SBA-15
(N-ZnO/SBA-15 và TiO2-CdS/SBA-15) theo phương pháp gián tiếp.
- Nghiên cứu khả năng xúc tác quang của vật liệu đối với phản
ứng phân hủy xanh metylen và metyl da cam.
<b>2.3. CÁC PHƯƠNG PHÁP NGHIÊN CỨU </b>
Sử dụng các phương pháp: XRD, TEM, SEM, IR, EDS, UV-vis
rắn, XPS, hấp phụ và giải hấp phụ Nito ở 77 K.
<b>2.4. THỰC NGHIỆM </b>
Tổng hợp SBA-15 theo sơ đồ sau:
- SBA-15th được tách loại chất định hướng cấu trúc bằng cách
chiết với dung môi etylic gọi là SBA-15c.
- 15th được nung loại chất định hướng cấu trúc gọi là
SBA-15n.
Tổng hợp nFe2O3-SBA-15 theo sơ đồ sau:
Trong đó, n là % khối lượng Fe2O3 trong hỗn hợp đầu.
Tổng hợp SBA-15 chức năng hóa bề mặt bằng nhóm cacbonyl
theo sơ đồ sau:
Trong đó: P123 là EO20PO70EO20 - poly(ethylen
oxit)-poly-(propylen oxit)-poly(ethylen oxit), TEOS là Tetraethoxysilane, MPS
là 3-methacryloxypropyl trimethoxysilane, x là tỉ lệ mol
MPS/(MPS+TEOS) trong hỗn hợp đầu, t là thời gian thủy phân trước
của TEOS.
</div>
<span class='text_page_counter'>(4)</span><div class='page_container' data-page=4>
Quá trình hấp phụ được tiến hành trong bình kín, ở những thời
điểm xác định, mẫu được lấy ra li tâm loại bỏ chất hấp phụ, xác định
nồng độ dung dịch còn lại bằng phương pháp đo quang.
Tổng hợp vật liệu N-xZnO-SBA-15 theo sơ đồ sau:
Tổng hợp vật liệu nTiO2-CdS/SBA-15 theo sơ đồ sau:
Nghiên cứu khả năng xúc tác quang của vật liệu
kN-ZnO/SBA-15 và nTiO2-CdS/SBA-15 trong phản ứng xúc tác phân hủy quang
MB và metyl da cam (MO).
</div>
<span class='text_page_counter'>(5)</span><div class='page_container' data-page=5>
<b>Chương 3 </b>
<b>KẾT QUẢ VÀ THẢO LUẬN </b>
<b>3.1. Tổng hợp vật liệu hấp phụ và nghiên cứu tính chất hấp phụ </b>
<b>3.1.1. Tổng hợp vật liệu hấp phụ </b>
<b>3.1.1.1. Tổng hợp vật liệu SBA-15 và nFe2O3-SBA-15 </b>
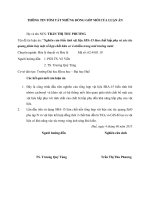
Hình 3.1 là kết quả nhiễu xạ tia X góc nhỏ với 2θ trong khoảng
0,5 - 6 độ. Ở các mẫu nFe2O3<b>-SBA-15, pic ứng với mặt (100) vẫn có </b>
cường độ rất mạnh cho thấy cấu trúc lục lăng của vật liệu SBA-15
vẫn được bảo toàn. Khi tăng hàm lượng Fe2O3, cực đại nhiễu xạ ứng
với mặt (100) có sự dịch chuyển nhẹ về phía góc 2 theta lớn hơn ứng
với sự giảm nhẹ giá trị d(100).
Đặc trưng nhiễu xạ tia X góc lớn ở hình 3.2 cho thấy khơng có sự
xuất hiện các pic tương ứng với các tinh thể Fe2O3 có thể các hạt
Fe2O3 có kích thước nano phân tán tốt trên bề mặt SBA-15.
</div>
<span class='text_page_counter'>(6)</span><div class='page_container' data-page=6>
Cực đại hấp thụ trong vùng 960 cm-1<sub> và 1635 cm</sub>-1<sub> tương ứng với </sub>
dao động của các nhóm silanol của các mẫu biến tính có chiều hướng
giảm dần so với SBA-15 (hình 3.3) có thể do tương tác axít – bazơ
yếu giữa các oxit kim loại và các nhóm silanol trên bề mặt SBA-15,
dẫn đến dao động của nhóm silanol bị giảm xuống.
Ngưng tụ mao quản của các mẫu xảy ra ở áp suất tương đối trong
khoảng 0,51 - 0,45, thấp hơn và ít rõ ràng hơn so với SBA-15n (hình
3.4). Đường phân bố kích thước mao quản hẹp và có cường độ lớn
(hình 3.5) chứng tỏ hệ thống mao quản đồng đều. Khi hàm lượng
chất tẩm tăng lên, các pic dịch chuyển về vùng nhỏ hơn chứng tỏ có
sự thu hẹp đường kính mao quản. Hiện tượng này có thể do một lớp
Fe2O3 phủ lên trên tường mao quản.
</div>
<span class='text_page_counter'>(7)</span><div class='page_container' data-page=7>
Hình 3.10 chỉ ra phổ XPS của một mẫu đại diện 2,7Fe2O3-SBA-15
với sự xuất hiện pic ở 711,3 eV tương ứng với trạng thái Fe 2p3/2
trong liên kết Fe(III) – O. Điều này cho phép chúng tôi khẳng định
sắt được đưa vào ở dạng Fe2O3.
Mẫu đại diện 2,7Fe2O3-SBA-15 còn được khảo sát điểm đẳng
điện với kết quả thu được là 5,9, trong lúc đó, đối với SBA-15n giá
trị này là 3,9.
</div>
<span class='text_page_counter'>(8)</span><div class='page_container' data-page=8>
<b>3.1.1.2. Tổng hợp SBA-15 chức năng hóa bằng nhóm cacbonyl </b>
<b>3.1.1.2.1. Ảnh hưởng của thời gian thủy phân trước TEOS </b>
Kết quả phân tích XRD trên hình 3.13 cho thấy trật tự cấu trúc
được cải thiện nhiều khi tăng thời gian thủy phân trước t. Ở thời gian
t = 3 giờ, ngồi pic tương ứng với mặt (100), cịn có thể nhận thấy
các pic ứng với mặt (110) và (200).
</div>
<span class='text_page_counter'>(9)</span><div class='page_container' data-page=9>
<b>3.1.1.2.2. Ảnh hưởng của tỉ lệ mol MPS </b>
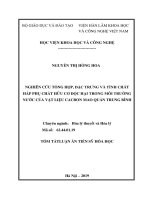
<i><b>Hình 3.16. Giản đồ nhiễu xạ tia X của SBA-15c (a), </b></i>
5CO-SBA-15-1h (b), 10CO-SBA-5CO-SBA-15-1h (c), 15CO-SBA-5CO-SBA-15-1h (d)
Kết quả phân tích XRD (hình 3.16) cho thấy tất cả các mẫu
xCO-SBA-15-1h đều có cấu trúc mao quản trung bình với mức độ trật tự
khác nhau, mức độ trật tự giảm dần khi tăng hàm lượng MPS.
</div>
<span class='text_page_counter'>(10)</span><div class='page_container' data-page=10>
Hình 3.21 chỉ ra tất cả các phổ đều xuất hiện một pic yếu xung
quanh 1700 cm-1<sub> đặc trưng cho dao động của nhóm C=O. Tuy vậy, </sub>
cường độ tăng dần và rõ ràng hơn khi tăng hàm lượng MPS trong
hỗn hợp đầu. Hình 3.22 cho thấy tính chất nhiệt của một mẫu đại
diện 10CO-SBA-15-1h, trong đó mẫu chức năng hóa mất trọng
lượng ở nhiệt độ cao hơn so với mẫu tổng hợp chưa loại chất ĐHCT
và trọng lượng mất nhiều hơn so với mẫu chiết với etanol. Điều này
chứng minh thêm sự có mặt nhóm cacbonyl. Các đặc trưng cấu trúc
<b>của các vật liệu chức năng hóa được trình bày trong bảng 3.3. </b>
<b>Bảng 3.3. Đặc trưng cấu trúc của các vật liệu xCO-SBA-15-1h </b>
Mẫu SBET
(m2<sub>/g) </sub> dmao quản<sub>(nm) </sub> a<sub>(nm) </sub>o dtường mao quản<sub>(nm) </sub>
SBA-15c 580 6,0 10,8 4,8
5CO-SBA-15-1h 404 5 10 5
10CO-SBA-15-1h 397 3,3 8,8 5,5
15CO-SBA-15-1h 209 3,2 9,2 6,0
Điểm đẳng điện của 10CO-SBA-15-1h có giá tri xấp xỉ 4,4. Giá
trị này lớn hơn SBA-15n nhưng lại bé hơn so với 2,7Fe2O3-SBA-15.
Tóm lại, đã tổng hợp thành công vật liệu SBA-15 có các nhóm
cacbonyl trên bề mặt. Hàm lượng nhóm cacbonyl tăng theo tỉ lệ mol
MPS trong hỗn hợp phản ứng. Mặt khác, mật độ nhóm cacbonyl tăng
đã kéo theo trật tự cấu trúc, diện tích bề mặt, đường kính mao quản
giảm; nhưng độ dày tường mao quản tăng.
<b>3.1.2. NGHIÊN CỨU TÍNH CHẤT HẤP PHỤ CỦA VẬT LIỆU </b>
<b>3.1.2.1. Khảo sát khả năng hấp phụ MB, ARS và phenol của vật </b>
<b>liệu SBA-15n, 2,7Fe2O3-SBA-15 và 10CO-SBA-15-1h </b>
Chúng tôi nghiên cứu sự hấp phụ MB, ARS và phenol trên ba vật
liệu SBA-15n, nFe2O3-SBA-15 và xCO-SBA-15-t. Đối với nFe2O3
-SBA-15 và xCO--SBA-15-t, qua khảo sát sơ bộ, chúng tôi chọn hai
vật liệu tương ứng là 2,7Fe2O3-SBA-15 và 10CO-SBA-15-1h. Kết
quả này sẽ được chúng tôi đề cập ở các phần sau.
</div>
<span class='text_page_counter'>(11)</span><div class='page_container' data-page=11>
tiết về sự hấp phụ của MB trên SBA-15n, ARS trên 2,7Fe2O3
-SBA-15 và phenol trên 10CO-SBA--SBA-15-1h.
<b>3.1.2.2. Nghiên cứu tính chất hấp phụ MB trên SBA-15n </b>
<b>3.1.2.2.1. Khảo sát thời gian đạt cân bằng hấp phụ </b>
</div>
<span class='text_page_counter'>(12)</span><div class='page_container' data-page=12>
<b>3.1.2.2.2. Ảnh hưởng của pH đến quá trình hấp phụ </b>
Hình 3.28 chỉ ra dung lượng hấp phụ nói chung tăng khi pH của
dung dịch tăng. Khả năng hấp phụ MB của vật liệu SBA-15n tăng
nhanh theo sự tăng pH có thể giải thích dựa trên điện tích bề mặt của
vật liệu SBA-15n. Giá trị điểm đẳng điện của vật liệu SBA-15n là
pHpzc = 3,9. Ở pH < pHpzc bề mặt vật liệu mang điện tích dương nên
tạo ra lực đẩy với cation MB, dẫn đến quá trình hấp phụ kém. Ở pH >
pHpzc bề mặt vật liệu mang điện tích âm, tăng cường tương tác với
<i>cation MB, do đó dung lượng hấp phụ tăng mạnh (giá trị qe</i> tăng
mạnh từ 6,71 đến 31,45 mg/g ở khoảng pH từ 3,2 đến 7,2).
<b>3.1.2.2.3. Động học hấp phụ MB trong dung dịch trên SBA-15n </b>
Kết quả khảo sát động học hấp phụ MB trên SBA-15n được trình
bày trong bảng 3.7 cho thấy mơ hình phương trình động học bậc hai
mơ tả tốt hơn bậc 1 cho q trình hấp phụ MB trên SBA-15n.
<b>Bảng 3.7. Thông số động học hấp phụ MB trên SBA-15n </b>
Co* 51,5 79,8 102,0 129,0 <b>159,0 Trung bình </b>
r (bậc 1) 0,968 0,982 0,978 0,981 0,975 <b>0,977 </b>
r (bậc 2) 0,999 0,998 0,996 0,999 0,997 <b>0,998 </b>
<i>* Co, r (bậc 1), r (bậc 2) tương ứng là nồng độ đầu, hệ số tương quan </i>
<i>động học bậc 1 và bậc 2 tương ứng. </i>
<b>3.1.2.2.4. Đẳng nhiệt hấp phụ MB trên SBA-15n </b>
</div>
<span class='text_page_counter'>(13)</span><div class='page_container' data-page=13>
<b>3.1.2.3. Nghiên cứu tính chất hấp phụ ARS trên 2,7Fe2O3-SBA-15 </b>
<b>3.1.2.3.1. Khảo sát thời gian đạt cân bằng hấp phụ </b>
Hình 3.34 cho thấy quá trình hấp phụ gần như đạt cân bằng hấp
phụ sau 12 giờ tuy nhiên để quá trình hấp phụ xảy ra hồn tồn chúng
tơi chọn thời gian hấp phụ là 24 giờ cho các thí nghiệm sau. Hình
3.34 cịn cho thấy vật liệu 2,7Fe2O3-SBA-15 có khả năng hấp phụ
ARS cao nhất so với hai vật liệu khác là 2Fe2O3-SBA-15 và 5Fe2O3
-SBA-15. Đây là lý do tại sao chúng tôi chọn 2,7Fe2O3-SBA-15 để
làm đại diện để nghiên cứu hấp phụ trên phần 3.1.2.1.
<b>3.1.2.3.2. Ảnh hưởng của pH </b>
Theo kết quả trên hình 3.36, dung lượng hấp phụ ARS của
2,7Fe2O3-SBA-15 giảm khi tăng pH. Điều này hoàn toàn phù hợp
tương tác tĩnh điện giữa ARS và bề mặt vật liệu 2,7Fe2O3-SBA-15.
Tuy nhiên dung lượng thay đổi khơng đáng kể, chứng tỏ ngồi tương
tác tĩnh điện có thể tồn tại một tương tác khác đóng góp vào sự hấp
phụ. Ở đây có thể là tương tác axit-bazơ Lewis. Trong đó, Fe2O3 đóng
vai trị như các tâm axit Lewis và các nguyên tử O của ARS có một
cặp điện tử chưa tham gia liên kết đóng vai trị như một bazơ Lewis.
<b>3.1.2.3.3. Động học hấp phụ ARS trong dung dịch trên 2,7Fe2O3</b>
<b>-SBA-15 </b>
Từ kết quả khảo sát động học trình bày trong bảng 3.11 có thể
thấy rằng phương trình bậc 2 mô tả tốt quy luật động học hấp phụ
ARS trên 2,7Fe2O3-SBA-15 hơn là bậc 1.
<b>Bảng 3.11. Thông số động học hấp phụ ARS trên 2,7Fe</b>2O3-SBA-15
Co* 26,7 49,4 76,8 99,0 <b>125,1 Trung bình </b>
r (bậc 1) 0,989 0,988 0,985 0,984 0,972 <b>0,984 </b>
r (bậc 2) 0,997 0,999 0,999 0,999 0,999 <b>0,999 </b>
<i>* Co, r (bậc 1), r (bậc 2) tương ứng là nồng độ đầu, hệ số tương quan </i>
</div>
<span class='text_page_counter'>(14)</span><div class='page_container' data-page=14>
<b>3.1.2.3.4. Đẳng nhiệt hấp phụ ARS trên 2,7Fe2O3-SBA-15 </b>
Áp dụng mơ hình đẳng nhiệt Langmuir đối với sự hấp phụ ARS
trên 2,7Fe2O3-SBA-15 thu được qm = 76,28 (mg/g), KL = 0,017 và hệ
số tương quan r = 0,998. Đối với mơ hình Freundlich, các tham số
thu được như sau KF = 2,44, 1/n = 0,6786 và hệ số tương quan r =
0,995. Như vậy, cả hai mơ hình đều mơ tả tốt đối với quá trình hấp
phụ ARS trên 2,7Fe2O3-SBA-15 ở 298K.
<b>3.1.2.4. Nghiên cứu tính chất hấp phụ phenol trên 10CO-SBA-15-1h </b>
<b>3.1.2.4.1. Khảo sát thời gian đạt cân bằng hấp phụ </b>
Hình 3.40 cho thấy sau 12 giờ hấp phụ, quá trình gần như đạt
trạng thái cân bằng. Cũng từ kết quả khảo sát này cho thấy dung
lượng hấp phụ phenol của 10CO-SBA-15-1h là tốt nhất.
<b>3.1.2.4.2. Ảnh hưởng của pH </b>
</div>
<span class='text_page_counter'>(15)</span><div class='page_container' data-page=15>
<b>3.1.2.4.2. Động học hấp phụ phenol trong dung dịch bằng </b>
<b>10CO-SBA-15-1h </b>
Bảng 3.12 chỉ ra rằng mơ hình động học biểu kiến bậc 2 phù hợp
tốt quy luật động học hấp phụ phenol trên 10CO-SBA-15-1h.
<b>Bảng 3.12. Các thông số động học hấp phụ phenol </b>
trên 10CO-SBA-15-1h
Co* 49,7 99,6 149,4 198,9 <b>Trung bình </b>
r (bậc 1) 0,981 0,973 0,942 0,963 <b>0,965 </b>
r (bậc 2) 0,993 0,994 0,995 0,998 <b>0,995 </b>
<i>* Co, r (bậc 1), r (bậc 2) tương ứng là nồng độ đầu, hệ số tương quan </i>
<i>động học bậc 1 và bậc 2 tương ứng. </i>
<b>3.1.2.4.3. Đẳng nhiệt hấp phụ phenol trên 10CO-SBA-15-1h </b>
Áp dụng mơ hình đẳng nhiệt Langmuir đối với sự hấp phụ phenol
trên 10CO-SBA-15-1h thu được qm = 61,73 (mg/g), KL = 0,0034 và
hệ số tương quan r = 0,9974. Với mô hình Freundlich, các tham số
thu được như sau KF = 0,74, 1/n = 0,7886 và hệ số tương quan r =
0,9976. Như vậy, cả hai mơ hình đều mơ tả tốt q trình hấp phụ
phenol trên 10CO-SBA-15-1h ở 298K.
Các kết quả trên chỉ ra rằng chúng tôi đã thành công trong việc
tổng hợp các vật liệu biến tính SBA-15 có khả năng hấp phụ các hợp
chất hữu cơ trong nước. Chất bị hấp phụ được chọn là 3 chất hữu cơ
điển hình trong đó hai thuốc nhuộm mang điện tích và chất trung hịa
điện là phenol. Dữ liệu hấp phụ cho thấy số tâm hấp phụ và ái lực với
chất bị hấp phụ đóng một vai trị quan trọng trong việc quyết định
dung lượng hấp phụ. Đây là cơ sở khoa học để thiết kế một vật liệu
mong muốn đối với một chất cần hấp phụ cụ thể.
Trong luận án này, cả ba trường hợp hấp phụ đều tuân theo
động học biểu kiến bậc 2. Theo nhiều tài liệu, động học biểu kiến bậc
hai phù hợp với sự hấp phụ hóa học. Điều này cho thấy cả ba trường
hợp ở trên giai đoạn quyết định tốc độ là hấp phụ và lực hấp phụ chủ
yếu là các tương tác hóa học.
</div>
<span class='text_page_counter'>(16)</span><div class='page_container' data-page=16>
dịch trên bề mặt rắn. Như vậy, cả ba trường hợp hấp phụ ở trên có thể
là các hấp phụ hóa học, ở đó lực liên kết là các tương tác hóa học.
<b>3.2. Tổng hợp vật liệu xúc tác và tính chất xúc tác quang </b>
<b>3.2.1. Tổng hợp vật liệu kN-nZnO/SBA-15 và nghiên cứu khả </b>
<b>năng xúc tác </b>
<b>3.2.1.1. Tổng hợp vật liệu nZnO/SBA-15 </b>
Hình 3.45 cho thấy cấu trúc SBA-15 vẫn tồn tại trong các mẫu
nZnO/SBA-15. Tuy nhiên, mức độ trật tự giảm khi tăng hàm lượng
ZnO.
</div>
<span class='text_page_counter'>(17)</span><div class='page_container' data-page=17>
<b>3.2.1.2. Tổng hợp vật liệu kN-30ZnO/SBA-15 </b>
Qua khảo sát sơ bộ, trong phần này chúng tơi chỉ tập trung trình
bày kết quả sản phẩm biến tính pha tạp nitơ của 30ZnO/SBA-15 với
nguồn cung cấp N là urê.
Các giản đồ nhiễu xạ tia X (hình 3.51 và 3.52), hình ảnh TEM và
SEM cho thấy 3N-30ZnO/SBA-15 vẫn giữ được cấu trúc lục lăng
mao quản trung bình của SBA-15 và ZnO đã được phân tán dưới
dạng các hạt rất nhỏ với kích cỡ nano trên bề mặt SBA-15.
</div>
<span class='text_page_counter'>(18)</span><div class='page_container' data-page=18>
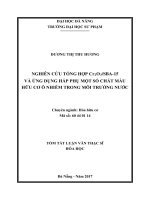
Việc pha tạp thành công N trong vật liệu 3N-30ZnO/SBA-15
được chứng minh bởi xuất hiện 2 pic tại vùng 1340 và 1500 cm-1
(hình 3.57) tương ứng với dao động của liên kết Zn-N trong vật liệu
3N-30ZnO/SBA-15 và xuất hiện cực đại hấp phụ ở bước sóng lớn
hơn (370 nm) và mở rộng về vùng bước sóng 600-700 nm (hình
3.59). Năng lượng vùng cấm của các mẫu kN-30ZnO/SBA-15 giảm
dần theo số lần xử lý urê. Cụ thể năng lượng vùng cấm bằng 2,96 eV,
2,88 eV và 2,83 eV tương ứng với k bằng 1, 2 và 3.
Sự pha tạp thành cơng cịn thể hiện từ kết quả XPS (Hình 3.62)
với sự xuất hiện pic ở 398,5 eV được cho là của N trong liên kết
O-Zn-N. Tất cả các kết quả đặc trưng trên đã minh chứng cho việc pha
tạp thành công N trong 3N-30ZnO/SBA-15.
<b>3.2.1.3. Nghiên cứu khả năng xúc tác quang của vật liệu </b>
<b>3N-30ZnO/SBA-15 </b>
</div>
<span class='text_page_counter'>(19)</span><div class='page_container' data-page=19>
Hình 3.65 chỉ ra rằng vật liệu 30ZnO/SBA-15 hầu như khơng có
khả năng xúc tác quang trong vùng khả kiến. Trong khi đó các vật
liệu biến tính pha tạp nitơ đều có khả năng xúc tác quang khá cao.
Tất cả các mẫu kN-30ZnO/SBA-15 đều cho hoạt tính xúc tác quang
cao hơn mẫu vật liệu 3N-ZnO, hiệu quả xúc tác tăng dần theo số lần
pha tạp.
Quá trình phân hủy quang MB tn theo mơ hình
Langmuir-Hinshelwood. Khi tăng nồng độ, cả hệ số tương quan r cũng như
hằng số tốc độ biểu kiến k1 đều giảm.
</div>
<span class='text_page_counter'>(20)</span><div class='page_container' data-page=20>
<b>3.2.2. Tổng hợp vật liệu nTiO2-CdS/SBA-15 và nghiên cứu khả </b>
<b>năng xúc tác quang </b>
<b>3.2.2.1. Tổng hợp vật liệu nTiO2-CdS/SBA-15 </b>
Cấu trúc lục lăng của SBA-15 vẫn được duy trì trong các vật liệu
nTiO2-CdS/SBA-15 được thể hiện qua phổ nhiễu xạ tia X (hình
3.67), các hình ảnh TEM (hình 3.68) và đường cong hấp phụ giải hấp
phụ N2 (hình 3.70). Tuy nhiên độ trật tự giảm theo hàm lượng TiO2.
</div>
<span class='text_page_counter'>(21)</span><div class='page_container' data-page=21>
Sự có mặt của Ti và Cd cịn thể hiện từ kết quả XPS (Hình 3.75,
3.76) với sự có mặt 2 pic ở 464,3 và 458,6 eV tương ứng với trạng
thái Ti4+<sub> 2p</sub>
1/2 và Ti4+ 2p3/2 của TiO2, và sự xuất hiện pic ở 411,8 và
405,0 eV tương ứng với Cd2+ <sub>3d</sub>
3/2 và Cd2+ 3d5/2 của CdS.
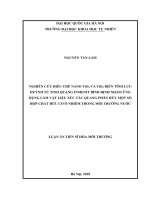
Phổ hấp thụ electron (hình 3.78) chỉ ra rằng mỗi mẫu có hai pic
hấp thụ. Pic thứ nhất nằm ở khoảng 300 nm và có xu hướng dịch
sang vùng có bước sóng lớn khi tăng hàm lượng TiO2. Pic thứ hai
nằm khoảng 480 nm và có cường độ giảm dần khi tăng hàm lượng
TiO2. Từ kết quả này, năng lượng vùng cấm được tính theo hàm
Kubelka-Munk được các giá trị 2.4 eV và 3,45 tương ứng với CdS và
TiO2<i> trong vật liệu. </i>
<b>3.2.2.2. Nghiên cứu khả năng xúc tác quang của nTiO2-CdS/SBA-15 </b>
<b>3.2.2.2.1. Khả năng xúc tác của vật liệu nTiO2-CdS/SBA-15 trên MO </b>
</div>
<span class='text_page_counter'>(22)</span><div class='page_container' data-page=22>
Hình 3.84 cho thấy khả năng xúc tác quang trong vùng ánh sáng
khả kiến của vật liệu TiO2-SBA-15 là không đáng kể. Trong khi đó,
cả hai vật liệu CdS/SBA-15, và 40TiO2-CdS/SBA-15 cả hai vật liệu
đều có khả năng xúc tác quang phân hủy MO dưới ánh sáng đèn sợi
đốt. Tuy nhiên, khả năng xúc tác lớn hơn nhiều khi có mặt đồng thời
TiO2 và CdS.
Độ bền xúc tác của vật liệu cũng được nghiên cứu và cho thấy vật
liệu có độ bền xúc tác cao.
<b>KẾT LUẬN </b>
1. Vật liệu nFe2O3-SBA-15 với n là phần trăm khối lượng của
Fe2O3 trong hỗn hợp đầu (n = 2; 2,7 và 5%) đã được tổng hợp bằng
việc xử lý nhiệt sau khi tẩm SBA-15 bởi Fe(NO3)3. Vật liệu được
phân tích bằng nhiều phương pháp hiện đại như XRD, TEM, SEM,
IR, Hấp phụ và khử hấp phụ N2 ở 77K, EDS, XPS và điểm đẳng
điện. Kết quả đặc trưng chỉ ra rằng vật liệu nFe2O3-SBA-15 vẫn giữ
được cấu trúc và hình thái của vật liệu SBA-15 nhưng sự có mặt của
Fe2O3 đã làm cho tính chất bề mặt có sự thay đổi, điểm đẳng điện của
vật liệu 2,7Fe2O3-SBA-15 đã được xác định có giá trị xấp xỉ 5,9.
</div>
<span class='text_page_counter'>(23)</span><div class='page_container' data-page=23>
nhưng độ dày tường mao quản tăng. điểm đẳng điện của vật liệu
10CO-SBA-15-1h có giá trị là 4,4.
3. SBA-15 đã loại chất định hướng cấu trúc bằng nhiệt
(SBA-15n) có khả năng hấp phụ tốt MB (thuốc nhuộm thuộc nhóm cation),
trong khi đó 2,7Fe2O3-SBA-15 lại hấp phụ tốt ARS (thuốc nhuộm
thuộc nhóm anion) và 10CO-SBA-15-1h lại có khả năng hấp phụ
phenol (phân tử trung hịa). Q trình hấp phụ tn theo mơ hình
động học biểu kiến bậc hai, phù hợp với cả hai mô hình đẳng nhiệt
hấp phụ Langmuir và Freundlich. Dung lượng hấp phụ cực đại thu
được lần lượt là qm = 320,51 mg/g, qm = 76,28 mg/g và qm =
61,73mg/g tương ứng với hấp phụ MB trên SBA15n, ARS trên
2,7Fe2O3-SBA-15 và phenol trên 10CO-SBA-15-1h. Dung lượng hấp
phụ MB trên SBA-15n tăng khi tăng pH của dung dịch nhất là trong
khoảng pH từ 3,2 đến 7,2, trong khi đó dung lượng hấp phụ ARS trên
2,7Fe2O3-SBA-15 và phenol trên 10CO-SBA-15-1h lại giảm khi tăng
pH của dung dịch. Như vậy, có thể khẳng định rằng có một mối liên
quan chặt chẽ giữa tính chất bề mặt vật liệu và tính chất của chất bị
hấp phụ đến khả năng hấp phụ của vật liệu. Bằng việc biến tính bề
mặt vật liệu SBA-15 với nhóm Fe2O3 và CO chúng tơi đã cải thiện
đáng kể khả năng hấp phụ anion thuốc nhuộm (ARS) và phân tử hữu
cơ trung hòa (phenol) của vật liệu.
4. Đã tổng hợp được vật liệu ZnO pha tạp nitơ từ urê trên nền
SBA-15 (3N-ZnO/SBA-15). Vật liệu tổng hợp được có hoạt tính xúc
tác quang trong vùng ánh sáng nhìn thấy cao hơn hẳn so với vật liệu
ZnO không pha tạp được phân tán trên nền SBA-15 (ZnO/SBA-15)
cũng như vật liệu có pha tạp nhưng không được phân tán trên pha
nền SBA-15 (3N-ZnO). Quá trình xúc tác phân hủy quang của vật
liệu đối với dung dịch MB tn theo mơ hình động học
Langmuir-Hinshelwood.
</div>
<span class='text_page_counter'>(24)</span><div class='page_container' data-page=24>
<b>Introduction </b>
Environmental pollution is affecting more and more adversely to
human life all over the world. Study on treatment and removal of
pollution compounds, especially toxic organic compounds in
aqueous solutions is thus important and urgent. There are many
techniques to solve this problem, namely evaporation, electric
kinetic, thermal desorption, biological method, photochemical
catalysis, adsorption and liquid phase extraction. Among these
methods, adsorption and photocatalysis methods have been widely
studied due to low operating cost, ease of handling and high
efficiency.
</div>
<span class='text_page_counter'>(25)</span><div class='page_container' data-page=25>
and adsorption. Meanwhile, only a few investigations on materials
functionalized by organic functional groups were carried out.
On the basis of analysis mentioned above, in this thesis we choose
SBA-15 as a substrate to disperse the active phase with the purpose
of becoming the adsorbent and photocatalyst for the removal of toxic
organic compounds from aqueous solutions. Active phases for
adsorption include Fe2O3, a metal oxide (corresponding to Fe2O3
-SBA-15 material) and carbonyl group, an organic group
(corresponding to CO-SBA-15 material). The selection of various
active phases used as adsorption centers was based on the interaction
ability between active phases and adsorbates. For photocatalysts, the
avtive phase contains nitrogen-doped ZnO (N-ZnO/SBA-15) and the
composite assembled from two semiconductors, namely CdS-TiO2
(TiO2-CdS/SBA-15), in which CdS plays a role as a photosensitizer
in the visible light region. The design of the two active phases in the
photocatalysts above is based on the principle of the two
modification methods to make a semiconductor only working in the
ultraviolet light to become active in the visible range: (i) reducing the
band gap energy (for N-doped ZnO) and (ii) combining with another
semiconductor to be able to operate under the visible region, where
they act as photosensitive substance. For TiO2, CdS is used as a
combining semiconductor. With regards to toxic organic substances,
phenols and dyes are selected for studying in this thesis.
</div>
<span class='text_page_counter'>(26)</span><div class='page_container' data-page=26>
This is the first study on functionalization of SBA-15 with
carbonyl group and a relationship between interactions of adsorbent
with adsorbates and adsorption ability of the materials. This is also
the first time that SBA-15 is used as a substrate to disperse N-doped
ZnO and combined two semiconductors, namely TiO2-CdS to
produce photocatalysts which is capable of activation under the
visible light.
<b>Chapter 1. Overall background </b>
This chapter gives some overall information about mesoporous
materials, SBA-15, the application of SBA-15 material, methods
used to modify mesoporous and photocatalytic materials, as well as
some methods used to remove toxic organic compounds in the
aqueous solutions.
<b>Chapter 2. Experimental and research methods </b>
<b>2.1. Objects </b>
Modify SBA-15 material surface with iron oxide and carbonyl
groups to produce materials having good absorption capacity of organic
compounds in aqueous solutions.
Synthesize nitrogen-doped ZnO/SBA-15 materials and TiO2
combining CdS supported by SBA-15 which are capable of photocatalysis
in the visible light region for decomposing toxic organic compounds in
aqueous solutions under visible light conditions.
<b>2.2. Contents </b>
</div>
<span class='text_page_counter'>(27)</span><div class='page_container' data-page=27>
- Study adsorption process of phenol, methylene blue and
Alizasrin Red S on the synthesized materials.
- Synthesize photocatalytic materials supported by SBA-15
(N-ZnO/SBA-15 and TiO2-CdS/SBA-15) by the indirect method.
- Investigate photocatalytic activity of the materials in the
degradation of methylene blue and methyl organe under visible light.
<b>2.3 Research methods </b>
The methods used include: XRD, TEM, SEM, IR, EDS, UV-VIS
DRS, XPS, N2 adsorption/desorption at 77 K.
<b>2.4 Experiment section </b>
SBA-15 was synthesized by the following diagram:
- SBA-15th after removing directing agent by ethanol extraction
was denoted as SBA-15c.
- SBA-15th after removing directing agent by calcinating was
denoted as SBA-15n.
nFe2O3-SBA-15 materials were synthesized by the following
procedure:
Where n is the weight ratio of Fe2O3 in the initial mixture.
</div>
<span class='text_page_counter'>(28)</span><div class='page_container' data-page=28>
Where P123 is EO20PO70EO20 - poly(ethylen oxit)-poly-(propylen
oxit)-poly(ethylen oxit), TEOS is Tetraethoxysilane, MPS is
3-methacryloxypropyl trimethoxysilane, x the molar ratio of MPS in
the initial mixture, t is prehydrolytic time of TEOS.
Study adsorption ability of SBA-15, nFe2O3-SBA-15 and
xCO-SBA-15 toward metylene blue (MB), Alizarin Red S (ARS) and
phenol, investigate the influence factors on adsorption process.
Adsorption processes were carried out in closed beaker, at the
certain time, the solution sample was take out and the adsorbents
were separated through centrifugation and the concentration of the
remaining of MB, ARS and phenol were determined through UV-vis
absorption spectroscopy.
N-xZnO-SBA-15 were synthesized by the following procedures:
nTiO2-CdS/SBA-15 were synthesized by the following
procedures:
</div>
<span class='text_page_counter'>(29)</span><div class='page_container' data-page=29>
For the photocatalytic test, the mixture was stirred for 2 h in the
dark to obtain equilibrium adsorption-desorption. After a given
irradiation time, the certain mixture was withdrawn and the
catalysts were separated by centrifugation and the concentrtion of
the solutions were determined through UV-vis absorption
spectroscopy.
<b>Chapter 3. Results and Discussion </b>
<b>3.1 Synthesis of adsorbents and adsorption properties </b>
<b>3.1.1. Synthesis of adsorbents </b>
<b>3.1.1.1. Synthesis of SBA-15 and nFe2O3-SBA-15 </b>
The low-angle XRD patterns of SBA-15 and nFe2O3<b>-SBA-15 are </b>
shown in Fig. 3.1. nFe2O3<b>-SBA-15 samples exhibit very similar </b>
pattern as that of SBA-15, with well resolved diffraction peaks which
are indexed to the (100) reflections, indicating the characteristic
hexagonal mesoporous features of SBA-15 are still well maintained
in the nFe2O3<b>-SBA-15 samples. As the contents of Fe</b>2O3 increase,
the diffraction from (100) plane is shifted to higher 2 theta angles,
suggesting a decrease in d-spacing.
</div>
<span class='text_page_counter'>(30)</span><div class='page_container' data-page=30>
<b>Fig. 3.3. IR spectra of Calcined SBA-15n (a); 2Fe</b>2O3-SBA-15 (b);
2,7Fe2O3-SBA-15 (c) and 5Fe2O3-SBA-15 (d)
As can be seen in Fig. 3.3, mesoporous silica
SBA-15 shows that framework bands at 960 cm-1<sub> và 1635 cm</sub>-1
(stretching frequency of Si–O–H) of nFe2O3<b>-SBA-15 tend to </b>
decrease compared to those of SBA-15. This is due to acid –
base interaction between metal oxide and silanol groups on
the surface of SBA-15, which result in the decreasing of
silanol vibration.
</div>
<span class='text_page_counter'>(31)</span><div class='page_container' data-page=31>
P/P0 range (0.51 – 0.45) and less clearly compared to SBA-15 (Fig.
3.4), the pore size distribution are narrow with high intensity,
indicating order pore system and a slightly smaller pore volume in
the nFe2O3<b>-SBA-15 with higher content of Fe</b>2O3 (Fig. 3.5). This
may be due to Fe2O3 covered on pore wall of SBA-15.
The TEM and SEM images show that the structure and
morphology of SBA-15 are maintained. The textural properties of
SBA-15 and nFe2O3<b>-SBA-15 are in table 3.1. </b>
<b>Bảng 3.1. Structural, textural properties of nFe</b>2O3<b>-SBA-15 </b>
<b>Samples </b> <b>SBET</b>
<b>(m2<sub>/g) </sub></b>
<b>Pore diameter </b>
<b>(nm) </b> <b>ao (nm) </b>
<b>Wall </b>
<b>thickness </b>
<b>(nm) </b>
SBA-15n 600 6.1 10.8 4.7
2Fe2O3-SBA-15 488 5.0 10.4 5.4
2.7Fe2O3-SBA-15 461 4.5 10.0 5.5
</div>
<span class='text_page_counter'>(32)</span><div class='page_container' data-page=32>
Fig. 3.10 shows the X-ray photoelectron spectrum of Fe 2p3/2
in 2.7Fe2O3-SBA-15. The peak is centered at 710.3 eV,
which matches well with the Fe 2p3/2 in Fe(III) – O bond.
This result can be proved that iron exists in Fe2O3 form.
The zero charge point (pHpzc) of 2,7Fe2O3-SBA-15 is 5.9,
while, it is 3.9 for SBA-15n.
These results evidence strongly that SBA-15 was
modified by homogenously dispersing Fe2O3 with various
contents on the surface of SBA-15. Pore diameter, and
specific surface area BET (SBET) of nFe2O3-SBA-15 are also
found to decrease significantly with increasing Fe(NO3)3
content in the initial mixture. Conversely, silica wall
thickness increases in the same order.
<b>3.1.1.2. Synthesis of carbonyl-functionalized SBA-15 </b>
<b>3.1.1.2.1. Influence of TEOS prehydrolysis time </b>
</div>
<span class='text_page_counter'>(33)</span><div class='page_container' data-page=33>
10CO-SBA-15-t also was characterized by IR
spectroscopy (Fig. 3.15). The result shows that for all
10CO-SBA-15-t materials, especially 10CO-SBA-15-3h, the peaks
in the region of 1250-1500 cm-1<sub> and around 2800 - 3000 cm</sub>-1
corresponding to P123 became negligible, indicating that the
surfactant in the extracted materials was almost completely
removed upon extraction with ethanol. In addition, there are a
shoulder around 1,697 cm-1<sub> appearing in all spectra of </sub>
10CO-SBA-15-2h (c); 10CO-SBA-15-1h (d); 10CO-SBA-15-0,5h
(e), which may correspond to vibrational mode of C=O
group. The intensity of this shoulder increases with
decreasing prehydrolysis time of TEOS. These results
evidence strongly that t = 1 enough for maintaining
mesostructure as well as the presence of carbonyl group with
remarkable content. Based on the obtained results, we
therefore chose t = 1 for all following studies.
</div>
<span class='text_page_counter'>(34)</span><div class='page_container' data-page=34>
<i><b>Fig. 3.16. Powder low-angle XRD patterns of: SBA-15c (a), </b></i>
5CO-SBA-15-1h (b), 10CO-SBA-15-1h (c), 15CO-SBA-15-1h (d)
The results in Fig. 3.16 can be attributed to the loss of
mesostructured order of the materials with increasing MPS
content.
For the functionalized SBA-15 samples, it has been
shown that the isotherms with a capillary condensation of N2
occurred over a slightly lower P/P0 range (Fig. 3.19) and a
slightly smaller pore diameter (Fig. 3.20) obtained in the
functionalized samples with higher content of MPS. This
may be due to the increased carbonyl content resulting in a
decrease in pore diameter when increasing MPS content in
the initial mixture.
</div>
<span class='text_page_counter'>(35)</span><div class='page_container' data-page=35>
(Fig. 3.21). The intensity of this shoulder increases with
increasing content of MPS in the initial mixture. Fig. 3.22
shows the thermal property of 10CO-SBA-15-1h, in which,
carbonyl-functionalized SBA-15 loss weight at higher
temperature compared to SBA-15 with P123 in structure and
loss more weight than the one that have extracted with
ethanol. These results evidence strongly that the carbonyl
groups are present in the functionalized materials. Structural,
textural properties of the carbonyl-funtionalized SBA-15
materials are shown in table 3.3.
<b>Bảng 3.3. Structural, textural properties of xCO-SBA-15-1h </b>
Samples SBET
(m2/g)
Pore
diameter
(nm)
ao
(nm)
Wall
thickness
(nm)
SBA-15c 580 6.0 10.8 4.8
5CO-SBA-15-1h 404 5.0 10.0 5.0
10CO-SBA-15-1h 397 3.3 8.8 5.5
15CO-SBA-15-1h 209 3.2 9.2 6.0
The zero charge point (pHpzc) of 10CO-SBA-15-1h is
4.4. This value is higher than that of SBA-15n but smaller
than that of 2.7Fe2O3-SBA-15.
In general speaking, carbonyl-functionalized SBA-15
was successfully synthesized. The carbonyl content increases
with increasing molar ratio of MPS in the initial mixture. In
orther hand, an increase of the density of carbonyl group
results in a decrease in mesostructure order, surface area,
pore diameter but an increase in wall thickness.
<b>3.1.2. </b> <b>ADSORPTION </b> <b>PROPERTIES </b> <b>OF </b> <b>THE </b>
<b>MATERIALS </b>
<b>3.1.2.1. Investigation of adsorption of MB, ARS and </b>
<b>phenol onto SBA-15n, 2,7Fe2O3-SBA-15 and </b>
<b>10CO-SBA-15-1h </b>
</div>
<span class='text_page_counter'>(36)</span><div class='page_container' data-page=36></div>
<span class='text_page_counter'>(37)</span><div class='page_container' data-page=37>
Table 3.5 shows that both SBA-15n and
10CO-SBA-15-1h possess a good adsorption ability for MB, while ARS
and phenol were well absorbed on 2,7Fe2O3-SBA-15 and
10CO-SBA-15-1h, respectively. Some assumptions about
interaction forces between adsorbents and adsorbates are
presented in table 3.6. Based on these results, in the
subsequent experiments we will investigate adsorption
process of MB onto SBA-15n, ARS onto 2,7Fe2O3-SBA-15
and phenol onto 10CO-SBA-15-1h.
</div>
<span class='text_page_counter'>(38)</span><div class='page_container' data-page=38>
<b>3.1.2.2.1. Adsorption equilibrium time </b>
Fig. 3.27 indicates that equilibrium was reached at
about 120 minutes. However, to obtain an absolute
equilibrium for all subsequent adsorption experiments, we
selected a stirring time of 180 minutes.
<b>3.1.2.2.2. Influence of pH toward MB adsorption process </b>
<b>onto SBA-15n </b>
Figure 3.28 indicates that an increase in uptake of
MB generally obtains for SBA-15n with increasing the pH
value from 3 to 11. This can be explained by the surface
charge of the SBA- 15n material with pHpzc of 3.9. At pH <
pHpzc, material surface positively charged so induce thrust
with MB, leading to a poor adsorption ability. At pH > pHpzc,
material surface negatively charged, enhances interaction
with cationic MB, so the strong adsorption capacity was
obtained and as a result, qe value increased from 6.71 to
31.45 mg/g at pH range from 3.2 to 7.2.
<b>3.1.2.2.3. Adsorption kinetics of MB adsorption onto </b>
<b>SBA-15n </b>
</div>
<span class='text_page_counter'>(39)</span><div class='page_container' data-page=39>
Table 3.7. Adsorption kinetics parameters of MB onto
SBA-15n
Co* 51.5 79.8 102.0 129.0 159.0 <b>average </b>
<i>r (First Order) </i> 0.968 0.982 0.978 0.981 0.975 <b>0.977 </b>
<i>r (Second Order) </i> 0.999 0.998 0.996 0.999 0.997 <b>0.998 </b>
<i>* Co, r (First Order), r (Second Order) are</i> <i>initial concentration, </i>
<i>coefficient correlation of First Order and Second Order kinetics, </i>
<i>respectively. </i>
<b>3.1.2.2.4. Adsorption isotherms of MB adsorption onto </b>
<b>SBA-15n </b>
From the linearized Langmuir equation, the values of
qm= 320.61 (mg/g), KL= 0.084 and the coefficient correlation
r = 0.9814 were calculated. For Freundlich model KF= 25.41,
1/n = 0.826 and a coefficient correlation r = 0.9843. Thus,
both models are good descriptions for MB adsorption process
onto SBA-15n at 298K.
<b>3.1.2.3. ARS adsorption onto 2,7Fe2O3-SBA-15 </b>
<b>3.1.2.3.1. Adsorption equilibrium time </b>
Fig. 3.34 shows that the equilibrium time is about 12
hours. However, to obtain an absolute equilibrium for all
subsequent adsorption experiments, we selected an
adsorption time of 24 hours. Figure 3.34 also shows that
2,7Fe2O3-SBA-15 material have the highest of ability
adsorption for ARS compared to the two other materials
(2Fe2O3-SBA-15 and 5Fe2O3-SBA-15). This is the reason
why we selected 2.7Fe2O3-SBA-15 to study adsorption in
part 3.1.2.1.
<b>3.1.2.3.2. Influence of pH onARS adsorption onto</b>
<b>2.7Fe2O3-SBA-15 </b>
</div>
<span class='text_page_counter'>(40)</span><div class='page_container' data-page=40>
may be other interactions contributing to the adsorption. This
can be the Lewis acid-base interactions, in which, Fe2O3 acts
as the Lewis acid center and the O atoms of the ARS with a
free electron pair act as a Lewis base.
<b>3.1.2.3.3. Adsorption kinetics of ARS adsorption onto </b>
<b>2,7Fe2O3-SBA-15 </b>
Table 3.11 shows that the adsorption of ARS onto
SBA-15n was fitted by the Pseudo-Second Order equation better
than the Pseudo-First Order Equation.
Table 3.11. Adsorption kinetics parameters of ARS onto
2.7Fe2O3-SBA-15
Co* 26.7 49.4 76.8 99.0 125.1 <b>Average </b>
<i>r (First Order) </i> 0.989 0.988 0.985 0.984 0.972 <b>0.984 </b>
<i>r (Second Order) </i> 0.997 0.999 0.999 0.999 0.999 <b>0.999 </b>
<i>* Co, r (First Order), r (Second Order) are</i> <i>initial concentration, </i>
<i>coefficient correlation of First Order and Second Order kinetics, </i>
<i>respectively</i>
<b>3.1.2.3.4. Adsorption isotherms of ARS adsorption </b>
<b>process onto 2.7Fe2O3-SBA-15 </b>
</div>
<span class='text_page_counter'>(41)</span><div class='page_container' data-page=41>
descriptions for MB adsorption process onto SBA-15n at
298K.
<b>3.1.2.4. Phenol adsorption onto 10CO-SBA-15-1h </b>
<b>3.1.2.4.1. Adsorption equilibrium time </b>
Fig. 3.40 shows that the equilibrium was reached at
about 12 hours and among xCO-SBA-15-1h,
10CO-SBA-15-1h possesses the highest phenol adsorption capacity.
<b>3.1.2.4.2. Influence of pH onphenol adsorption onto</b>
<b>10CO-SBA-15-1h </b>
Fig. 3.41 shows that a decrease in uptake of phenol generally
obtains for SBA-15/CO-10 with increasing the pH value. The
hydrogen bonds between the carbonyl groups of 10CO-SBA-15-1h
and –OH group of phenol may play an importance role in adsorption
forces. The forms of phenol in aqueous medium depend on pH
values. The dissociation degree of hydroxyl groups of phenol is
enhanced with the increase of pH value, resulting in weakening
hydrogen bond and thus decreasing adsorption capacity. On the other
hand, the zero charge point (pHpzc) of 10CO-SBA-15-1h is 4, at pH >
7, material surface negatively charged, while at pH > 7, dissociation
degree of hydroxyl groups of phenol is strong increasing, phenol just
exists in phenolat (anion), electrostatic thrust force occurs to decrease
adsorption process. For those reason, at pH > 7 the phenol adsorption
capacity onto 10CO-SBA-15-1h is significantly decreased.
</div>
<span class='text_page_counter'>(42)</span><div class='page_container' data-page=42>
Table 3.12 shows that the Pseudo-Second Order equation
better describes the adsorption process of phenol onto 10CO-SBA-15
than the Pseudo-First Order Equation.
Table 3.12. Adsorption kinetics parameters of phenol onto
10CO-SBA-15
Co* 49.7 99.6 149.4 198.9 <b>Average </b>
<i>r (First Order) </i> 0.981 0.973 0.942 0,963 <b>0.965 </b>
<i>r (Second Order) </i> 0.993 0.994 0.995 0,998 <b>0.995 </b>
<i>* Co, r (First Order), r (Second Order) are</i> <i>initial concentration, </i>
<i>coefficient correlation of First Order and Second Order kinetics, </i>
<i>respectively</i>
<b>3.1.2.4.4. Adsorption isotherms of phenol adsorption process onto </b>
<b>10CO-SBA-15-1h </b>
Calculating from the linearized Langmuir equation obtained the
following values qm = 61,73 (mg/g), KL = 0,0034 and the coefficient
correlation r = 0,9974. For Freundlich model KF = 0,74, 1/n = 0,7886
and a coefficient correlation r = 0,9976. Both models therefore
describe well phenol adsorption process onto 10CO-SBA-15-1h at
298K.
These results indicated that we had successfully synthesized
modifying-SBA-15 materials which can use for adsorption of organic
compounds in water. The selected adsorbates were 3 typical organic
compounds, methylene blue (MB, cationic), alizarin red s (ARS,
anionic) and phenol (neutral). Adsorption data shows that absorption
center and affinity to adsorbates play an important role in
determining the adsorption capacity. This is a scientific basis for
designing a desirable material for a specific adsorbate.
</div>
<span class='text_page_counter'>(43)</span><div class='page_container' data-page=43>
Langmuir and Frendlich isotherm models were used for the
adsorption studies in this thesis. All of three cases fitted with both
models. Langmuir model often fit with the chemical adsorption,
especially chemical adsorption toward substances in solution onto
solid surface. Thus, those three adsorption cases may be the chemical
adsorptions and the bonding force is the chemical interaction.
<b>3.2. Synthesis of photocatalytic materials and catalytic </b>
<b>properties </b>
<b>3.2.1. Synthesis of kN-nZnO/SBA-15 and investigation of </b>
<b>catalytic properties</b>
<b>3.2.1.1. Synthesis of nZnO/SBA-15 </b>
</div>
<span class='text_page_counter'>(44)</span><div class='page_container' data-page=44>
This was further evidenced by IR spectra (Fig. 3.46), N2
adsorption–desorption isotherms (Fig. 3.48) and TEM images (Fig.
3.49). In particular, on the IR spectra, the peak at 960 cm-1
corresponding to the vibrational modes of Si–OH actually decreases
with ZnO content. This change may be due to the interaction between
metal oxide and Si–OH group on SBA-15.
<b>3.2.1.2. Synthesis kN-30ZnO/SBA-15 materials </b>
</div>
<span class='text_page_counter'>(45)</span><div class='page_container' data-page=45>
The X-ray diffraction patterns (Fig. 3.51, Fig. 3.52), TEM image
(Fig. 3.53) and SEM image (Fig. 3.54) show that ordered hexagonal
mesostructure of pure SBA-15 still maintains in 3N–30ZnO/SBA-15
and ZnO was dispersed in nano scale on SBA-15 surface.
</div>
<span class='text_page_counter'>(46)</span><div class='page_container' data-page=46>
Successful doping of ZnO on SBA-15 with nitrogen was
demonstrated by appearing two IR peaks at 1340cm-1<sub> and 1500 cm</sub>-1
in the curve b of Fig. 3.57 for 3N–30ZnO–SBA-15, which may
correspond to the vibration of Zn–N bonds and the UV-vis peak at
around 370 nm, and it extends out to approximately 600–700 nm
(Fig. 3.57). The band gap values of kN-30ZnO/SBA-15 decreased
with the number of urea treatments. The band gap values of 2.96 eV,
2.88 eV và 2.83 eV correspond to k = 1, 2 and 3, respectively
(Fig.3.59).
</div>
<span class='text_page_counter'>(47)</span><div class='page_container' data-page=47>
the strong peak at 398.5 eV may be assigned to the anionic N in the
O–Zn–N.
All of these characterizations proved the successfully doping N on
3N-30ZnO/SBA-15.
<b>3.2.1.3. Photocatalytic ability of 3N-30ZnO/SBA-15 </b>
Fig. 3.64 shows that 3N-30ZnO/SBA-15 material presents the
higher photocatalytic activity for MB than for MO.
</div>
<span class='text_page_counter'>(48)</span><div class='page_container' data-page=48>
The kinetics of the MB photodegradation reaction obeyed the
Langmuir–Hinshelwood model. The coefficient correlation (r) and
the apparent kinetic constant decreased with increasing initial
concentrations.
In conclusion, visible-light-sensitive nitrogen-doped
ZnO–SBA-15 materials were synthesized. The phototcatalytic activity of the
nitrogen-doped ZnO–SBA-15 materials under visible light was
actually improved compared to the material in bulk form (3N-ZnO).
The MB photodegradation process obeyed the Langmuir–
Hinshelwood model.
<b>3.2.2. Synthesis of nTiO2-CdS/SBA-15 and investigation of </b>
<b>catalytic properties </b>
<b>3.2.2.1. Synthesis of nTiO2-CdS/SBA-15 </b>
</div>
<span class='text_page_counter'>(49)</span><div class='page_container' data-page=49>
In the IR spectra (Fig. 3.71), intensity of the peak at 475 cm-1
tends to increase with increasing TiO2 content. It may be assigned to
TiO2 in nTiO2-CdS/SBA-15 because the vibration of Ti-O-Ti groups
is around 400-600 cm-1<sub>. </sub>
The presence of Ti and Cd was also evidenced by XPS (Fig.
3.75 and 3.76), in which the peaks at 464.3 and 458.6 eV can be
attributed to Ti4+<sub> 2p</sub>
1/2 and Ti4+ 2p3/2 states of TiO2, and the peaks at
411.8 and 405.0 eV are assigned to Cd2+ <sub>3d</sub>
</div>
<span class='text_page_counter'>(50)</span><div class='page_container' data-page=50>
UV-VIS DRS spectra (Fig. 3.78) show that there are two
absorption peaks for each sample. The first one is at 300 nm and
tends to extend to longer wavelengths with increasing TiO2 content,
the second one is at 480 nm and decreases in intensity with
increasing TiO2 content. From the results of UV-vis, the band gap
values were calculated by Kubelka-Munk function to be 2.4 eV and
3.45 eV for 20TiO2
-CdS/SBA-15, which are assigned to CdS and
TiO2 in materials.
<b>3.2.2.2. Photocatalytic activity of nTiO2-CdS/SBA-15 </b>
<b>3.2.2.2.1. Photocatalytic activity of nTiO2-CdS/SBA-15 for MO </b>
<b>degradation </b>
</div>
<span class='text_page_counter'>(51)</span><div class='page_container' data-page=51>
that the material with 40% TiO2 presents a stronger photocatalytic
activity compared to the materials with 20%, 30% and 50% of TiO2.
Photocatalytic ability of TiO2-SBA-15 under visible light
was trivial, while both CdS/SBA-15 and 40TiO2-CdS/SBA-15 act as
a good photocatalyst for degradation of MO under visible light (Fig
3.84). However, 40TiO2-CdS/SBA-15 exhibits the higher
photocatalytic ability compared to the other.
The catalytic stable degree of 40TiO2-CdS/SBA-15 was
investigated, indicating that 40TiO2-CdS/SBA-15 possesses a high
catalytic stable degree.
<b>Conclusions </b>
</div>
<span class='text_page_counter'>(52)</span><div class='page_container' data-page=52>
2. Carbonyl-functionalized mesoporous silicas were synthesized
by co-condensation of tetraethoxysilane and varying contents
of 3-(trimethoxysilyl)propylmethacrylate in acidic medium
with the block copolymer Pluronic 123 as a structure directing
agent. The influence of some factors such as prehydrolysis
time of tetraethoxysilane and the molar ratio
MPS/MPS+TEOS has been investigated. The functionalized
materials were characterized by PXRD, TEM, SEM, IR, and
N2 adsorption–desorption at 77 K. The results show that the
suitable prehydrolysis time is 1 hour. The increasing content
of MPS in the initial mixture leads to a reduction in the
textural, surface area and pore diameter but enhancing the
wall thickness of the materials.
</div>
<span class='text_page_counter'>(53)</span><div class='page_container' data-page=53>
pH range of 3.19 – 7.2), while an increase in pH decreased the
adsorption of Alizarin Red S onto 2.7Fe2O3-SBA-15 and
phenol onto 10CO-SBA-15. Therefore, it can be stated that
there is a tight correlation between surface properties of
materials and properties of adsorbed materials to the
adsorption capacity of the materials. By modifying the surface
of SBA-15 with Fe2O3 and CO groups, we significantly
enhanced the adsorption capacity for anionic dye (ARS) and
neutral organic molecules (phenol) of the material.
4. kN-30ZnO/SBA-15 materials were successfully synthesized
by doping nitrogen with the assistance of urea. The
phototcatalytic activity of the nitrogen-doped ZnO–SBA-15
materials for the degradation of methylene blue in aqueous
solution was markedly higher than that of nitrogen doped
ZnO and ZnO/SBA-15. The kinetics of the reaction obeyed
the Langmuir–Hinshelwood model.
</div>
<!--links-->