Pro SQL Server 2008 Analysis Services- P8
Bạn đang xem bản rút gọn của tài liệu. Xem và tải ngay bản đầy đủ của tài liệu tại đây (1.71 MB, 50 trang )
CHAPTER 12 POWERPIVOT
331
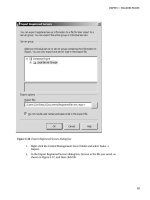
Figure 12-22. Connecting to PowerPivot with SSMS
Summary
Those are the fundamental areas of change in SQL Server Analysis Services 2008 R2. Of course, three
little terms—Master Data Services, Excel writeback, and PowerPivot—each create whole new areas of
discovery in their own rights. This interim release has given us the tools to manage our corporate data,
bringing us one step closer to “one version of the truth.” It’s given end users the ability to perform what-
if scenarios with the multidimensional models that we deliver via Analysis Services, and we can
empower end users to build their own cubes and publish them for reuse around the enterprise.
In Chapter 13, let’s take a look at how we’re going to keep all of this stuff running. We’ll look at
Analysis Services administration, and we’ll talk about how to manage an Analysis Services environment.
Please purchase PDF Split-Merge on www.verypdf.com to remove this watermark.
Please purchase PDF Split-Merge on www.verypdf.com to remove this watermark.
C H A P T E R 13
333
Administration
This chapter covers the DBA side of Analysis Services. We’ll start with processing cubes, and what
happens when you process an SSAS cube. We’ll look at Analysis Services security, and finally end with
some coverage of aspects of SSAS performance management, how to design for performance, and
considerations for scalability.
DBA Tasks
After you build a cube—create the dimensions, map them to measures, create your attributes and
hierarchies—none of it actually does anything until you deploy and process the cube. Deploying is
effectively “saving the files to the server,” but let’s take an in-depth look at what happens when we
process objects in an Analysis Services solution.
Processing a Cube
You can process various objects in SSAS: databases, cubes, dimensions, measure groups, partitions, data
mining models, and data mining structures. When you process an object, all the child objects are
reviewed for processing. If they are in an unprocessed state, they are then processed as well.
To process the Adventure Works cube, select Process… from the Adventure Works.cube context
menu, or click Process in the cube designer toolbar. This will display the Process Cube dialog, as shown
in Figure 13-1.
Please purchase PDF Split-Merge on www.verypdf.com to remove this watermark.
CHAPTER 13 ADMINISTRATION
334
Figure 13-1. The Processing dialog
How the cube will be processed depends on the processing option selected. You have the following
options available via the Process Options drop-down list:
Process Full: Processes the object and all its children. If an object has already been processed, then
SSAS drops the data and processes it again. This is necessary if there’s been a structural change that
invalidates the existing aggregations.
Process Default: Detects the status of the object and its children, and processes them if necessary.
Process Incremental: (Measure groups and partitions only) Adds new fact data.
Process Update: (Dimensions only) Forces a re-read of data to update dimension attributes. Good
for when you add members to a dimension.
Process Index: (Cubes, dimensions, measure groups, and partitions only) Creates and rebuilds
aggregations and indexes for affected objects. Can be run only on processed objects; otherwise
throws an error.
Please purchase PDF Split-Merge on www.verypdf.com to remove this watermark.
CHAPTER 13 ADMINISTRATION
335
Process Data: (Cubes, dimensions, measure groups, and partitions only) Drops all data in the cube
and reloads it. Will not rebuild aggregations or indexes.
Unprocess: Drops the data in the objects.
Process Structure: (Cubes and Mining structures only) Processes dimensions and cube definitions.
Won’t load data or create aggregations.
Process Clear Structure: (Mining structures only) Removes all training data.
Processing Options
Clicking the Change Settings button will open the Change Settings dialog, which has two tabs, Processing
options and Dimension key errors. In this section I’ll focus on the Processing options tab, which is
shown in Figure 13-2.
Figure 13-2. The processing settings dialog
Under Processing options you can select whether to process the objects in parallel or sequentially.
Parallel processing splits a task and allows jobs to run in parallel. However, during parallel processing,
objects will be taken offline as they’re processed. The result is that the cubes will be unavailable during
most of the processing process. Parallel processing is wrapped in a single transaction, so if the
processing fails, all the changes are rolled back.
Sequential processing has two options: One Transaction or Separate Transactions. When
processing an SSAS job as a single transaction, the entire task is wrapped in a transaction—if there’s an
Please purchase PDF Split-Merge on www.verypdf.com to remove this watermark.
CHAPTER 13 ADMINISTRATION
336
error at any time during processing, the whole thing is rolled back. The major benefit is that the cube
stays available to users until the transaction is committed, at which point the whole update is slammed
in place at once.
If you process a task as separate transactions, each job is wrapped in its own transaction, and each is
committed as they’re completed. The benefit here is that if you have a large, complex processing task, it
can be painful to have the whole thing roll back because of one bad piece of data. Processing a series of
jobs sequentially as separate transactions means everything up to the error will be kept—only the
current job will roll back.
Writeback tables are also something you can configure from the Processing options tab. Writeback
tables are relational tables created when you enable writeback on a partition. Certain changes to cube
structure can invalidate the writeback tables if they no longer map to the cube structure. The Writeback
Table Option indicates what processing should do with existing writeback tables.
Use Existing: Will use an existing writeback table, but will have no effect if there isn’t one.
Create: Creates a writeback table if there isn’t one. If there is one, this option will cause the process
to fail.
Create Always: This option indicates that the processing task should create a new writeback table,
and overwrite the table if it already exists.
Finally, Process Affected Objects will process objects that have a dependency on objects being
processed. For example, if you process a dimension and select this option, the cubes that depend on that
dimension will also be processed.
So let’s take a look at the mechanics of processing an object in Analysis Services, which I feel helps
reinforce the understanding of what’s going on behind the curtain.
Processing Architecture
When Analysis Services processes a cube, the end result is a number of binary hash files on disk for the
dimensions, attributes, and aggregates generated to optimize response time for dimensional queries.
How do we get from a collection of .xml files that define the cube to the processed hashed binary files
that are the cube?
When you issue a process command, the Analysis Server analyzes the command, and evaluates the
objects affected and their dependencies. From that the processing engine will build a list of jobs to be
executed and their dependencies. The jobs are then processed by a job execution engine, which
performs the tasks necessary to build the file structures for the cube. Jobs without dependencies on each
other can be executed in parallel. The server property CoordinatorExecutionMode controls how many
jobs can run in parallel at once.
A dimension-processing job will create jobs to build the attribute stores, creating the relationship
store, name, and key stores. The Attribute job will then build the hierarchy stores, and, at the same time,
the decoding stores, followed by bitmap indexes on the decoding stores. As the attribute-store
processing job is the first step, it’s the bottleneck in processing; this is why having a well-structured
attribute relationship is so important.
The decoding stores are how the storage engine retrieves data for the attributes in a hierarchy. For
example, to find the part number, price, and picture of a specific bicycle, the storage engine fetches
them from the decoding stores. The bitmap indexes are used to find the attribute data in the relationship
store. The processing engine can spend a lot of time building the bitmap indexes while processing,
especially in dimensions with a large number of members. If a collection of attributes is unique, the
processing engine may spend more time building bitmap indexes than they’re worth.
Please purchase PDF Split-Merge on www.verypdf.com to remove this watermark.
CHAPTER 13 ADMINISTRATION
337
A cube-processing job will create child jobs for measure groups, and measure-group jobs will create
child jobs for partitions. Finally, partition jobs will create child jobs to process fact data and build the
aggregations and bitmap indexes. To process the fact data, the job-execution engine queries the data
sources from the data-source view to retrieve the relational data. Then it determines the appropriate
keys from the dimension stores for each relational record and populates them in the processing buffer.
Finally, the processing buffer is written out to disk.
Once the fact data is in place, then jobs are launched to build the aggregations and bitmap indexes.
They scan the fact data in the cube matrix, then create the bitmap indexes in memory, writing them out
to disk segment by segment. Finally, using the bitmap indexes and the fact data, the job engine will build
the aggregations and aggregation indexes in memory, writing them out to disk when they’re complete.
Profiler
Your first tool in evaluating the processing of a cube is the SQL Server Profiler. Profiler is an application
that allows you to log all events being performed on or by a SQL Server service. In the case of Analysis
Services, we want to run a trace on SSAS while performing an action of interest (in this case, processing a
cube.) Figure 13-3 shows part of a trace from a cube-processing job. From the Profiler trace, you can
identify the start time and completion time of various tasks, and from there figure out how long various
tasks are taking, and, more importantly, where most of the time is being spent processing.
Figure 13-3. Profiler trace from Analysis Services while processing a cube
Another use for Profiler is to watch the relational store while processing. While Analysis Services is
building cubes and dimensions, any data it needs from SQL Server it retrieves via query. You can watch
these queries via a Profiler trace on the relational store and again identify where the bottlenecks are. The
SQL used for the queries is reported there, and you can run Query Analyzer on the queries to ensure
they’re as efficient as possible.
Performance Monitor
Windows Performance Monitor (found in Administrative Tools on the Start Menu) is a tool that provides
resources for analyzing system performance. Figure 13-4 shows an analysis in progress. You can analyze
operating systems, server software, and hardware performance in real time, collect data in logs, create
Please purchase PDF Split-Merge on www.verypdf.com to remove this watermark.
CHAPTER 13 ADMINISTRATION
338
reports, set alerts, and view past data. The metrics tracked by Performance Monitor are performance
counters. Windows comes with hundreds of counters built in (for disk performance, CPU, memory,
caching, and so on). Third-party software, as well as other software from Microsoft, can install additional
performance counters.
Figure 13-4. Windows Server 2008 R2 Performance Monitor
When you install Analysis Services, it adds a number of new counter groups:
• MSAS 2008: Connection
• MSAS 2008: Data Mining Model Processing
• MSAS 2008: Data Mining Prediction
• MSAS 2008: Locks
• MSAS 2008: MDX
• MSAS 2008: Memory
• MSAS 2008: Proactive Caching
Please purchase PDF Split-Merge on www.verypdf.com to remove this watermark.
CHAPTER 13 ADMINISTRATION
339
• MSAS 2008: Proc Aggregations
• MSAS 2008: Proc Indexes
• MSAS 2008: Processing
• MSAS 2008: Storage Engine Query
• MSAS 2008: Threads
■
Note As of this writing (Nov CTP), the counters for SQL Server 2008 R2 are still labeled “MSAS 2008.”
Each of the counter groups will have a number of counters subordinate to them. For example, MSAS
2008:Processing has six counters for reading, writing, and converting rows of data. By tracking certain
performance counters you can evaluate the performance of your Analysis Services server. If you’re
getting complaints of bogged-down performance that you can’t pin down, you can run the performance
counters to a log file for review later. For more information about the Windows Performance Monitor,
check out the TechNet article at
Automation
Once you have an Analysis Services database in production, you will need to process the cube
periodically to refresh it. Remember that only ROLAP partitions and dimensions will dynamically show
changes in the underlying data, so if we expect the data in the data sources to change, the cube will have
to be processed to reflect the changes.
For active partitions, you will have to decide on a processing schedule depending on the business
requirements. For example, cubes that are used for strategic analysis may need to be processed only
once a week, as the focus is on the previous year at the quarterly level. On the other hand, a project
manager may want analytic data to be no more than 24 hours old, as it provides data for her project
dashboard, which she relies on heavily on a daily basis. Finally, archive partitions for previous years may
be able to sit untouched for long periods of time, being proactively reprocessed should the underlying
data change.
In any event, all these requirements indicate a need for automated processing. The good news is
that there is a lot of flexibility in the processing of SSAS objects. Essentially, there are two ways to initiate
the process: either via an XMLA query, or by calling the AMO object model. However, we have a number
of ways to accomplish those two tasks.
■
Note The user context that attempts to process an SSAS object must have the permission to do so. I strongly
recommend using Windows Security Groups to manage user permissions—see the section on Security later in this
chapter.
Please purchase PDF Split-Merge on www.verypdf.com to remove this watermark.
CHAPTER 13 ADMINISTRATION
340
XML for Analysis
You can process Analysis Services objects with XML for Analysis (XMLA) queries. This means that
essentially any tool that can connect to SSAS and issue a query can process objects, if that connection
has the appropriate privileges. One great benefit is that if you want a cube or database processed a
certain way, you can create the script and store it separately, then use the same script to process the
object(s) manually, through code, via tools, and so on.
A basic example is shown here, but the processing options in XMLA are full-featured enough to
duplicate anything you can do through the BIDS UI.
<Process xmlns="
<Object>
<DatabaseID>Adventure Works DW</DatabaseID>
<CubeID>Adventure Works</CubeID>
</Object>
<Type>ProcessFull</Type>
<WriteBackTableCreation>UseExisting</WriteBackTableCreation>
</Process>
You can fire off multiple tasks in parallel by using the <Batch> XMLA command. SSAS will attempt to
execute as many multiple statements within a <Batch> command in parallel as possible, and, of course,
execution will hold at the end of the <Batch> command until all subordinate commands are completed.
For more information about processing SSAS objects with XMLA queries, check the TechNet article
at
Analysis Management Objects
Analysis Management Objects (AMO) are the members of the Microsoft.AnalysisServices class library
that provide for the automation of Analysis Services. Working with Analysis Services objects via AMO is
very straightforward. (I’ll cut to the chase—the code to process a cube is
Cube.Process(ProcessType.ProcessFull)—startling, isn’t it?) The upside to using AMO is that it’s very
intuitive, and the .NET code can make it easy to perform some pretty arcane tasks.
For example, consider a complex Analysis Services database that has various dependencies, and you
want to enable your users to request a cube to be reprocessed. For a given cube, there are various
dimensions that need to be reprocessed, depending on when it was last processed and the age of the
data. Now if the structure of what needs to be processed in which order is static, similar to what’s shown
in Figure 13-5, then creating the process job in XMLA makes sense—structure the query once, and store
it.
Please purchase PDF Split-Merge on www.verypdf.com to remove this watermark.
CHAPTER 13 ADMINISTRATION
341
Figure 13-5. Simple execution of a batch process
When you have a complex cube structure, you may want to create specific dependencies (if you
process x dimension, then process y cube). You may also want to verify partition structures, data
freshness, or even compare the last processing data against the age of the data to determine if you need
to reprocess an object. So you may end up with a process similar to that in the flow chart shown in
Figure 13-6. In this case, it may make more sense to craft the reprocessing logic in code. It’s going to be
easier to trace the flow through code, and it will be easier to instrument and debug.
Please purchase PDF Split-Merge on www.verypdf.com to remove this watermark.
CHAPTER 13 ADMINISTRATION
342
Figure 13-6. A notional complex logic flow for processing a database
The code is very straightforward:
Please purchase PDF Split-Merge on www.verypdf.com to remove this watermark.
CHAPTER 13 ADMINISTRATION
343
Server server;
Database db=new Database();
//connect to analysis server
server = new Server();
server.Connect(@"data source=<server name>");
db = server.Databases["<database name>"];
foreach(Cube cube in db.Cubes)
{
//Processes cube and child objects
cube.Process(ProcessType.ProcessFull);
}
Remember that cubes own measure groups; dimensions are owned by the database.
PowerShell
A common problem when dealing with automation is the need for a framework to run the code in. Very
often you may find the easiest way to tackle an administrative task is with code, but you end up taking
the time to create a small application to run the code. And next time you need to run the code, you don’t
have the application handy, so you have to do it again.
In the Unix world, this is rarely a problem—since everything is command-line interface, then any
administrative task can usually be performed by writing a script. Windows administrators didn’t really
have this option for a long time—there wasn’t anything between 1980s-era batch files and modern
fourth generation code. That is, until Microsoft created PowerShell.
PowerShell is a Windows component introduced a few years ago to enable scripting for enterprise
applications. It works very similar to scripting shells in Unix, with the exception that instead of piping
text from one process to another, PowerShell enables passing actual objects from one to the next. It’s
available as a download for Windows XP, Vista, and Server 2003, and is an installable component with
Windows 7 and Server 2008 and 2008R2.
Since PowerShell can leverage .NET assemblies, the code in PowerShell will be similar to the .NET
code in the previous section. The benefit here is that you can write and execute that code against an
Analysis Services server without having to build a harness or application for it. You can learn more about
PowerShell at
Scheduling
Now that we have a solid collection of ways to automate processing of Analysis Services objects, we need
a way to kick it off. Perhaps we need to trigger the processing on a regular schedule, or we want to call it
when we load data into the data mart. Alternatively, it’s possible that we don’t have control over the
data-loading process, and need to trigger processing when data in a warehouse changes.
We’re going to take a look at SQL Server Agent, a process that runs in SQL Server and can be used to
schedule cube processing. We’ll also take a look at SQL Server Integration Services—the primary use of
SSIS is to extract, transform, and load (ETL) data; it’s often used to load data warehouses from
production systems. Since SSIS is doing the loading, it can also trigger or schedule the processing of the
affected objects in Analysis Services.
Please purchase PDF Split-Merge on www.verypdf.com to remove this watermark.
CHAPTER 13 ADMINISTRATION
344
SQL Server Agent
SQL Server Agent is a component of SQL Server, and runs as a Windows Service. You can configure SQL
Server Agent either through T-SQL or via SQL Server Management Studio, as shown in Figure 13-7.
Figure 13-7. Managing SQL Server Agent through SSMS
Each job can contain a number of steps, as shown in Figure 13-8, and for each step you can indicate
what action to take depending on whether the job step exits reporting success or failure (exit the job,
reporting success or failure, or continue on to the next step). Each step can also write to an output file,
log results to a table, or place its results in the job history. You can also set the user context for each
specific job step.
Please purchase PDF Split-Merge on www.verypdf.com to remove this watermark.
CHAPTER 13 ADMINISTRATION
345
Figure 13-8. Creating a job for the SQL Server Agent
Job steps can be a number of things, each option having its own options for execution. While there
are twelve different types of job steps, the ones we’re interested in are PowerShell, SQL Server Analysis
Services Command, and SQL Server Analysis Services Query. As you can see from the methods we’ve
covered previously, these options allow us to schedule Analysis Services processing jobs by calling a
PowerShell script, running an XMLA query, or using the Analysis Services command directly.
Once we have the processing job set up the way we want, then we can select or build a schedule, and
set up the alerts and notifications we want to execute when the job finishes.
SQL Server Integration Services
While the SQL Server Agent is the best way to schedule a recurring action you want to perform on
Analysis Services, if you need actions executed as part of a process, your best bet is SQL Server
Integration Services (SSIS). There’s a good chance that in an Analysis Services BI solution, you’ll be using
SSIS to move data into your data mart or data warehouse. The nice thing is that while using SSIS to move
Please purchase PDF Split-Merge on www.verypdf.com to remove this watermark.
CHAPTER 13 ADMINISTRATION
346
data (which means you’ll need to reprocess the cubes and/or dimensions at some point), you can also
trigger the reprocessing directly.
SSIS uses a drag-and-drop designer for data-oriented workflows, as shown in Figure 13-9. For an
ETL type job, the central point of the workflow will be the Data Flow Task, which contains logic for
moving and transforming data. However, in the Control Flow, there is a task for processing Analysis
Services objects.
Figure 13-9. SQL Server Integration Services designer in BIDS
You can make paths conditional, so as we’ve discussed, you may want to process cubes only when
the underlying data has changed. You can also have different exit paths based on success or failure of the
previous component. This is beneficial if a data load job fails—you don’t want to waste downtime either
processing a cube on unchanged data, or, worse, processing a cube on bad data.
Configuration of the Analysis Services task is very straightforward. First you need to create a
connection to the Analysis Server, either by right-clicking in the connection manager pane and selecting
New Analysis Services Connection or by opening the properties pane of the Analysis Services Processing
Task and clicking New next to the connection manager selection drop-down list, as shown in Figure
13-10.
Please purchase PDF Split-Merge on www.verypdf.com to remove this watermark.
CHAPTER 13 ADMINISTRATION
347
Figure 13-10. Selecting a connection to Analysis Services
The processing settings themselves reflect the settings dialog we’re familiar with, as shown in Figure
13-11. Once you select the connection manager, then you will be able to add objects from the database
selected in the connection manager. You can select cubes, measure groups, partitions, dimensions, or
mining models. Once the selections are listed in the dialog, you can change the processing settings for
each object individually.
Figure 13-11. Processing settings in SSIS
The green arrow from the bottom of the task leads to the next task you want completed. You can
have multiple arrows leading to multiple tasks, and the arrows can be configured to be conditional based
on the success or failure of the task, or more intricately based on an expression, which may depend on
variables defined in the Integration Services package.
If you’re interested in learning more about Integration Services, I highly recommend the Integration
Services tutorials online at You can also read
Please purchase PDF Split-Merge on www.verypdf.com to remove this watermark.
CHAPTER 13 ADMINISTRATION
348
more about SSIS in SQL Server 2008 Integration Services Unleashed (Sams, February 2009) by Kirk
Haselden, one of the SSIS architects at Microsoft.
■
Note There are no significant changes in Integration Services for 2008R2.
A few times I’ve referred to security and permissions with respect to working with Analysis Services.
Due to the sensitive nature of both the information contained in SSAS cubes and the data that underlies
them, implementing security properly is of paramount importance. Let’s take a look at some aspects of
security in SSIS.
Security
The first, most important idea (and this shouldn’t be news) is that security is neither a feature you just
add on, nor something you worry about only with Analysis Services. Security should be a system-wide
philosophy. However, having said that, I’ll cover a couple of key security concepts regarding Analysis
Services.
We’ll look at authentication vs. authorization—the difference between “who gets in?” and “what
they are allowed to do.” We’ll look at SSAS roles and how to use them to permit access to SSAS objects
and actions. Finally, we’ll look at the impacts of using security to restrict access to specific parts of the
cube, down to the dimension member and measure cell level.
AUTHENTICATION VS. AUTHORIZATION
Security in Analysis Services, like any enterprise application, is a two-step process, consisting of
authentication, then authorization. Authentication is about verifying that someone is allowed into the
server—something of a “who goes there?” Authorization happens once someone is authenticated into the
server—“now that you’re here, what are you allowed to do?”
Authentication
Analysis Services recognizes only Windows Integrated Authentication, also known as Active Directory
security. As of SQL Server 2008 R2, there is no other authentication method available. With respect to
connecting from the Internet, this can be problematic, as generally your firewalls won’t have the
necessary ports open for NT authentication. In this case you can configure SSAS for HTTP access, which
uses an ISAPI filter to connect to SSAS from IIS on the web server.
■
Note If you use HTTP access, and want to leverage the user credentials for authorization, you could run into
the double-hop problem, since users will authenticate against the IIS server, and the IIS server must forward the
user credentials to the SSAS server. For more information about the double-hop problem, see
/>.
Please purchase PDF Split-Merge on www.verypdf.com to remove this watermark.
CHAPTER 13 ADMINISTRATION
349
HTTP access can be performed with any authentication mode on IIS—NTLM, Basic
(username/password), or even anonymously (using the IIS application pool account to authenticate into
SSAS). The general architecture and authentication flow will look like Figure 13-12. A great article
regarding setting up HTTP access for SQL Server 2008 Analysis Services on Windows Server 2008 can be
found at />sql-server-2008-analysis-services-on-microsoft-windows-server-2008.aspx.
Figure 13-12. User authenticating against Web application
However, don’t be in a rush to expose SSAS to the Internet in this manner—remember that you are
exposing a bare XMLA query interface (so the Internet user can use Excel or another Analysis tool). If, on
the other hand, you will be delivering only analytic data to Internet users via an application (Reporting
Services, Excel Services, PerformancePoint, etc.), then you need to provide only for that application’s
authentication of Internet users, then handle authentication of the application against Analysis Services.
(Again, if you choose to pass through user credentials, be mindful of the double-hop problem.)
Authorization
Once we’ve authenticated against an Analysis Services server, then we have to do something. What we’re
allowed to do depends on what Authorization our user is granted. Within SSAS, authorization is handled
via role-based security—roles are objects in Analysis Services that are containers for the permissions that
users authenticated into the server will receive.
Roles are defined near the bottom of the tree in the Solution Explorer pane—if you right-click on the
Roles folder, you can create a new role. New roles default to not having any permissions. When you
create a new role, you’ll see the General tab for the role, as shown in Figure 13-13.
Please purchase PDF Split-Merge on www.verypdf.com to remove this watermark.
CHAPTER 13 ADMINISTRATION
350
Figure 13-13. The General tab for a newly created role
The Role name: in this tab is not directly editable. To change the name of the role, you use the Name
input area in the Properties pane. The Role description: is a free-text description that allows you to
annotate the intent behind the role. Then you have three checkboxes—Full Control (Administrator),
Process database, and Read definition. These are fairly self-explanatory. You will want to create an
Administrator role early on and get used to using that for administrators. By default SSAS creates a
Server role behind the scenes—this role has administrator privileges, and has the members of the local
administrators group as members. If you want to remove the local administrators from this role, you’ll
have to go into Management Studio and connect to the Analysis Server. Then right-click on the server
itself and select Properties to open the server properties dialog.
At the bottom of the dialog is a checkbox for “Show Advanced (All) Properties.” Check this to show a
security property titled “Security \ BuiltinAdminsAreServerAdmins.” If you change the value of this to
“false” then built-in admins will no longer have access to the server. You can explicitly add users to the
Server role on the Security tab of the Server Properties dialog.
■
Caution You can lock yourself out of the server if you disable the local admins from the Server role without
explicitly adding users in the Security tab.
The Membership tab is pretty self-explanatory—you can add Windows users or security groups
here. The Data Sources tab controls access to the data sources in the UDM for the database. The Access
property allows users to read data from the data source directly—this is used mostly in actions or drilling
through to underlying data. The Read Definition checkbox will allow a role to read the definition
(including the connection string and any embedded passwords!) for a data source.
The Cubes tab lists the cubes in the database and the associated access rights. Access is None for no
access, and Read to allow members of the role to read the cube (which translates to “the dimensions and
measure groups that belong to the cube”). Read/Write enables reading, but also writeback for the cube.
The Local Cube/Drillthrough Access option for a cube allows the role to drill-through to underlying
data for a cube, while a local cube allows members of the role to pull a subset of data from the cube to
Please purchase PDF Split-Merge on www.verypdf.com to remove this watermark.