GROWTH AND DEVELOPMENT REPORT BÁO CÁO TÁC ĐỘNG CỦA FDI ĐẾN NỀN KINH TẾ VIỆT NAM
Bạn đang xem bản rút gọn của tài liệu. Xem và tải ngay bản đầy đủ của tài liệu tại đây (1018.22 KB, 65 trang )
FOREIGN TRADE UNIVERSITY
GROWTH AND DEVELOPMENT MID-TERM REPORT
IMPACTS OF FDI ON VIETNAM’S ECONOMY
GROUP 02
Hồng Ngọc Anh - 1814450010
Phạm Ngơ Quỳnh Giao – 1814450028
Nguyễn Quang Huy – 1814450043
Nguyễn Trọng Nhân - 1814450059
Class: KTEE410(1.2/2021).1
Instructor: Mr. Pham Xuan Truong
Hanoi, 03/2021
TABLE OF CONTENTS
INTRODUCTION .............................................................................................................. 4
CHAPTER 1. THEORETICAL BACKGROUND ......................................................... 6
1.1. Definition of FDI ...................................................................................................... 6
1.1.1. Concept ................................................................................................................... 6
1.1.2. Characteristics of FDI ....................................................................................... 6
1.1.3. Driving forces of FDI ........................................................................................ 6
1.2. FDI classification ..................................................................................................... 8
1.2.1. Horizontal FDI .................................................................................................. 8
1.2.2. Platform FDI ..................................................................................................... 9
1.2.3. Vertical FDI ....................................................................................................... 9
1.3. General impact of FDI on economy ........................................................................ 9
1.3.1. Impacts on financial market ............................................................................. 9
1.3.2. Impacts on economic growth ............................................................................ 9
1.3.3. Impacts on labour force .................................................................................. 11
1.3.4. Impacts on technology ..................................................................................... 11
CHAPTER 2. PRACTICAL SITUATION IN VIETNAM AND IMPACTS OF FDI
ON VIETNAM’S ECONOMY ........................................................................................ 13
2.1 Practical situation in Vietnam ................................................................................ 13
2.1.1. FDI situation from 2000 to 2007 .................................................................... 13
2.1.2. FDI situation from 2008 to 2019 .................................................................... 16
2.1.3. FDI situation in 2020 ...................................................................................... 23
2.2. Impacts of FDI on Vietnam’s economy in the period 2000 - 2020 ...................... 26
2.2.1. Impacts on Financial Market ......................................................................... 26
2.2.2. Impacts on Labor Force .................................................................................. 29
2.2.3. Impacts on Technology ................................................................................... 36
2.2.4. Impacts on Economic Growth ......................................................................... 39
CHAPTER 3. POLICY RECOMMENDATION .......................................................... 46
3.1. Opportunities and challenges for Vietnam attracting FDI .................................. 46
3.1.1. Opportunities ................................................................................................... 46
3.1.2. Challenges ........................................................................................................ 53
3.2. Policies in attracting FDI ....................................................................................... 58
2
3.3. Policies in utilizing FDI positive impacts .............................................................. 61
CONCLUSION ................................................................................................................. 63
REFERENCES ................................................................................................................. 65
3
INTRODUCTION
1. Rationality of the study
Economic development is always an urgent global requirement. Globalization connects
countries together more importantly, plays an important role in developing countries.
Financial flows, information, skills, technology, item goods and services between countries
are on the rise. Trade plays an important role in improving skills through imports and
advanced technology. Export businesses are motivated to apply technology to deal with
competition fierce (Frankel and Romer, 1999). Trade liberalization reduces the cost of
international transactions and necessary early direct foreign investment. The liberalization
of capital flows already contribute to the expansion of foreign direct investment capital
flows. Because the production process is dispersed and moves across the board microglobal, the global value chain has become central to the world economy (Cattaneo et al.,
2010). FDI is one of the most dynamic elements in the stream international resources, it is
a package of tangible and intangible assets, image and catalyst for investment and capacity
in the country. FDI helps to supplement development investment capital (Brems. H., 1970),
Human Resource Development and Job Creation (Gregorio, Jose, 2003), market expansion
and export promotion import, speed up the process of economic restructuring.
2. Objectives of the essay
Like several other developing countries, Vietnam wants to boost the position of foreign
direct investment (FDI) in its growth by drawing more FDI. One of the cornerstones of
Vietnam's economic growth policy for nearly two decades, since the country's opening to
the world in 1986, has been to raise FDI. The Vietnamese government has built a friendly
atmosphere for foreign direct investment. The Vietnamese government has established an
attractive environment for FDI, including the passage of an FDI legislation in late 1987 and
several amended FDI laws based on investor feedback.
3. Object and scope of the essay
This research explores the effects of FDI on the Vietnamese economy using data from
2000 to 2021 in order to determine the importance of FDI to the Vietnamese economy. The
results of this paper should be used to make suggestions to policymakers in order to enhance
4
their estimates of the impact of FDI on the country's growth. There are several studies
currently being conducted on the relationship between FDI and the economy. Between 1991
and 2009, Assiobo Komlan Mawugnon and Fang Qiang studied the causal association
between Foreign Direct Investment (FDI) and Economic Development in Togo. Hansen and
Rand (2004) argued that FDI has a long-term effect on GDP. However, little study has been
done in Vietnam on the relationship between FDI and the economy. This paper fills in the
gaps by looking at the effect of foreign direct investment on Vietnam's economy before and
after the COVID-19 pandemic.
4. Research methodology
By collecting, investigating and analyzing data of FDI into Vietnam and how Vietnam’s
economy has changed due to the presence of FDI, our group make comments on the impact
of FDI on Vietnam’s economy and have some recommendations.
5. Structure of essay
This paper includes 3 chapters:
Chapter 1: Theoretical background
Chapter 2: Practical situation in Vietnam
Chapter 3: Policy recommendation
5
CHAPTER 1. THEORETICAL BACKGROUND
1.1. Definition of FDI
1.1.1. Concept
A foreign direct investment (FDI) is an investment made by a firm or individual in one
country into business interests located in another country. Generally, FDI takes place when
an investor establishes foreign business operations or acquires foreign business assets in a
foreign company. However, FDIs are distinguished from portfolio investments in which an
investor merely purchases equities of foreign-based companies.
1.1.2. Characteristics of FDI
-
Investors must contribute a minimum amount of capital according to the regulations
of each country. Vietnam's Foreign Investment Law stipulates that foreign investors
must contribute at least 30% of the legal capital of a project.
-
The division of management over firms depends on the level of capital contribution.
If contributing 10% of the capital, the business is completely operated and managed
by a foreign investor.
-
The investors' profits depend on the results of their business operations and are
divided according to the proportion of capital contributions after paying taxes and
dividends.
-
FDI is done through building new businesses, acquiring all or part of existing
businesses or merging enterprises.
-
FDI is not only associated with capital movement, but also associated with
technology transfer, transfer of knowledge and management experience and creating
new markets for both the investor and the investee side.
-
FDI is now associated with international business activities of multinational
companies.
1.1.3. Driving forces of FDI
-
Differences in the marginal productivity of capital between countries
6
A capital surplus country usually has a lower marginal productivity. A country
that lacks capital tends to have a higher marginal productivity. This situation will
lead to a movement of capital from surplus to scarcity in order to maximize profits.
Because the production costs of capital surplus countries are often higher than in
capital shortage countries. However, this does not mean that all activities with high
marginal productivity can be invested and produced by enterprises, but also have
important and vital activities of enterprises, they still produce by themselves. even if
that activity is low marginal productivity.
-
Product cycle
For most firms engaged in international business, the life cycle of these products
consists of three main stages: new product phase; product maturity stage;
standardized product stage. Akamatsu Kaname (1962) thinks that new products,
initially invented and produced in the invested country, can then be exported to
foreign markets. In the importing country, the advantage of the new product
increases the demand on the local market, so the importing country switches to
production to replace this imported product by mainly relying on capital and
technology of the country. outside (product maturity stage). When market demand
for new products in the domestic market is saturated, export demand reappears
(product standardization stage). This phenomenon takes place cyclically and thus
leads to the formation of FDI.
-
The special advantage of multinational companies
Multinationals have unique advantages (eg basic competencies) that allow
companies to overcome cost constraints abroad, so they are willing to invest directly
abroad. When choosing a location to invest, multinationals will choose where the
conditions (labor, land, politics) allow them to take advantage of these particular
advantages. Multinational companies often have great advantages in capital and
technology to invest in countries with available raw materials, cheap labor costs and
often a potential consumer market.
-
Access to the market and reduce trade conflicts
7
Foreign direct investment is a way to avoid bilateral trade conflicts. For example,
Japan is often complained by the US and Western European countries because Japan
has a trade surplus and the other countries have trade deficits in the bilateral
relationship. In response, Japan has increased direct investment in those markets.
They manufacture and sell cars and computers in the US and Europe, in order to
reduce the export of these products from Japan. They also invest directly in third
countries, and from there export to North America and Europe.
-
Exploiting experts and technology
It is not that FDI is only going from a more developed country to a less developed
country. The opposite is even stronger. Japan is a country actively investing directly
in the US to exploit a contingent of experts in the US. For example, Japanese car
companies have opened vehicle design divisions in the US to employ American
professionals. The same goes for Japanese computer companies. Not only Japan
invests in the US, but also other industrialized countries have similar policies. China
has recently promoted direct investment abroad, including investment in the US. The
purchase of the laptop division of a multinational company with US nationality,
IBM, by the Chinese multinational company Lenovo, is seen as a strategy for Lenovo
to approach superior PC technology. Vietnamese IBM. Or the merger of TCL
(China) with Thompson (France) to become TCL-Thompson Electronics, the
acquisition of Unocal (China) in the oil exploitation industry by National Offshore
Oil Corporation (China) is also with the same strategy.
-
Access to natural resources
To source raw materials, many multinational companies seek to invest in countries
with rich resources. Japan's first wave of foreign direct investment in the 1950s was
for this purpose. China's FDI now has a similar purpose.
1.2. FDI classification
1.2.1. Horizontal FDI
8
A business expands its domestic operations to a foreign country. In this case, the
business conducts the same activities but in a foreign country. For example, McDonald’s
opening restaurants in Japan would be considered horizontal FDI.
1.2.2. Platform FDI
A business expands into a foreign country but the output from the foreign operations
is exported to a third country. This is also referred to as export-platform FDI. Platform FDI
commonly happens in low-cost locations inside free-trade areas. For example, if Ford
purchased manufacturing plants in Ireland with the primary purpose of exporting cars to
other countries in the EU.
1.2.3. Vertical FDI
A business expands into a foreign country by moving to a different level of the supply
chain. In other words, a firm conducts different activities abroad but these activities are
still related to the main business. Using the same example, McDonald’s could purchase a
large-scale farm in Canada to produce meat for their restaurants.
1.3. General impact of FDI on economy
1.3.1. Impacts on financial market
Increasing the amount of capital available in the local economy is one of the most direct
ways that FDI can contribute to economic growth. In developing countries, where capital is
usually scarce in relation to labor, policymakers often see potential capital infusion as the
most significant advantage of FDI because it boosts investment and GDP in the host
economy. As a result, FDI enables countries to replace capital generated by domestic
savings with capital from abroad. However, the extent to which foreign firm activity indeed
generates a net increase in capital depends on local financial conditions.
1.3.2. Impacts on economic growth
Foreign investment has helped to crack the embargo, extend foreign economic ties,
and promote Vietnam's membership in ASEAN, as demonstrated by the Framework
Agreement signed with the EU, the Trade Agreement signed with the US, the Investment
Security and Promotion Agreement signed with 62 countries/territories, and the Economic
9
Partnership Agreement (EPA) signed with Japan and other countries. With Vietnam's
new status and the needs of international investors met, waves of foreign investment
poured in. Vietnam has long been regarded as a desirable location for foreign investment.
However, despite the large number of foreign investments, there are still several issues to
be resolved. ODA is a notable foreign investment in Vietnam. This investment
management has been handled and used efficiently and properly of a new type of nonrefundable loan, as well as what remedy for existing inadequacies.
We start by analyzing the findings of Borensztein et al. (1998). They study the impact
of foreign direct investment on growth, based on data of 69 less developed economies
covering the period 1970-1998, and they reported that FDI promotes technology transfers
amongst countries. Also, Bengoa and Sanches-Robles (2003) report that FDI positively
affect growth for Latin American countries, by using a two-step approach. First, they test
the link between economic freedom and FDI inflow, after which they test for the link
between FDI inflow and growth. Also relating to the impact of FDI in Latin American
countries are the findings of Bosworth and Collins (1999). They documented that FDI
positively affects economic development- their models were based on cross-country data.
In addition, Barel and Pain (1999) documented the positive impact of FDI on economic
development. Their analysis was based on four European countries receiving foreign
investments originating from the USA. Furthermore, Balasubramanyam et al.’s findings
(1996) also support the notion that foreign direct investments trigger economic growth.
However, for FDI to positively affect growth, countries should have exceeded a threshold
level of human capital, as has been proposed by Keller (1996). Similar results have been
documented by Xu (2000). The findings of Blalock and Gertler (2005) suggest that FDI
facilitates the transfer of technology from developed countries to developing countries. In
addition to meeting a minimum threshold level of human endowment, countries should also
invest in their social capacity. This has been proposed by Abramovitz’s findings (1986),
where he suggested that the term social capacity represents economic stability, human
capital and infrastructure. By providing proper infrastructure, governments can convince
multinationals to invest in their economy.
10
On the other hand, the findings of Bos et al. (1974) suggest that FDI negatively affects
growth. They studied FDI flows relating to the US market and documented a negative link
between FDI and growth.
Similar conclusions have been proposed by Prebisch (1968). As the findings in the literature
suggest, the impact of FDI on growth is not exactly clear and straightforward.
1.3.3. Impacts on labour force
What can be said about the effect of FDI on jobs in Vietnam, given its significant
position in the Vietnamese economy? Despite large inflows of foreign capital in the 1990s
and the substantial contribution of foreign affiliates to production during this period, the
number of people directly working by such affiliates is still relatively poor. 128
Transnational Corporations, Vol. 15, No. 1 (April 2006). As with other Vietnamese
economic statistics, there are different estimates of employment by foreign affiliates. There
are considerable differences between the Ministry of Planning and Investment and the
Ministry of Labour, Invalids and Social Affairs estimates of the numbers employed in
foreign affiliates. Ministry of Labour, Invalids and Social Affairs data are based on the
annual Labour Force Survey which collects data from over 100,000 households, while the
Ministry of Planning and Investment data are collected from a quarterly survey of
enterprises. Although it might be expected that enterprise data would give a more accurate
picture of employment, it has been noted by the IMF that Ministry of Planning and
Investment data are likely to be biased upwards because firms receive tax incentives for
FDI-related activities (IMF, 1999, box II.1).
1.3.4. Impacts on technology
Among the most important arguments for FDI is the technology transfer possible
through FDI projects. The basic argument is that multinational companies are in possession
of superior know-how which is brought to the country. Domestic firms competing with them
adopt the new technology leading to an increased domestic capability of adapting and
developing new technology. It is often pointed out that countries open to FDI (e.g. 4 the
Asian Tigers) have been able to benefit from technology transfer more than countries with
restrictive policies. On the other hand, it is also argued that multinational companies either
11
bring old technology or that the technology introduced is not adequate to the conditions of
developing countries. In both cases technology transfer does not take place. True or not, this
argument points to the fact that technology transfer cannot be expected to take place
automatically but also depends on other factors like the quality of the labor force, the setup of the project or the type of technology introduced. This determines the capacity of the
LDCs to absorb and thus benefit from FDI and, on the other hand, the type of technology
introduced by the multinationals. Another important point is that "technology" should be
taken in a wider sense including also organizational and international marketing know-how
(Chen, 1996).
12
CHAPTER 2. PRACTICAL SITUATION IN VIETNAM AND IMPACTS OF FDI
ON VIETNAM’S ECONOMY
2.1 Practical situation in Vietnam
2.1.1. FDI situation from 2000 to 2007
2.1.1.1. Size of FDI in Vietnam
Since the Law on Foreign Investment took effect, Vietnam has achieved positive results
in attracting foreign direct investment. Statistics showed that FDI inflows into Vietnam
increased from 20.7 billion dollars in the period of 1991-2000 to more than 50 billion
dollars in around seven years, from 2000 to 2007.
Table 2.1. FDI project registrations and average size, 2000-2007
(Million dollars and number of projects)
Year
Number of
Registered
Average registered
Implemented
project
capital
capital per project
capital
2000
391
2839
7.3
2413
2001
555
3143
5.7
2450
2002
808
2999
3.7
2591
2003
791
3191
4.0
2650
2004
811
4548
5.6
2852
2005
970
6840
7.1
3309
2006
987
12004
12.2
4100
2007
1544
21348
13.8
8034
Total
6857
56912
90
28399
Sources: General Statistics Office and Ministry of Planning and Investment.
According the statistical data of FDI project registration and average size, there are
nearly 7000 project licensed in Vietnam with the total registered capital of more than 50
billion dollars, in which implemented capital was around 28 billion dollars, accounted for
56% total registered capital. Besides, average registered capital per project also had the
tendency to rise. If average registered capital per project was under 10 million dollars over
13
the 5- year period since 2000, this average capital went up substantially in the next two
years with more than 12 million dollars per project.
If we had a closer look on the registered capital in this period, we could find that this
factor increased sharply, from 6.8 billion USD in 2005 to more than 12 billion USD in 2006
and even nearly double in 2007, with more than 21 billion USD. The main reason for this
increase was that Vietnam joined World Trade Organization (WTO) in January 2007.
Within one year of becoming an official member of WTO, Vietnam had made great
achievements in socio-economic development, created a favorable business environment
and opportunities and opened up new opportunities in attracting foreign investment. First
of all, joining WTO created the chance for Vietnamese enterprises to be treated more
equally in their entry into international markets, contributing to overcoming market
obstacles that enterprises with foreign owned capital faced. In addition, Vietnam committed
to open 11/12 service sectors including a number of important sectors such as
telecommunications services, distribution and so on, which created conditions for foreign
investors to feel safe in long-term investment in Vietnam. Last but not least, becoming a
WTO member required Vietnam to continue building a more complete and transparent legal
environment, which removed part of barriers in foreign investment in Vietnam.
2.1.1.2. FDI structure in Vietnam by sector and industry
As we know, Viet Nam’s economic landscape has altered radically, moving from an
agriculture-based to an industry- and services-based economy. FDI has been one of the
engines behind this transformation and it continues to be a driving force of industrial growth
and economic diversification. Although the first foreign investments were directed in the
oil and gas sector, the industrial sector rapidly became the main magnet for FDI, as foreign
investors used Viet Nam as an export platform.
Table 2.2. Sectoral distribution of foreign investment projects, 2000–2007
(Million dollars and percentage of total)
Manufacturing
Registered capital
Share of total registered
(million dollars)
capital (percentage of total)
33 698
62.2
14
Real estate, renting
9068
16.7
Hotels and restaurants
3090
5.7
Construction
2209
4.1
Transport, storage and
1493
2.8
994
1.8
Mining and quarrying
716
1.3
Agriculture and forestry
637
1.2
Other
2296
4.2
business activities
communications
Electricity, gas and water
supply
Sources: General Statistics Office and Ministry of Planning and Investment.
According to the data of the table above, we can easily see that the predominance of
manufacturing FDI further increased in the past few years, as the sector attracted more than
62 per cent of all registered capital in 2000–2007. Real estate is a very distant second with
17 per cent of the total, followed by hotels, construction and transport with less than 6 per
cent each. This predominance of the manufacturing sector highlights that foreign investors
have chosen Viet Nam mainly as a centre of production for globally traded goods.
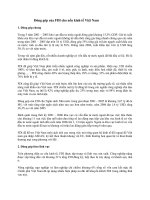
2.1.1.3. FDI structure by forms of investment
Figure 2.1. FDI structure by forms of investment, 2007
(Percentage of total)
15
FDI structure by forms of investment
2% 2%
0%
5%
29%
62%
Enterprise with 100% foreign owned capital
Joint venture
Business co-operation contract
BOT/BTO/BT contract
Joint-stock companies
Parent - Subsidiary Companies
Source: Ministry of Planning and Investment.
Based on the graph of FDI structure by forms of investment, it could be easily seen that
by the end of 2007, FDI was mainly carried out in the form of enterprise with 100% foreign
owned capital, which was accounted for 77.65% of the total number of projects, 61.65% of
registered capital and 38.74% of implemented capital. The form of joint venture has now
decreased to 18.89% of total projects, 28.89% of registered capital and 38,12% of the
implemented capital due to the fact that it only prevailed until the mid-1990s, which
resulted from the restriction on establishing an enterprise with 100% foreign owned capital.
Besides, some forms of investment such as business co-operation contract, BOT/BT/BTO
contract and joint-stock companies was still quite limited, which only accounted for 5%,
2%, 2% respectively.
2.1.2. FDI situation from 2008 to 2019
2.1.2.1. FDI situation from 2008 to 2011
Overview of global financial crisis of 2008
The financial crisis of 2008, which also known as the global financial crisis (GFC) that
originated in the US reached its peak on September 15, 2008 and tends to spread more and
more, with the rapid breakdown of a series of large, reputable financial institutions, which
leads the world financial market fell into a serious crisis. Excessive risk-taking by banks,
16
combined with the bursting of the United States housing bubble were proved to be the two
of the main causes of the crisis. Following the US, Europe was also the center of the crisis,
badly affected. Additionally, a number of other countries with capital markets linked with
the US and Europe were directly affected such as Canada, Australia and so on. Besides,
Asian countries' financial markets (Japan, Singapore, Thailand, Korea, Indonesia) and
South America (Brazil, Argentina, etc.) are also affected, though not as serious as large
countries like America, Europe.
Impact of the global financial crisis on FDI in Vietnam
Due to the fact that Vietnam's economy has integrated more and more with the world
economy, the global financial crisis has had a certain impact on Vietnam's economy,
especially on foreign direct investment. With regard to attract foreign direct investment
capital, credit in international financial markets was narrowed due to foreign investors
facing financial difficulties and being more cautious when making investment decisions.
Therefore, direct and indirect investment declined globally and Vietnam is not an
exception. Thus, the disbursement progress of FDI capital in was slower and had the
tendency to be net out. Other sources of capital such as foreign loans will also be limited.
Especially, serious effects of the global financial crisis on foreign direct investment could
be seen in a more clearly way through the statistics data of FDI in the period of four years,
from 2008 to 2011.
FDI by size
Table 2.3. FDI project registrations and average size, 2008-2011
(Million dollars and number of projects)
Year
Number of project
Registered capital
Implemented capital
2008
1171
71726
11500
2009
1208
23107
10000
2010
1237
19886
11000
2011
1186
15598
11000
Source: General Statistics Office
According to the statistical data in the period of four years, from 2008 to 2011, we
could see that there was not too much change in the number of project and implemented
17
capital with around 11000 million dollars and more than 1000 projects per year. However,
this period witnessed the record decrease in registered capital, from more than 70 billion
dollars in 2008 to 23 billion dollars in 2009, which declined more than 60 percent and
continually fell in the next two years, reached the bottom in the year 2011 with just 15
billion dollars.
First of all, 2008 could not only be considered as the most successful year of Vietnam
in attracting FDI since Vietnam’s effort to attract FDI more than 20 years ago but also a
milestone marking one year after Vietnam joined WTO. In this year, Vietnam had more
than 70 billion dollars registered capital, which was 48.3% higher compared to 2007.
Nevertheless, after the global financial crisis occurred at the end of 2008, the cost of capital
becomes more expensive and the export market is likely to be narrowed so that a decrease
in capital flows into Vietnam is inevitable. In addition, the loan capital often accounts for a
large proportion of the total investment capital, so when financial institutions, banks have
difficulties, many loan contract could not be signed or disbursed. The on-going FDI projects
may be halted because investors have to balance their capital capacity and ensure financial
safety in this crisis. Newly licensed FDI projects will face difficulties if investors suffer
great losses from the crisis. Due to that main reason, FDI in Vietnam was affected seriously
during the next three years until there was an improvement from 2012 onwards.
FDI by main counterparts
Besides the downward trend in the size of FDI, this period still witnessed the decline
in the newly registered capital.
Figure 2.2. FDI by main counterparts, 2008
(Billion dollars)
18
Top 5 investors in Vietnam, 2008
Brunei
4.4
Singapore
4.46
Japan
7.28
Taiwan
8.64
Malaysia
14.9
0
2
4
6
8
10
12
14
16
By 2008, there are 50 countries and territories registered for investment in Vietnam, of
which 11 countries and territories registered investment capital of over 1 billion USD. First
of all, Malaysia led the way with 55 projects, registered capital of 14.9 billion USD,
accounting for 4.7% of the number of projects and 24.8% of registered investment capital.
Taiwan ranked second with investment capital of 8.64 billion USD. In addition, Japan
ranked third an investment capital of 7.28 billion USD. Last but not least, Singapore ranked
4th with registered investment capital of 4.46 billion USD and Brunei ranked 5th with
around 4.4 billion USD of investment.
However, after the global financial crisis, the registered investment capital decreased a
lot compare to positive situation in 2008.
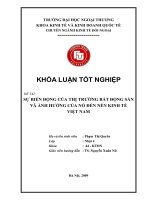
Figure 2.3. FDI by main counterparts, 2011
(Billion dollars)
19
Top 5 investors in Vietnam, 2011
China
0.74
South Korea
1.47
Singapore
2.2
Japan
2.43
Hong Kong
3.09
0
0.5
1
1.5
2
2.5
3
3.5
As can be seen from the graph, Hong Kong led the way with a total investment of
registered capital with 3.09 billion dollars, accounting for 21% of the total investment in
Vietnam. Japan ranked second with 2.43 billion dollars and following by Singapore, South
Korea and China with 2.2; 1.47 and 0.74 billion dollars, respectively. We can see that the
total investment in Vietnam from foreign investors by 2011 decreased too much, just equal
about one-fifth compared to 2008.
2.1.2.2. FDI situation from 2012 to 2019
After the global financial crisis on 2008 and its effect on the foreign direct investment
in Vietnam over the next few years, Vietnam has witnessed a remarkable change in a
positive way through size, investment sectors and lists of countries invested in Vietnam.
FDI by size
In general, FDI in Vietnam during this period increased year by year, with the rise in
number of projects, registered capital and implemented capital. Nevertheless, if there was
a slightly increase in FDI over the 4-year period, from 2012 to 2015, Vietnam witnessed
the significant growth of FDI inflows in the next four years.
Figure 2.4. FDI project registrations, 2012-2019
(Million dollars and number of projects)
20
FDI project registrations, 2012-2019
45,000
4,500
40,000
4,000
35,000
3,500
30,000
3,000
25,000
2,500
20,000
2,000
15,000
1,500
10,000
1,000
5,000
500
0
0
2012
2013
2014
Registered capital
2015
2016
Implemented capital
2017
2018
2019
Number of project
Source: General Statistics Office
In the period of 2012-2015, FDI increased slightly, mainly due to the decline of the
global economy. The number of projects rose marginally with 1287 projects in 2012 and
the highest number was 2120 in 2015. Besides, the registered capital witnessed a slight
fluctuation in this stage. The registered capital went up slowly from 16 billion USD to 22
billion USD in 2013 before a slight decline in 2014 with only 21 billion USD. However, by
2015, the registered capital increased again with more than 24 billion dollars.
On the other hand, due to the fact that Vietnam joined some FTAs, especially CPTPP
and EVFTA, FDI in this period grew sharply. Within four years, the number of projects
from foreign investors rose rapidly, from 2613 projects in 2016 to more than 4000 projects
in 2019. There was also an upward trend in registered capital, which was only 26 billion
dollars in 2016, equally 68% of total registered capital in 2019. Moreover, implemented
capital also climbed, which forecasted a more positive future in attracting FDI in Vietnam
in the next few years.
FDI by main counterparts
Figure 2.5. FDI by main counterparts (Accumulation of projects having effect as of
31/12/2019)
(Million dollars)
21
FDI by main counterparts
United Kingdom
Canada
Cayman Islands
Samoa
USA
Netherlands
Thailand
Malaysia
China
British Virgin Islands
Hongkong
Taiwan
Singapore
Japan
Korea
3716
5028
7176
7385
9307
10053
10908
12634
16284
21722
23722
32378
49772
59364
68102
0
10000
20000
30000
40000
50000
60000
70000
80000
Source: General Statistics Office
Regarding investment counterparts, over a few decades of attracting FDI, there are
more than 130 countries and territories registered to invest in Vietnam, but FDI mainly
concentrated in investors from 15 countries territories, in which South Korea, Japan and
Singapore are countries with the largest total investment capital in Vietnam. Following
three countries mentioned before are Hong Kong and Taiwan. Meanwhile, the US and
Europe, although being the two main export markets, bringing a large export surplus to
Vietnam, the FDI inflows from these markets to Vietnam are still very limited.
As we know, the origin of FDI inflows into a country is one of the factors that reflect
the quality of FDI and the efficiency in using this capital. It could be seen that FDI inflows
into Vietnam have the tendency to shift in origin, towards increasing FDI from developed
countries and some countries with source technology such as Korea, Japan and so on.
FDI by sector and industry
Figure 2.6. FDI by kinds of economy activity (Accumulation of projects having effect as of
31/12/2019)
(Percentage of total)
22
FDI by kinds of economy activity
3%
3%
2%
2% 1% 1%
6%
7%
59%
16%
Manufacturing
Real estate activities
Electricity, gas, stream and air conditioning supply
Accommodation and food service activities
Construction
Wholesale and retail trade; Repair of motor vehicles and motorcycles
Transporation and storage
Mining and quarrying
Education and trainning
Other
Source: General Statistics Office
With regard to kinds of economy activity, FDI has increasingly concentrated on a few
key industry groups, associated with the tariff reduction roadmap and opening up attractive
investment fields according to increasingly open commitments in FTAs. From 2001 up to
now, which mentioned in the section of FDI in Vietnam from 2000 to 2007, we could see
that FDI has focused mainly on processing and manufacturing industries. FDI inflows into
the manufacturing and processing sector accounted for 59% of the capital structure and
50.3% of the project structure. However, considering the fluctuation of FDI inflows into
Vietnam, it shows that foreign investors has had the tendency to invest more in a number
of other Vietnamese service industries such as real estate business, wholesale and retail,
repair cars, motorcycles and motorbikes; professional activities, science and technology
and prominent is the arts and entertainment. On the contrary, some traditional industries
have gradually decreased FDI attraction. The most powerful ones are the production,
distribution of electricity, gas, hot water, steam, air-conditioning and the mining industry,
which only accounted for 7% and 1%, respectively.
2.1.3. FDI situation in 2020
23
Despite the negative effects of Covid-19 pandemic, Vietnam is still a market that has
recorded many positive points in attracting foreign investment in a number of fields and
industries.
The manufacturing and processing sector accounts for 48 percent of total registered
investment capital in the country, as shown in the table below. This is followed by real
estate worth $60 billion, power production and distribution worth $28.7 billion, and
accommodation and food services worth $12 billion. Construction, wholesale,
transportation, mining, and education are some of the other prominent FDI industries.
Table 2.4. Vietnam FDI Attraction by kinds of economy activity (As of November 2020)
(Million dollars)
Industry
Number of projects
Total registered
investment captital
Manufacturing, processing
15080
225733
Real estate activities
939
60112
Production, electricity, gas,
149
28733
891
12516
Construction
1755
10683
Wholesale and retail trade,
5145
8434
Transportation and storage
869
5235
Mining and quarrying
108
4897
Education and training
577
4404
Information and
2316
3950
stream and air conditioning
supply
Accomodation and food
servive activities
repair of motor vehicles
and motorcycles
communication
Source: Ministry of Planning and Investment
24
This diverse set of industries suggests a wide variety of potential FDI sources for
Vietnam. The manufacturing and processing sector's dominance represents the productivity
gains offered by Vietnam to foreign companies. Moreover, a majority of the industries in
the preceding list are also consumer-facing. Food service, retail, transportation, and
education are only a few examples. With a population of over 96 million people, the
majority of whom are under the age of 35, it is expected that the middle-class in Vietnam
could double by 2026. This means that international investors will have potential prospects
in consumer-facing sectors.
Besides, the fact that Vietnam has been in good control of Covid-19 created the
opportunities for foreign investors decide to transfer the investment to Vietnam.
There were 109 countries and territories with investments in Vietnam as of November
2020. Singaporean companies have spent $8 billion in the world, the most of any country,
surpassing South Korea from the previous year. South Korean firms came in second with a
total investment capital of 3.7 billion dollars, followed by Chinese firms with a total
investment capital of 2.4 billion dollars. Moreover, a number of Japanese, Thai, and
Taiwanese companies are also active.
Table 2.5. Top 5 investors in Vietnam (As of November 2020)
(Million dollars)
Country
Number of new projects
Total registered capital
Singapore
225
8076
South Korea
573
3702
China
311
2402
Japan
251
2111
Taiwan
115
1999
Source: Ministry of Planning and Investment
Specifically, a new group of Japanese companies, including AEON, Uniqlo, and
Mizuho, has recently expanded their presence in Vietnam. According to a new study,
Japanese companies see Vietnam as the most attractive FDI destination in 2020.
Similarly, Thai companies reported twice as many ventures in 2020 as they did in 2019,
25