Sinh non và yếu tố nguy cơ tại Đông Anh_Tiếng Anh
Bạn đang xem bản rút gọn của tài liệu. Xem và tải ngay bản đầy đủ của tài liệu tại đây (481.13 KB, 16 trang )
<span class='text_page_counter'>(1)</span><div class='page_container' data-page=1>
<b>PRETERM AND ITS RISK FACTORS AT </b>
<b>DONG ANH DISTRICT, HANOI, 2014-2015</b>
</div>
<span class='text_page_counter'>(2)</span><div class='page_container' data-page=2>
<b>BACKGROUND </b>
• Preterms were newborns delivered under 37
week of gestation and could lead to long term
consequences affect the mental and physical
development.
• Estimated 9.6% of newborns all around the
world was preterms in 2005 (equal to 12.9
millions)
</div>
<span class='text_page_counter'>(3)</span><div class='page_container' data-page=3>
<b>OBJECTIVES </b>
</div>
<span class='text_page_counter'>(4)</span><div class='page_container' data-page=4>
<b>METHODOLOGY </b>
• This study was conducting in 1285 pregnant
women and then delivered at health facilities in
Dong Anh district.
</div>
<span class='text_page_counter'>(5)</span><div class='page_container' data-page=5>
<b>METHODOLOGY </b>
Statistic analysis:
• Raw statistics were managed and analysed in
SPSS 16.0
• Post analysed statistics were demonstrated in
cross table and in numbers and percentage.
• Test χ
2<sub>and p value were used to indicate the</sub>
correlation between dependent and independent
variables.
• Relative risk (RR) and 95% CI were employed to
evaluate
the
relationship
risk
factors
and
</div>
<span class='text_page_counter'>(6)</span><div class='page_container' data-page=6>
<b>RESULTS AND DISCUSSION </b>
<b>Table 1: Mother's personal characteristics</b>
Socio-demographic factors
<b>Number </b>
<b>Percentage (%)</b>
Age
<20
20-29
30-39
40-49
24
897
349
15
1.9
69.8
27.2
1.2
Education level
Primary school
Secondary school
High school
University
24
229
473
559
</div>
<span class='text_page_counter'>(7)</span><div class='page_container' data-page=7>
<b>RESULTS AND DISCUSSION </b>
<b>Table 1: Mother's personal characteristics (cont.)</b>
Occupation
Government employee
Private employee
Worker
Farmer
Small trade
Others
209
206
349
168
183
170
16.3
16.0
27.2
13.1
14.2
13.2
Family economy status
Poor
Nearly poor
Uncategorized
29
910
341
</div>
<span class='text_page_counter'>(8)</span><div class='page_container' data-page=8>
<b>RESULTS AND DISCUSSION </b>
<b>Table 2: Reproductive health status </b>
Reproductive health status <b>n </b> <b>%</b>
Previous preterm
Yes
No
31
1254
2.4
97.6
Previous low birth weight
Yes
No
25
1260
1.9
98,1
Physical health status during pregnancy
Excellence
Good
Normal
Poor
160
864
256
5
</div>
<span class='text_page_counter'>(9)</span><div class='page_container' data-page=9>
<b>RESULTS AND DISCUSSION </b>
<b>Table 2: Reproductive health status (cont.)</b>
Reproductive health status <b>Number </b> <b>Percentage (%)</b>
Mental health during pregnancy
Excellence
Good
Normal
407
679
199
31.7
52.8
15.5
Emotional violation during pregnancy
Yes
No
723
562
56.3
43.7
Physical violation during pregnancy
Yes
No
157
1128
12.2
87.8
Sexual violation during pregnancy
Yes
No
156
1129
12.1
87.9
</div>
<span class='text_page_counter'>(10)</span><div class='page_container' data-page=10>
<b>RESULTS AND DISCUSSION </b>
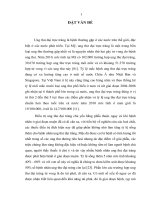
<b>Figure 1: The rate of preterm and level of preterm</b>
94.4%
4.4%
1.2%
5.6%
Sinh đủ tháng
Sinh non
</div>
<span class='text_page_counter'>(11)</span><div class='page_container' data-page=11>
<b>RESULTS AND DISCUSSION </b>
<b>Table 3: The relationship between preterm and risk factors</b>
Risk factors <b>Preterm</b>
<b>(%)</b>
<b></b>
<b>Non-preterm</b>
<b>(%)</b>
<b>Bivariate </b>
<b>analysis </b>
<b>RR (95% CI)</b>
<b>Multivariate </b>
<b>analysis </b>
<b>RR (95% CI)</b>
Age (years)
Over 25
Under 25
41 (4.9)
34 (7.6)
797 (95.1)
413 (92.4)
1
1.6 (1.00-2.41)
1
1.6 (0.99-2.67)
Education level (years)
</div>
<span class='text_page_counter'>(12)</span><div class='page_container' data-page=12>
<b>RESULTS AND DISCUSSION </b>
<b>Risk factors </b> <b>Preterm</b>
<b>(%)</b>
<b></b>
<b>Non-preterm</b>
<b>(%)</b>
<b>Bivariate </b>
<b>analysis </b>
<b>RR (95% CI)</b>
<b>Multivariate </b>
<b>analysis </b>
<b>RR (95% CI)</b>
Household economic
Poor
Non-poor
0
75 (6.0)
29 (100)
1176 (94.0)
NA NA
Mental health status
Good
Normal and poor
59 (5.4)
16 (8.1)
1027 (94.6)
182 (91.9)
1
1.5 (0.87-2.53)
1
1.0 (0.45-2.18)
Physical health status
Good
Normal and poor
53 (5.2)
22 (8.5)
971 (94.8)
238 (91.5)
1
1.6 (1.01-2.64)
1
1.6 (0.78-3.17)
</div>
<span class='text_page_counter'>(13)</span><div class='page_container' data-page=13>
<b>RESULTS AND DISCUSSION </b>
<b>Risk factors </b> <b>Preterm</b>
<b>(%)</b>
<b></b>
<b>Non-preterm</b>
<b>(%)</b>
<b>Bivariate </b>
<b>analysis </b>
<b>RR (95% CI)</b>
<b>Multivariate </b>
<b>analysis </b>
<b>RR (95% CI)</b>
Previous preterm
No
Yes *
72 (5.8)
3 (8.8)
1179 (94.2)
31 (91.2)
1
1.5 (0.51-4.62)
1
1.6 (0.39-6.37)
Emotional violation
No
Yes
39 (6.9)
36 (5.0)
523 (93.1)
687 (95.0)
1
0.7 (0.46-1.11)
1
2.1 (1.38-6.58)
Physical violation
No
Yes
61 (5.4)
14 (8.9)
1067 (94.6)
143 (91.1)
1
1.6 (0.95-2.87)
1
1.6 (0.75-3.38)
</div>
<span class='text_page_counter'>(14)</span><div class='page_container' data-page=14>
<b>RESULTS AND DISCUSSION </b>
<b>Risk factors </b> <b>Preterm</b>
<b>(%)</b>
<b></b>
<b>Non-preterm</b>
<b>(%)</b>
<b>Bivariate </b>
<b>analysis </b>
<b>RR (95% CI)</b>
<b>Multivariate </b>
<b>analysis </b>
<b>RR (95% CI)</b>
Sexual violation
No
Yes
62 (5.5)
13 (8.3)
1067 (94.5)
143 (88.2)
1
1.5 (0.85-2.69)
1
1.6 (0.79-3.25)
Antenatal depression
No
Yes
65 (5.3)
10 (15.5)
1151 (94.7)
54 (84.5)
1
2.9 (1.58-5.41)
1
3.0 (1.38-6.58)
</div>
<span class='text_page_counter'>(15)</span><div class='page_container' data-page=15>
<b>RESULTS AND RECOMMENDATIONS</b>
Preterm is still major public health problem in Vietnam.
Antenatal
depression,
violence
during
pregnancy
and
occupation are predictors of preterm birth.
Screening
the
antenatal
depression,
partner
emotional
</div>
<span class='text_page_counter'>(16)</span><div class='page_container' data-page=16></div>
<!--links-->