Bài tập tổng hợp nhóm A1-17, A2-17, A3-17
Bạn đang xem bản rút gọn của tài liệu. Xem và tải ngay bản đầy đủ của tài liệu tại đây (712.88 KB, 7 trang )
<span class='text_page_counter'>(1)</span><div class='page_container' data-page=1>
C:
Fo
od
Chemistr
y
Detection of Chicken and Turkey Meat in Meat
Mixtures by Using Real-Time PCR Assays
Zulal Kesmen, Ahmet E. Yetiman, Fikrettin S¸ahin, and Hasan Yetim
Abstract: In this study, TaqMan-based real-time Polymerase Chain Reaction (PCR) techniques were developed for
the detection of chicken and turkey meat in raw and heat-treated meat mixtures. Primers and TaqMan probe sets were
designed to amplify 86 bp and 136 bp fragments for the chicken and turkey species, respectively, on the mitochondrial
NADH dehydrogenase subunit 2 gene. In the results, it was possible to detect each species at the level of 0.1 pg template
DNA with the TaqMan probe technique without any cross-reactivity with nontarget species (bovine, ovine, donkey,
pork, and horse) while the detection level was 1 pg template DNA using conventional PCR. The TaqMan probe assays
used in this study allowed the detection of as little as 0.001% level of both species in the experimental meat mixtures,
prepared by mixing chicken and turkey meat with beef at different levels (0.001% to 10%). In conclusion, TaqMan probe
assays developed in this research are promising tools in the specific identification and sensitive quantification of meat
species even in the case of heat-treated meat products, and suitable for a rapid, automated, and routine analysis.
Keywords: conventional PCR chicken, real-time PCR, species identification, TaqMan probe, turkey
Introduction
Food labelling regulations require accurate declaration of meat
species on the labels of meat products. Several of the analytical
methods that have been developed to verify labelling statements
regarding meat species rely mainly on protein and DNA
anal-ysis. However, protein-based methods including immunological
assays (Kang’ethe and others 1986; Andrews and others 1992;
Ansfield and others 2000), electrophoretical (Cota-Rivas and
Vallejo-Cordoba 1997; Skarpeid and others 1998; ăOzgen-Arun
and Ugur 2000), and chromatographic techniques (Chung and
others 1998; Wissiack and others 2003) have limited success in
cooked meat products. In the recent past, DNA molecules have
been used as target compounds for species identification due to
their high stability and unique variability which allow the
differ-entiation of closely related species. Among DNA-based methods,
Polymerase Chain Reaction (PCR) is an effective technique that
is highly accurate and relatively fast. The conventional
qualita-tive PCR method has a satisfactory performance in the qualitaqualita-tive
detection of meat species that are undesirable by consumers for
health (for example, allergic reactions) reasons, ethnic, or religious
values (Kesmen and others 2007). However, the need for methods
that give quantitative results has arisen following the introduction
of labelling obligations made by Authorised Food Control
Agen-cies especially within the last decade. Morever, quantification is
also necessary for the detection of intentional adulteration of meat
products or accidental contamination in the production line.
Real-time PCR has demonstrated the highest improvement
among PCR-based methods in recent years. In real-time PCR,
the exponential amplification of target-specific DNA is monitored
<i>MS 20110728 Submitted 6/14/2011, Accepted 11/2/2011. Authors Kesmen,</i>
<i>Yetiman, and Yetim are with Food Engineering Dept., Faculty of Engineering, Erciyes</i>
<i>Univ., 38039 Kayseri, Turkey. Author S¸ahin is with Bioengineering Dept., College</i>
<i>of Engineering, Yeditepe Univ., 34755 Istanbul, Turkey. Direct inquiries to author</i>
<i>Kesmen (E-mail: ).</i>
by an increased fluorescence signal (Holland and others 1991). If
the species under study is present in the matrix, a specific signal can
be observed. As well as meeting the need for quantitative
deter-mination in meat species, this technique also has other advantages
like higher sensitivity and specifity, a larger dynamic range of
de-tection and less carry-over contamination risk (Rojas and others
2011; Yusop and others 2011).
Many applications are based on intercalating fluorescent dyes
like SYBR Green (Walker and others 2003; L ´opez-Andreo and
others 2006; Mart´ın and others 2009). This method requires the
greatest sequence specificity due to the fact that these types of dyes
bind to all double-stranded DNA present, including any
nonspe-cific PCR products and the primer–dimer complex. Therefore the
real-time quantitative PCR procedure for species identification is
generally based on the use of a TaqMan fluorogenic probe (Hird
and others 2005; Rodriguez and others 2005; Kesmen and others
2009; K ¨oppel and others 2011). This method utilizes an
addi-tional primer, which is also bound specifically to the target DNA
sequence during the annealing step. This primer is an
oligonu-cleotide with both a reporter fluorescent dye and a quencher dye
attached. The accumulation of specific PCR products is detected
by hybridization and cleavage of a double-labelled fluorogenic
probe during the amplification reaction.
There are numerous PCR-based techniques available to
iden-tify precisely the origin of poultry meat. Some of these techniques
include the restriction fragment length polymorphism (RFLP)
of PCR products of mitochondrial 12S rRNA gene (Girish and
others 2007), specific PCR (Rodr´ıguez and others 2003; Mane
and others 2009), random amplified polymorphic DNA-PCR
(RAPD-PCR) fingerprints (Calvo and others 2001; Saez and
oth-ers 2004), and actin gene-related polymerase chain reaction
(Hop-wood and others 1999). Generally, these methods offer qualitative
or semi-quantitative measurement.
Although numerous studies, based on real-time PCR, have been
devoted to the identification of red meat animal species, studies
for detecting poultry species are rare. For example, Dooley and
C
</div>
<span class='text_page_counter'>(2)</span><div class='page_container' data-page=2>
C:
Fo
od
Chemistr
y
others (2004), Tanabe and others (2007), and Jonker and
oth-ers (2008) detected chicken and turkey species with the TaqMan
probe method by using the mitochondrial<i>cytb</i>gene and Laube and
others (2007) used the interleukin-2 precursor gene to identify of
these species. To our knowledge, in poultry meat identification,
there have been no reports on the use of real-time PCR analysis of
the mitochondrial NADH dehydrogenase subunit 2 (ND2) gene,
which has sufficient degrees of mutation in many plants and
an-imals. Therefore, the aim of this study was to develope real-time
PCR assays, by using mitochondrial ND2 gene variability, for the
more reliable and sensitive detection of chicken and turkey meat
in raw and heat-treated meat mixtures.
Materials and Methods
Preparation of meat mixtures
Tissue from the skeletal muscle of chicken (<i>Gallus gallus</i>), turkey
(<i>Meleagris gallopavo</i>) horse (<i>Equus caballus</i>), donkey (<i>Equus asinus</i>),
pork (<i>Sus scrofa domesticus</i>), cattle (<i>Bos taurus</i>), and sheep (<i>Ovis</i>
<i>aries</i>) were used. Binary meat mixtures, containing chicken and
turkey meat ranging from 0.001% to 10% levels (corresponding
range of 0.001 to 10 ng target DNA), were prepared within a beef
mixture. To eliminate errors that usually occur during blending,
beef was added to the mixture at a level of approximately 50%
in each batch and blended for 2 min to obtain a thoroughly
ho-mogeneous meat mixture each time when the target meats were
diluted in the mixtures. Patties of approximately 20 g were
pre-pared at every level of the binary mixtures and were subjected to
3 different heat treatments at 100, 150, and 200<b>◦</b>C for 30 min in
the oven after being covered with aluminium foil. Afterwards,
DNA isolation was carried out on the raw and oven-cooked
samples.
DNA isolation
To obtain a representative specimen, approximately 10 to 15 g
raw and oven-cooked patty samples and pure meats from each
species investigated were sampled in screw-top grinding jars and
then powdered by using a mixer mill (Restch MM400, Germany)
with a vibrational frequency of 30 Hz for 5 min after storing
at –80 <b>◦</b>C overnight. The DNA was extracted from 25 mg of
the powdered samples using a commercial kit (Qiagen, Hilden,
Germany) according to manufacturer’s protocol and the DNA
concentration was measured by the spectrophotometric method
(Heptinstall and Rapley 2002).
Oligonucleotide primers and probes
Chicken and turkey specific primers and probe sets were
de-signed using the mitochondrial ND2 (NADH dehydrogenase
sub-unit 2) gene DNA sequence following the alignment of available
sequences from the GenBank database with Clustal W (version
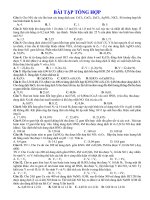
1.8). (Higgins and others 1992) (Figure 1). In addition, common
sense and antisense primers and a probe set that was common to
both mammalian and poultry were used to amplify a conserved
region of 74 bp of the 16 sRNA gene to act as a control of
am-plificability and false negativity on the PCR results (Kesmen and
others 2009). Primers and probes, labelled 5-carboxyfluorescein
(FAM) and 3 fluorescent quencher (TAMRA), were purchased
from Metabion (Martinsried, Germany).
Real-time PCR assay
The TaqMan PCR reaction was performed in a final volume
of 25<i>μ</i>L using 12.5<i>μ</i>L of Quantitect Probe PCR mix (Qiagen),
100 ng template DNA, 0.4<i>μ</i>M of each primer, and 0.15<i>μ</i>M
of the TaqMan probe. Amplifications were performed on a
Line Gene II PCR device (Bioer Technology Co., Hangzhou,
China) and a thermal cycling protocol of 95 <b>◦</b>C for 15 min
followed by 40 cycles with 15 s denaturation at 95 <b>◦</b>C, and
1 min annealing/elongation at 60<b>◦</b>C was applied. Reactions were
replicated at least twice per experiment and experiments were
replicated 3 times to verify the results.
PCR primers specificity and sensitivity test
The specificity of each species specific primer was confirmed by
the amplification of 100 ng of chicken, turkey, horse, donkey, pork,
bovine, and ovine genomic DNA, and a negative control without
DNA. Each assay was tested against DNA from all seven species,
that is, against its target species and the 6 remaining species to
confirm assay specificity. In sensitivity tests of the specific primers
and probes, PCR amplifications were examined between specific
primers and 10-fold serial dilutions of DNAs isolated from the
meat of each target species ranging from 100 to 0.0001 ng/<i>μ</i>L
water. The standard curves for both detection systems were
con-structed by using the ct value obtained from the corresponding
DNA concentration.
Conventional PCR protocol
The PCR amplification reaction was performed in a 50<i>μ</i>L
vol-ume containing 100 ng template DNA, 25<i>μ</i>L commercial PCR
master mix (Qiagen), and 0.8<i>μ</i>M of each primer. After an initial
denaturation step at 94<b>◦</b>C for 10 min, 40 thermal cycles were
car-ried out (Line Gene II PCR) as follows: melting at 94<b>◦</b>C for 50 s,
annealing at 53 and 55<b>◦</b>C for chicken and turkey, respectively,
ex-tension at 72<b>◦</b>C for 1 min, with a final elongation step at 72<b>◦</b>C for
10 min. The products of PCR amplification were
electrophoreti-cally determined on a 2.5% agarose gel containing ethidium
bro-mide (0.5<i>μ</i>g/mL) in 1XTAE buffer (Tris–Acetate–EDTA buffer)
and visualized by UV transillumination.
Results
In this study, conventional PCR and real-time PCR assays, based
on the amplification of fragments of the mitochondrial ND2 gene,
were developed and evaluated for the detection and quantification
of chicken and turkey meat in raw and heat-treated meat mixtures.
Species specific primers and TaqMan probes were designed, and
amplification conditions were optimized by using these primers
and probes.
Specificity of the TaqMan probe systems
The specificity of both detection systems were tested for 7
common and commercial meat species; chicken, turkey, pork,
horse, donkey, bovine, and sheep. The primers generated species
specific fragments of 80 and 137 bp length for chicken and turkey,
respectively, whereas no cross-reaction was obtained with any of
the nontarget species DNA (Table 1). The common primer–probe
system amplified a 74 bp fragment and calculated ct values of 15.98,
16.10, 15.61, 15.03, 18.14, 15.78, and 18.57 from horse, donkey,
pork, bovine, ovine, chicken, and turkey mitochondrial DNAs,
respectively.
Sensitivity and linearity of taqman probe system
</div>
<span class='text_page_counter'>(3)</span><div class='page_container' data-page=3>
C:
Fo
od
Chemistr
y
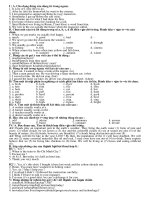
values compared with the logarithm of the target DNA
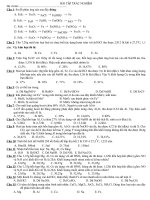
concen-tration to test linearity (Figure 2). The correlation between the
2 variables, ct and logarithm of template DNA concentrations
of chicken and turkey, gave determination coefficient values of
0.9965 and 0.9944, respectively. These results indicate that the
presence of a linear relationship between the ct values and DNA
concentrations, in the range of 100 ng to 0.0001 ng for each species
tested. For both primer–probe systems, the amplification curves
were apparently observed even in the level of 0.0001 ng DNAs
of target species (corresponds to 0.0001%) when the high-quality
DNA template (highly pure and non-degrade) was used (Table 1).
The efficiency of the primer–probe system developed specifically
for the chicken and turkey species were 109% and 110%,
respec-tively. As is well known, an acceptable range to determine the
efficiency of the PCR reaction (Efficiency=–1+10[−1<i>/</i>slope]),
which is a function of the standard curve slope, is between 90% and
110%.
Real-time PCR analysis of meat species in meat mixtures
No statistically significant difference was found in the ct values of
raw and heat-treated meat mixtures in either the chicken or turkey
specific real-time PCR systems. Heat treatment and temperature
did not have any significant effect on ct values in either species
(Table 2). The average ct values of raw and heat-treated mixtures
containing chicken meat at the level of 0.001%, 0.01%, 0.1%,
1%, 10% were determined as follows: 30.77, 28.31, 26.17, 23,
and 20.45, respectively, and for turkey they were 34.43, 32.40,
28.34, 26.29, and 22.37. The ct values corresponding to the DNA
concentration of the target species showed a linear change in all raw
and heat-treated meat mixtures, and for all samples the correlation
coefficient changes were between 0.986 and 0.996.
Results of conventional PCR
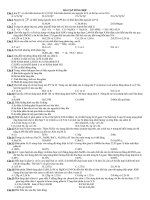
The agarose gel images of PCR products, obtained from
con-ventional PCR reactions carried out with chicken and turkey
spe-cific PCR primers, are shown in Figure 3 and 4. The sensitivity
of primers specific to both species was tested in all dilution levels,
from 0.0001% to 100%, of DNAs of the target species.
Con-sequently, it was determined that the specific primer sets could
detect both species up to the level of 0.001% (0.001 ng DNA in
water) without nonspecific reaction with other tested species. In
all the raw and heat-treated samples prepared from binary meat
mixtures, chicken and turkey species were detected up to the level
of 0.01%. In the conventional PCR method, heat processing up
to 200<b>◦</b>C did not have any effect on detection limit.
Discussion
The use of the real-time PCR method in food analysis in recent
years has concentrated especially the on quantitative detection of
the origins of vegetal and animal tissues in complex food
mix-tures (Palmieri and others 2009; K ăoppel and others 2011). In this
context, the TaqMan probe method in the real-time PCR
tech-nique is a very powerful techtech-nique in terms of both specifity and
sensitivity in species detection. The specifity of this method
pri-marily depends on the specifity of the primer and probe used.
<b>Table 1–Specifity and sensitivity test results obtained with the</b>
<b>species specific primer–probe sets.</b>
<b>Average ct value</b>±<b>SD</b>
<b>DNA</b>
<b>Species</b> <b>concentration (ng)</b> <b>Chicken</b> <b>Turkey</b>
Target species 0.0001 36.64±0.59 37.82±0.41
0.001 33.95±0.24 35.38±0.32
0.01 30.78±0.43 32.50±0.54
0.1 27.62±0.61 29.64±0.44
1 24.7±0.35 26.24±0.26
10 21.9±0.47 22.02±0.39
Chicken 100 17.52±0.34 40.00
Turkey 100 40.00 19.75±0.21
Horse 100 40.00 40.00
Donkey 100 40.00 40.00
Pork 100 40.00 40.00
Bovine 100 40.00 40.00
Ovine 100 40.00 40.00
CT of 40 indicates no amplification.
<b>Species</b> CF CP CR
<b>Chiken</b>
Horse
Donkey
Pork
Bovine
Ovine
<b>Turkey</b>
tatctcctataacccacaactcactattctcaccttcatcctctacacaattatgacctcaactgtattcctatccctag...a...
cc.agta...ac..ta..a..a..a.a.a.at.aa.t....tt..a..a..actc..aa...a..ctat.tat...c.g.
ct.agtg..c...ac..tg..a..a..a.a.a.ac.aa.t....tt..a..a..actc..aa...a..ctgt.tat...c.g.
at.ac.a..c...a..accata..a..ct.a.a.c.ac.aa.t....tc.ca..a..act.g.aa...a..ctat.aat...c.g.
ac.ac.a...accata..at.g..a.a...a..ta....t.tc..t..a..tt.c..ca....taccatat.tatagcc.at
.t.acta...t...accata..ac.a..a.a.c.a..ta.t..t.tc..t..a..ct.t..ca....tac.ctat.tatagcc.a.
c..tat...cg...t.tt...c...tgcat.g..tt..c.a..a..aa....ca...t....at..acccagatc
TF TP
Chiken
Horse
Donkey
Pork
Bovine
Ovine
<b>Turkey</b>
...a...g...a..c...t...c..a...a...g...aa.c...ctcc.
tcctctact.c.acact.t..c.ctc.ca.a...ac....t....c..acc.c.a..cta..ct..a..a.ct.a...ca
tcctctacc.c.acact.t..c.ctcaca.a...ac...g...c..a.c.cca..cta..cc..a.ca.ct.g...a
tc.gcaacc.c.act.t.t.cc..tc.cata...ac....t...cg.ca.c.caagccta...g.aa.c..a..c..aa
tccac.acc.ctac.ctgt..t..tcaca.a...at...c..ta.a.cc.tccta..tc.tgcca.t...ca
tc.ac.aca.ccac.ct.t..t..tcaca.a...at...g....c..ca.a.caattctag.cc.ca..a.c...aa
aaagtcctg.aactctcaa.aatactcatct...ca...acacctatacttaatgcaactataatacttgcactcctatctc
TR
</div>
<span class='text_page_counter'>(4)</span><div class='page_container' data-page=4>
C:
Fo
od
Chemistr
y
In previous studies where the PCR technique was used in meat
and meat products, target regions were generally selected from
mitochondrial DNA (mtDNA) because mtDNA has many more
advantages than nuclear DNA for species detection studies in meat
products. For example, mtDNA has many copies within each cell
when compared to nuclear mtDNA (Alberts and others 1994).
Since mtDNA is transferred to an individual maternally,
ambigui-ties caused by heterozygote genotypes are generally not a problem
(Hayashi and Walle 1985). In addition, mtDNA is more resistant
to fragmentation by heat when compared to nuclear DNA, and
relatively higher mutation rate of mitochondrial genes is adequate
for the differentiation of even closely related species (Kocher and
others 1989). In general,<i>cytb</i>(Dooley and others 2004; Hird and
others 2005), D-loop (Monteil-Sosa and others 2000), 12S rRNA
(Rodriguez and others 2005; Girish and others 2007; Mart´ın and
others 2009), and 16S rRNA (Sawyer and others 2003) genes have
been used in species detection on mitochondrial DNA. However,
in this study, the mitochondrial ND2 gene was used in the design
of a species specific primer and TaqMan probes for the detection
of chicken and turkey species because the mutation degree of this
<b>y = -3,1264x + 24,461</b>
<b>R2 = 0,9965</b>
<b>Log ( DNA Concentration [ng])</b>
<b>Ct</b>
<b>a</b> Chicken
<b>b</b> Turkey
<b>y = -3,1139x + 25,936</b>
<b>R² = 0,9944</b>
<b>Log ( DNA Concentration [ng])</b>
<b>Ct</b>
Figure 2–Standard curve showing the ct values in
relation to the concentration of initial target gene
copies, obtained by a serial 10-fold dilution of
each species (ranged from 0.0001 to 100 ng
DNA). a) Total of 10-fold dilution series of chicken
DNA b) Total of 10-fold dilution series of turkey
DNA.
<b>Table 2–Results of the experimental raw and heat-treated meat mixtures.</b>
<b>Average ct value</b>±<b>SD</b>
<b>Target</b> <b>The ratio of target species in</b>
<b>species</b> <b>the binary mixture (%)</b> <b>Raw samples</b> <b>100◦C</b> <b>150◦C</b> <b>200◦C</b>
</div>
<span class='text_page_counter'>(5)</span><div class='page_container' data-page=5>
C:
Fo
od
Chemistr
y
gene is sufficient for specific primer and probe design (Herman
2001; Kesmen and others 2009). The differentiation of chicken
from turkey meat is challenging since they are closely related
species and have a high degree of sequence homology. However,
in this study, chicken primer had 7 base differences in each sense
and antisense primer and 10 base differences in the probe when
compared to the turkey sequences. Similarly, the turkey primer
had 13 base differences in the sense primer, 6 base differences in
the antisense primer, and 7 base differences in the probe when
compared to the chicken sequences. Therefore, no cross-reaction
was observed and highly specific detection was carried out thanks
to the high specifity of the primer and probe designed. A
com-mon meat-specific PCR system was used to detect mammalian
and poultry species on the basis of a region of the 16 sRNA gene
to exclude probable false negative results. Thus, the amplification
control TaqMan probe system served for the purpose of checking
the quality of the nucleic acids extracted and could be applied
prior to the specific detection of chicken and turkey. Using the
common primer probe system, specific for mammals and poultry,
the DNA of all 7 species studied could be amplified and clearly
detected.
In the results of the sensitivity test, which was carried out
using a series of DNA dilutions from the chicken and turkey
species, in different concentrations varying between 0.0001% to
100% in water, both species were detected at the level of 0.0001%
(0.0001 ng DNA/<i>μ</i>L water) with TaqMan probe technique.
How-ever, in the conventional PCR method, the detection limit was
found to be 10 times lower (0.001%) than the real-time PCR
method. When reaction components or conditions are optimized
to detect lower levels, non-specific reactions with other tested
ani-mal species occur. As DNA concentration decreases, band intensity
also decreases; this situation enables semiquantitative detection by
Figure 3–The result of PCR specificity and sensitivity test and conventional PCR analysis of raw and heat-treated samples for the specific chicken
primers: M: Marker, H: Horse, D: Donkey, P: Pork, B: Bovine, S: Sheep, T: Turkey, D1-D6: 10-fold dilution of chicken DNA in water (D1: 100 ng DNA,
D2: 10 ng DNA, D3: 1 ng DNA, D4: 0.1 ng DNA, D5: 0.01 ng DNA, D6: 0.001 ng DNA), R1-R5: raw samples, A1-A5: Heat-treated samples at 100<b>◦</b>C, B1-B5:
Heat-treated samples at 150<b>◦</b><sub>C, C</sub>
1-C5: Heat-treated samples at 200<b>◦</b>C, (1: chicken 100%<b>+</b>beef 0%;2: chicken 10%<b>+</b>beef 90%;3: chicken 1%<b>+</b>
beef 99%;4: chicken 0.1%<b>+</b>beef 99.9%;5: chicken 0.01%<b>+</b>beef 99.99%).
Figure 4–The result of PCR specificity and sensitivity test and conventional PCR analysis of raw and heat-treated samples for the specific turkey primers:
M: Marker, H: Horse, D: Donkey, P: Pork, B: Bovine, S: Sheep, C: Chicken, T1-T6: 10-fold dilution of turkey DNA in water (D1: 100 ng DNA, D2: 10 ng DNA,
D3: 1 ng DNA, D4: 0.1 ng DNA, D5: 0.01 ng DNA, D6: 0.001 ng DNA), R1-R5: Raw samples, A1-A5: Heat-treated samples at 100<b>◦</b>C, B1-B5: Heat-treated
samples at 150<b>◦</b><sub>C, C</sub>
1-C5: Heat treated samples at 200<b>◦</b>C, (1: turkey 100%<b>+</b>beef 0%;2: turkey 10%<b>+</b>beef 90%;3: turkey 1%<b>+</b>beef 99%;4: turkey
</div>
<span class='text_page_counter'>(6)</span><div class='page_container' data-page=6>
C:
Fo
od
Chemistr
y
comparing standard concentrations of DNA with samples’ band
intensities.
No statistically significant difference was found in the ct values
obtained from the heat-treated samples compared to raw samples.
In the real-time PCR method, the chicken and turkey species
could be detected in all samples subjected to 100, 150, and 200<b>◦</b>C
at the level of 0.001%. Since the regions amplified with primers
designed specifically for chicken and turkey were shorter than
150 bp, therefore, they were considered not to be affected by
heat treatment. On the other hand, since the internal temperature
did not rise above 100 <b>◦</b>C in the oven-cooked samples under
normal atmosphere conditions, it was considered that even if a
temperature up to 200<b>◦</b>C was applied, DNA would not suffer
much damage. In addition, if heat processing is applied under
pressure (in autoclave), the damage is estimated to be more and ct
values are expected to rise. The ct values detected in nearly all raw
and heat-treated mixtures were 1 to 3 ct lower than that of the
values attained for the equivalent levels of DNA dilutions in water
(Table 1).
In the conventional PCR method, chicken and turkey species
in raw and heat-treated meat mixtures were detected up to the
level of 0.01%. While the heat processing did not have any
neg-ative effect on the detection of chicken and turkey species, the
detection limit was 10 times lower than that of the real-time PCR
method. The presence of undeclared species below 0.1% in meat
products is generally considered to be the result of accidental
con-tamination because it is not economical. Therefore, the detection
limits obtained using both conventional PCR and real-time PCR
are efficient enough to detect accidental contamination but since
the conventional PCR method is not quantitative, it can not
iden-tify meat species adulteration by either accidental or intentional
practice.
As a result, species specific real-time PCR assays developed in
this study showed a high linearity over a wide range of
tem-plate concentrations that enables a consistent and precise
deter-mination of target DNA within all tested meat mixtures. Purity
of nucleic acid templates is particularly important for real-time
PCR, since contaminants can interfere with fluorescence
detec-tion. Therefore, in this study, a commercial DNA isolation kit was
used to minimize errors that may have arisen from DNA
isola-tion. By the isolation method, where DNA is attached to a silica
matrix, both PCR inhibitors and impurities that result in false
positive results by causing probe degradation during the real-time
PCR assay were considered to be substantially removed. In this
study, commercial master mix was used in real-time PCR and
conventional PCR reactions. So, not only the time was saved
and but also the accuracy, repeatability, and its suitability for
the routine analysis were increased while the standardization was
simplified.
Conclusions
In this study, we developed real-time PCR techniques, for the
specific and quantitative detection of chicken and turkey species in
raw and heat-treated meat mixtures. Species specific primer–probe
sets were designed by using variability of the ND2 gene on
mito-chondrial DNA for both species. The detection limit in raw and
heat-treated meat samples for both species using the conventional
PCR technique was 10 times lower than that of the real-time
PCR technique.
Heat-treatment up to 200 <b>◦</b>C did not have any negative
ef-fect on the detection of either species. That the internal
tem-perature did not go over 100 <b>◦</b>C during heat processing
un-der normal atmosphere pressure was significant as well as the
fact that the size of the amplicon produced by the designed
primers, which was comparatively short (<i><</i>150 bp), influenced the
situation.
As a result of this study, the detection limit of both techniques
was sufficient to detect accidental contamination (<i><</i>0.1%) in meat
products. However, the real-time PCR method performed
bet-ter due to the fact that it was more sensitive, practical and less
time-consuming as well as providing quantitative data for labelling
purposes.
References
Alberts B, Bray D, Lewis J, Raff M, Robets K, Watson JD. 1994. Molecular biology of cell. 3rd
ed. New York and London: Gorland Publishing Inc.
Andrews CD, Berger RG, Mageau RP, Schwab B, Jhonston RW. 1992. Detection of the beef,
sheep, deer, and horse meat in cooked meat products by enzyme-linked immunosorbent assay.
J AOAC Int 75:572–6.
Ansfield M, Reaney SD, Jackamn R. 2000. Production of a sensible immunoassay for detection
of ruminant and porcine proteins, heated to<i>></i>130<b>◦</b>C at 2.7 bar, in compound animal feedstuff.
Food Agric Immunol 12:273–84.
Calvo JH, Zaragoza P, Osta R. 2001. Random amplified polymorphic DNA fingerprints for
identification of species in poultry pˆat´e. Poul Sci 80:522–4.
Chung GS, Lee MH, Kim JM, Park JM. 1998 Differentiation the species of origin of meats on
the basis of the contents of histidine dipeptides in muscle. J Vet Sci 40:1–6.
Cota-Rivas M, Vallejo-Cordoba BV. 1997.Capillary electrophoresis for meat species
differenti-ation. J Capil Electrophor 4(4):195–9.
Dooley JJ, Paine KE, Garrett SD, Brown HM. 2004. Detection of meat species using TaqMan
real-time PCR assays. Meat Sci 68:431–8.
Girish PS, Anjaneyulu ASR, Viswas KN, Santhosh FH, Bhilegaonkar KN, Agarwal RK,
Kondaiah N, Nagappa K. 2007. Polymerase chain reaction–restriction fragment length
poly-morphism of mitochondrial 12S rRNA gene: a simple method for identification of poultry
meat species. Vet Res Comm 31:447–55.
Hayashi J, Walle MJVD. 1985. Absence of extensive recombination between inter and intraspecies
mitochondrial DNAin mammalian cells. Experim Cell Res 160:387–95.
Heptinstall J, Rapley R. 2002. Spectrophotometric analysis of nucleic acids. In R. Rapley, editor.
The nucleic acid protocols handbook. pp. 57–60. Totowa, N.J.:Humana Press.
Herman L. 2001. Determination of animal origin of raw food by species-species PCR. J Dairy
Res 68:429–36.
Higgins DG, Bleasby AJ, Fuchs R. 1992. CLUSTAL W: improved software for multiple sequence
alignment. Comp Appl Biosci 8:4420–49.
Hird H, Chisholm J, Brown J. 2005. The detection of commercial duck species in food using
a single probe-multiple species-specific primer real-time PCR assay. Eur Food Res Technol
221:559–63.
Holland PM, Abramson RD, Watson R, Gelfand DH. 1991. Detection of specific polymerase
chain reaction product by utilizing the 5’- 3’ exonuclease activity of Termus aquaticus DNA
polymerase. Proc Nat Acad Sci 88:7276–80.
Hopwood AJ, Fairbrother KS, Lockley AK, Bardsley RG. 1999. An actin gene-related
poly-merase chain reaction (PCR) test for identification of chicken in meat mixtures. Meat Sci
53(4):227–31.
Jonker KM, Tilburg JJHC, HăaGele GH, De Boer E. 2008. Species identification in meat products
using real-time PCR. Food Add Contam 25(5):527–33.
Kang’ethe EK, Gathuma JM, Lindqvist KJ. 1986. Identification of the species of origin of fresh,
cooked and canned meat on meat products using antisera to thermostable muscle antigens by
Ouchterlony’s double diffusion test. J Sci Food Agric 37:157–62.
Kesmen Z, Gulluce A, Sahin F, Yetim H. 2009. Identification of meat species by TaqMan-based
real-time PCR assay. Meat Sci 82:444–9.
Kesmen Z, Sahin F, Yetim H. 2007. PCR assay for the identification of animal species in cooked
sausages. Meat Sci 77(4):649–53.
Kocher TD, Thomas WK, Meyer A, Edwards SV, Păaăabo S, Villablanca FX, Wilson AC. 1989.
Dynamics of mitochondrial DNA evolution in animals: amplification and sequencing with
conserved primers. Proc Nat Acad Sci USA 86:6196200.
K ăoppel R, Ruf J, Rentsch J. 2011. Multiplex real-time PCR for the detection and
quan-tification of DNA from beef, pork, horse and sheep. Eur Food Res Technol 232:
151–5.
Laube I, Zagon J, Spiegelberg A, Butschke A, Kroh LW, Broll H. 2007. Development and design
of a ‘ready-to-use’ reaction plate for a PCR-based simultaneous detection of animal species
used in foods. Int J Food Sci Technol 42:9–17.
L ´opez-Andreo M, Garrido-Pertierra A, Puyet A. 2006. Evaluation of postpolymerase chain
reaction melting temperature analysis for meat species identification in mixed DNA samples.
J Agric Food Chem 54(21):7973–8.
Mane BG, Mendiratta SK, Tiwari AK. 2009. Polymerase chain reaction assay for identification
of chicken in meat and meat products. Food Chem 116:806–10.
Mart´ın I, Garc´ıa T, Fajardo V, Rojas M, Pegels N, Hern´andez PE, Mart´ın IG. 2009.
SYBR-Green real-time PCR approach for the detection and quantification of pig DNA in feedstuffs.
Meat Sci 82:252–9.
Monteil-Sosa JF, Ruiz-Pesini E, Montoya J, Roncales P, L ´opez-P´erez MJ, P´erez-Martos
A. 2000. Direct and highly species-specific detection of pork meat and fat in meat
products by PCR amplification of mitochondrial DNA. J Agric Food Chem 48:
282932.
ă
Ozgen-Arun O, Ugur M. 2000. Animal species determination in sausages using an SDS–PAGE
technique. Archiv fur Lebensmittelhygiene 51:49–53.
Palmieri L, Bozza E, Giongo L. 2009. Soft fruit traceability in food matrices using real-time
PCR. Nutrients 1:316–28.
</div>
<span class='text_page_counter'>(7)</span><div class='page_container' data-page=7>
C:
Fo
od
Chemistr
y
in foie gras by species-specific polymerase chain reaction. J Agric Food Chem 51:
1524–9.
Rodriguez MA, Garc´ıa T, Gonz´alez I, Hern´andez PE, Mart´ın R. 2005. TaqMan real-time PCR
for detection and quantitation of pork in meat mixtures. Meat Sci 70:113–20.
Rojas M, Gonz´alez I, Pav ´on M ´A, Pegels N, Hern´andez PE, Garc´ıa T, Mart´ın R. 2011.
Appli-cation of a real-time PCR assay for the detection of ostrich (<i>Struthio camelus</i>) mislabelling in
meat products from the retail market. Food Control 22(3–4):523–31.
Saez R, Sanz Y, Toldr´a F. 2004.PCR-based fingerprinting techniques for rapid detection of
animal species in meat products. Meat Sci 66:659–65.
Sawyer J, Wood C, Shanahan D, Gout S, McDowell D. 2003. Real-time PCR for quantitative
meat species testing. Food Cont 14:579–83.
Skarpeid HJ, Kvaal K, Hildrum KI. 1998. Identification of animal species in ground meat
mix-tures by multivariate analysis of isoelectric focusing protein profiles. Electrophoresis 19:3103–9.
Tanabe S, Hase M, Yano T, Sato M, Fujimura T, Akiyama H. 2007. Real-time quantitative PCR
detection method for pork, chicken, beef, mutton, and horseflesh in foods. Biosci Biotechnol
Biochem 71:3131–5.
Yusop MHM, Mustafa S, Che Man YB, Omar AR, Mokhtar NFK. 2011. Detection of raw
pork targeting porcine-specific mitochondrial cytochrome b gene by molecular beacon probe
real-time polymerase chain reaction. Food Anal Meth. DOI:10.1007/s12161-011-9260-y.
Walker JA, Hughes DA, Anders BA, Shewale J, Sinha SK, Batzer MA. 2003. Quantitative
intra-short interspersed element PCR for species-specific DNA identification. Anal Biochem
316:259–69.
</div>
<!--links-->