Tài liệu TRADE 1999 ppt
Bạn đang xem bản rút gọn của tài liệu. Xem và tải ngay bản đầy đủ của tài liệu tại đây (57.63 KB, 15 trang )
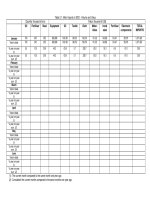
Table 2.1: Main Imports in 1999 - Volume and Value.
(Quantity: thousand of
tons)
(Value: thousand of US$)
Oil Fertiliser Steel Equipment Oil Textile Cloth Computer Iron&
steel
Fertiliser Electronic
components
TOTAL
IMPORTS
January
521 277 78 134,721 58,263 62,772 33,407 5,731 21,701 33,077 36,717 764,689
Year to date
521 277 78 134,721 58,263 62,772 33,407 5,731 21,701 33,077 36,717 764,689
% year on year (1)
14.9 45.3 -22.2 -20.8 -9.2 22.8 13.0 -62.4 -39.3 19.6 26.8 -5.6
% year on year
cum. (2)
14.9 45.3 -22.2 -20.8 -9.2 22.8 13.0 -62.4 -39.3 19.6 26.8 -5.6
February
526 214 124 116,142 53,399 52,184 29,273 5,671 33,035 27,173 33,825 652,151
Year to date
1047 491 202 250,863 111,662 114956 62,680 11,402 54,736 60,250 70,542 1,416,840
% year on year (1)
-18.6 23.2 29.6 -4.5 -38.0 4.5 -16.2 -35.2 -12.3 14.3 170.5 -21.6
% year on year
cum. (2)
-4.8 34.8 3.0 -14.0 -25.7 13.7 -2.8 -52.4 -25.5 17.1 70.2 -13.7
March
808 340 184 174,,023 79,307 82,655 46,910 11,512 46,380 40,643 42,237 983,366
Year to date
1,855 831 386 424885 190,969 197,611 109,589 22,914 101,116 100,893 112,779 2,400,206
% year on year (1)
13.5 18.4 51.0 11.5 -2.3 13.4 -18.7 -0.4 9.0 10.1 201.4 3.4
% year on year
cum. (2)
2.4 27.5 21.5 -5.1 -17.5 13.6 -10.3 -35.5 -12.8 14.2 103.3 -7.4
April
534 435 232 167,166 68,002 101,752 48,219 8,988 60,311 56,924 38,424 964,573
Year to date
2,390 1,266 619 592,051 258,971 299,363 157,809 31,902 161,427 157,816 151,203 3,364,759
% year on year (1)
8.9 94.4 8.3 -9.8 3.3 46.4 -25.0 -94.1 -2.9 73.7 228.6 -11.7
% year on year
cum. (2)
3.8 44.6 16.1 -6.5 -12.9 23.0 -15.4 -83.1 -9.4 30.3 125.1 -8.7
May
501 277 187 152,930 65,882 107,380 61,354 6,944 53,045 31,639 30,073 922,330
Year to date
2,891 1,543 805 744,981 324,854 406,743 219,163 38,846 214,472 189,455 181,276 4,287,108
% year on year (1)
-19.5 -36.1 -1.9 -2.7 -17.2 53.3 -19.3 -82.8 -5.5 -53.7 186.3 -10.7
% year on year
cum. (2)
-1.1 17.9 11.4 -5.7 -13.8 29.8 -16.5 -83.1 -8.4 0.0 133.4 -9.1
June
707 471 260 184,649 92,043 99,554 49,177 7,153 64,496 63,478 36,228 1,015,486
Year to date
3,598 2,014 1,065 929,630 416,896 506,297 268,340 46,000 278,967 252,933 217,504 5,302,595
% year on year (1)
16.7 4.9 43.0 0.0 25.6 74.1 -26.5 -78.4 19.9 3.1 333.5 -16.9
% year on year
cum. (2)
1.9 14.6 17.7 -4.6 -7.4 36.6 -18.5 -82.5 -3.1 0.8 152.8 -10.8
Table 2.1: Main Imports in 1999 - Volume and Value.
(Quantity: thd of tons) (Value: thousand of US$)
Oil Fertiliser Steel Equip-
ment
Oil Textile Cloth Computer Iron&
steel
Fertiliser Electronic
components
TOTAL
IMPORTS
July
635 302 188 175,963 80,055 97,924 47,323 10,144 48,517 38,539 49,269 992,279
Year to date
4,233 2,316 1,253 1,105,594 496,951 604,221 315,663 56,144 327,484 291,472 266,773 6,294,873
% year on year (1)
10.6 14.3 32.3 25.7 16.3 89.3 17.5 -74.9 7.1 16.1 381.4 7.1
% year on year
cum. (2)
3.1 14.5 19.7 -0.8 -4.2 43.1 -14.6 -81.5 -1.7 2.6 177.1 -8.3
August
541 318 221 155,522 87,227 79,405 30,181 8,662 52,893 39,160 39,581 943,728
Year to date
4,774 2,634 1,474 1,261,115 584,179 683,627 345,843 64,806 380,377 330,633 306,354 7,238,601
% year on year (1)
-5.3 88.8 63.5 -4.3 43.9 56.3 -16.9 -77.9 33.7 80.0 560.5 13.9
% year on year
cum. (2)
2.1 20.2 24.7 -1.3 0.8 44.5 -14.8 -81.0 2.0 8.1 199.6 -6.0
September
592 346 250 168,096 103,738 92,259 34,982 10,068 60,814 43,303 41,676 987,733
Year to date
5,366 2,980 1,725 1,429,211 687,917 775,886 380,826 74,874 441,191 373,935 348,030 8,226,334
% year on year (1)
0.3 135.7 142.9 -8.2 54.0 67.9 -20.6 -74.8 101.2 129.1 335.8 9.5
% year on year
cum. (2)
1.9 27.5 34.2 -2.1 6.3 46.9 -15.4 -80.4 9.5 15.1 211.3 -4.3
October
608 393 187 186,425 109,052 103,837 42,442 10,260 49,577 43,862 56,638 1,049,862
Year to date
5,974 3,373 1,912 1,615,637 796,969 879,723 423,268 85,134 490,768 417,797 404,668 9,276,196
% year on year (1)
9.3 41.0 57.3 1.0 61.6 107.1 -5.2 -80.9 49.8 21.7 654.3 17.3
% year on year
cum. (2)
2.6 28.9 36.2 -1.8 11.6 52.1 -14.5 -80.5 12.5 15.8 239.1 -2.3
November
670 198 175 194,412 118,762 106,943 45,052 12,135 48,027 19,709 63,652 1,159,240
Year to date
6,644 3,571 2,086 1,810,048 915,731 986,666 468,320 97,270 538,795 437,506 468,320 10,435,436
% year on year (1)
63.8 -41.9 20.3 8.9 143.0 81.3 -14.2 -73.4 22.4 -58.6 963.4 30.4
% year on year
cum. (2)
6.6 20.8 34.7 -0.7 20.0 54.8 -14.4 -79.8 13.3 7.1 273.7 0.5
December
759 211 178 194,921 138,160 109,134 36,962 15,059 47,928 26,514 49,479 1,187,021
Year to date
7,403 3,782 2,264 2,004,969 1,053,890 1,095,800 505,282 112,329 586,723 464,019 517,799 11,622,457
% year on year (1)
26.8 -57.5 -4.3 -14.7 115.5 50.6 -18.2 -66.9 -0.5 -60.0 397.0 6.8
% year on year
cum. (2)
8.4 9.5 30.5 -2.3 27.4 54.4 -14.7 -78.7 12.1 -2.2 282.8 1.1
Socio-economic statistical bulletin - UNDP
Chart 2.1.1
Socio-economic statistical bulletin - UNDP
Main Imports in 1999
Year to date (December)
-
50
100
150
200
250
Jan Feb Mar Apr May Jun Jul Aug Sept Oct Nov Dec
USD million
Equipment Oil Textile Cloth
Computer Iron & steel Fertiliser Elec. components
Chart 2.1.2
Socio-economic statistical bulletin - UNDP
Share of main imports in total imports in 1999
Year to date (December)
Equipment
16%
Other
49%
Elec. components
4%
Fertiliser
4%
Textile
9%
Oil
8%
Iron & steel
5%
Cloth
4%
Computer
1%
Chart 2.1.3
Socio-economic statistical bulletin - UNDP
Top ten import Partners in 1999
Year to date (November)
250
272
323
459
521
541
1,273
1,302
1,367
1,683
- 200 400 600 800 1,000 1,200 1,400 1,600 1,800
France
Malaysia
US
Thailand
China
Hong Kong (China)
South Korea
Japan
Taiwan (China)
Singapore
USD million
Chart 2.1.4
Socio-economic statistical bulletin - UNDP
Share of top ten import partners in total imports in 1999
Year to date (November)
Malaysia
3%
US
4%
Hong Kong (China)
7%
South Korea
16%
Japan
16%
Taiwan (China)
17%
Singapore
21%
China
7%
Thailand
6%
France
3%