Tài liệu Trade 2002 pptx
Bạn đang xem bản rút gọn của tài liệu. Xem và tải ngay bản đầy đủ của tài liệu tại đây (39.92 KB, 11 trang )
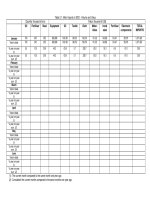
Table 2.1: Main Imports in 2002 - Volume and Value.
(Quantity: thousand of tons) (Value: thousand of US$)
Oil Fertiliser Steel Equipment Oil Textile Cloth Motor-
bikes
Iron&
steel
Fertiliser Electronic
components
TOTAL
IMPORTS
January
703 245 252 266,386 109,182 93,672 50,076 15,122 64,062 31,447 35,570 1,271,420
Year to date
703 245 252 266,386 109,182 93,672 50,076 15,122 64,062 31,447 35,570 1,271,420
% year on year
(1)
5.5 10.5 30.8 49.2 -23.6 5.7 228.7 -20.2 18.3 6.8 -21.0 20.9
% year on year
cum. (2)
5.5 10.5 30.8 49.2 -23.6 5.7 228.7 -20.2 18.3 6.8 -21.0 20.9
February
Year to date
% year on year
(1)
% year on year
cum. (2)
March
Year to date
% year on year
(1)
% year on year
cum. (2)
April
Year to date
% year on year
(1)
% year on year
cum. (2)
May
Year to date
% year on year
(1)
% year on year
cum. (2)
June
Year to date
% year on year
(1)
% year on year
cum. (2)
(1): The current month compared to the same month one year ago
(2): Cumulated: the current months compared to the same months one year ago.
(Quantity: thousand of tons) (Value: thousand of US$)
Oil Fertiliser Steel Equipment Oil Textile Cloth Motor-
bikes
Iron&
steel
Fertiliser Electronic
components
TOTAL
IMPORTS
July
Year to date
% year on year
(1)
% year on year
cum. (2)
August
Year to date
% year on year
(1)
% year on year
cum. (2)
September
Year to date
% year on year
(1)
% year on year
cum. (2)
October
Year to date
% year on year
(1)
% year on year
cum. (2)
November
Year to date
% year on year
(1)
% year on year
cum. (2)
December
Year to date
% year on year
(1)
% year on year
cum. (2)
(1): The current month compared to the same month one year ago
(2): Cumulated: the current months compared to the same months one year ago.
Chart 2.1.1
Socio-economic statistical bulletin - UNDP
Main Imports in 2002
Year to date (January)
-
50
100
150
200
250
300
Jan Feb Mar Apr May Jun Jul Aug Sept. Oct Nov Dec
USD million
Equipment Oil Textile Cloth Elec. components Iron & steel Fertiliser Motorbikes
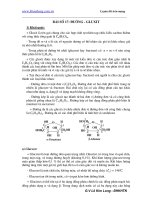
Chart 2.1.2
Socio-economic statistical bulletin - UNDP
Share of main imports in total imports in 2002
Year to date
(January)
Other
48%
Equipment
21%
Elec. components
3%
Cloth
4%
Iron & steel
5%
Oil
9%
Textile
7%
Fertiliser
2%
Motorbikes
1%
Chart 2.1.5
Socio-economic statistical bulletin - UNDP
Total Imports in 2001 and 2002
-
200
400
600
800
1,000
1,200
1,400
Jan Feb March April May June July Aug Sept Oct Nov Dec
USD million
2001 2002