Tài liệu Trade 2000 pdf
Bạn đang xem bản rút gọn của tài liệu. Xem và tải ngay bản đầy đủ của tài liệu tại đây (52.85 KB, 11 trang )
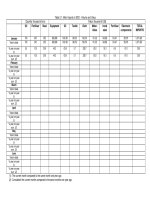
Table 2.1: Main Imports in 2000 - Volume and Value.
(Quantity: thousand of tons) (Value: thousand of US$)
Oil Fertiliser Steel Equipment Oil Textile Cloth Motor-
bikes
Iron&
steel
Fertiliser Electronic
componen
ts
TOTAL
IMPORTS
January
630 193 196 228,188 121,593 97,918 25,530 40,267 53,490 20,409 49,501 104,450
Year to date
630 193 196 228,188 121,593 97,918 25,530 40,267 53,490 20,409 49,501 104,450
% year on year
(1)
20.9 -30.4 150.4 69.4 108.7 56.0 -23.6 49.4 146.5 -38.3 34.8 -86.3
% year on year
cum. (2)
20.9 -30.4 150.4 69.4 108.7 56.0 -23.6 49.4 146.5 -38.3 34.8 -86.3
February
557 282 170 207,734 121,110 70,601 21,936 27,724 50,457 31,820 51,562 950,168
Year to date
1,186 474 366 435,922 242,703 168,519 47,466 67,991 103,946 52,229 101,063 2,054,618
% year on year
(1)
5.9 31.6 37.7 78.9 126.8 35.3 -25.1 138.4 52.7 17.1 52.4 45.7
% year on year
cum. (2)
13.3 -3.4 81.3 73.8 117.4 46.6 -24.3 76.2 89.9 -13.3 43.3 45.0
March
664 449 227 206,014 162,351 100,715 24,588 48,659 65,567 55,609 53,609 1,215,462
Year to date
1,850 924 594 641,936 405,054 269,234 72,053 116,650 169,513 107,838 154,672 3,270,080
% year on year
(1)
-17.9 32.0 23.5 18.4 104.7 21.8 -47.6 110.3 41.4 36.8 26.9 23.6
% year on year
cum. (2)
-0.3 11.1 53.7 51.1 112.1 36.2 -34.3 89.0 67.6 6.9 37.1 36.2
April
765 211 225 169,763 171,75 106,575 25,934 38,278 64,843 24,721 61,475 1,166,428
Year to date
2,616 1,134 819 811,700 576,808 375,809 97,988 154,928 234,355 132,559 216,147 4,436,508
% year on year
(1)
43.2 -51.5 -3.1 1.6 152.6 4.7 -46.2 56.2 7.5 -56.6 60.0 20.9
% year on year
cum. (2)
9.5 -10.4 32.4 37.1 122.7 25.5 -37.9 79.7 45.2 -16.0 43.0 31.9
May
871 363 269 232,577 187,965 128,162 37,317 51,907 81,240 49,680 59,573 1,367,400
Year to date
3,487 1,497 1,088 1,044,276 764,773 503,971 135,304 206,835 315,595 182,240 275,720 5,803,908
% year on year
(1)
74 31 44 52 185 19 -39 144 53 57 98 48
% year on year
cum. (2)
21 -3 35 40 135 24 -38 92 47 -4 52 35
June
1,038 383 242 195,340 208,010 107,809 29,376 59,107 72,983 46,219 61,708 1,341,657
Year to date
4,525 1,880 1,330 1,239,616 972,782 611,780 164,680 265,942 388,578 228,458 337,428 7,145,565
% year on year
(1)
47 -19 -7 6 126 8 -40 138 13 -27 70 32
% year on year
cum. (2)
26 -7 25 33 133 21 -39 101 39 -10 55 35
(1): The current month compared to the same month one year ago
(2): Cumulated: the current months compared to the same months one year ago.
(Quantity: thousand of tons) (Value: thousand of US$)
Oil Fertilise
r
Steel Equipment Oil Textile Cloth Motor-
bikes
Iron&
steel
Fertiliser Electroni
c
compone
nts
TOTAL
IMPORTS
July
693 292 240 197,422 155,525 113,574 23,841 53,194 70,066 36,969 58,405 1,242,233
Year to date
5,218 2,172 1,570 1,437,038 1,128,308 725,354 188,521 319,137 458,645 265,427 395,832 8,387,798
% year on year
(1)
9 -4 28 12 94 16 -50 67 44 -4 19 25
% year on year
cum. (2)
23 -6 25 30 127 20 -40 94 40 -9 48 33
August
582 428 225 194,543 147,524 106,739 23,269 68,651 66,542 56,527 62,802 1,304,541
Year to date
5,800 2,600 1,795 1,631,581 1,275,832 832,094 211,790 387,788 525,187 321,954 458,634 9,692,338
% year on year
(1)
7.7 34.5 1.8 25.1 69.1 34.4 -22.9 105.5 25.8 44.3 58.7 38.2
% year on year
cum. (2)
21.5 -1.3 21.7 29.4 118.4 21.7 -38.8 96.2 38.1 -2.6 49.7 33.9
September
690 386 185 161,982 196,611 109,207 22,648 90,477 51,918 51,015 61,633 1,287,598
Year to date
6,490 2,986 1,979 1,793,563 1,472,443 941,301 234,438 478,265 577,105 372,969 520,267 10,979,936
% year on year
(1)
16.5 11.4 -26.2 -3.6 89.5 18.4 -35.3 159.9 -14.6 17.8 47.9 30.4
% year on year
cum. (2)
21.0 0.2 14.8 25.5 114.0 21.3 -38.4 105.8 30.8 -0.3 49.5 33.5
October
548 352 212 286,941 152,169 116,758 25,370 80,496 60,715 49,385 77,283 1,412,382
Year to date
7,038 3,338 2,191 2,080,504 1,624,613 1,058,059 259,809 558,761 637,821 422,355 597,550 12,392,319
% year on year
(1)
-9.9 -10.3 13.2 53.9 39.5 12.4 -40.2 58.1 22.5 12.6 36.5 34.5
% year on year
cum. (2)
17.8 -1.0 14.6 28.8 103.8 20.3 -38.6 97.2 30.0 1.1 47.7 33.6
November
951 324 249 201,334 248,087 145,815 29,281 70,187 68,548 43,509 67,816 1,400,453
Year to date
7,988 3,662 2,440 2,281,838 1,872,699 1,203,874 289,090 628,948 706,368 465,863 665,366 13,792,772
% year on year
(1)
41.9 63.4 42.8 3.6 108.9 36.3 -35.0 29.4 42.7 120.8 6.5 20.8
% year on year
cum. (2)
20.2 2.5 17.0 26.1 104.5 22.0 -38.3 86.3 31.1 6.5 42.1 32.2
December
789 312 427 289,184 185,286 217,789 24,240 158,152 105,539 42,674 82,480 1,842,470
Year to date
8,777 3,973 2,868 2,571,022 2,057,985 1,421,662 313,330 787,100 811,907 508,537 747,847 15,635,242
% year on year
(1)
3.9 47.6 140.0 48.4 34.1 99.6 -34.4 156.8 120.2 61.0 66.7 55.2
% year on year
cum. (2)
18.6 5.1 26.7 28.2 95.3 29.7 -38.0 97.2 38.4 9.6 44.4 34.5
(1): The current month compared to the same month one year ago
(2): Cumulated: the current months compared to the same months one year ago.
Chart 2.1.1
Socio-economic statistical bulletin - UNDP
Main Imports in 2000
Year to date (December)
-
50
100
150
200
250
300
350
Jan Feb Mar Apr May Jun Jul Aug Sept. Oct Nov Dec
USD million
Equipment Oil Textile Cloth Elec. components Iron & steel Fertiliser Motorbikes
Chart 2.1.2
Socio-economic statistical bulletin - UNDP
Share of main imports in total imports in 2000
Year to date (December)
Other
42%
Equipment
16%
Motorbikes
5%
Fertiliser
3%
Textile
9%
Oil
13%
Iron & steel
5%
Cloth
2%
Elec. components
5%
Chart 2.1.5
Socio-economic statistical bulletin - UNDP
Total Imports in 1999 and 2000
-
2,000
4,000
6,000
8,000
10,000
12,000
14,000
16,000
18,000
Jan Feb March April May June July Aug Sept Oct Nov Dec
USD million
1999 2000