Tài liệu Điện thoại di động mạng lưới Radio P2 doc
Bạn đang xem bản rút gọn của tài liệu. Xem và tải ngay bản đầy đủ của tài liệu tại đây (2.41 MB, 93 trang )
2
System Aspects
2.1 Fundamentals of Radio Transmission
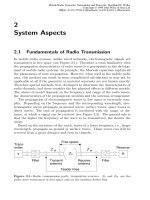
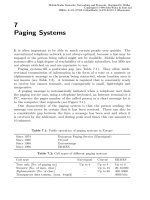
In mobile radio systems, unlike wired networks, electromagnetic signals are
transmitted in free space (see Figure 2.1). Therefore a total familiarity with
the propagation characteristics of radio waves is a prerequisite in the develop-
ment of mobile radio systems. In principle, the Maxwell equations explain all
the phenomena of wave propagation. However, when used in the mobile radio
area, this method can result in some complicated calculations or may not be
applicable at all if the geometry or material constants are not known exactly.
Therefore special methods were developed to determine the characteristics of
radio channels, and these consider the key physical effects in different models.
The choice of model depends on the frequency and range of the radio waves,
the characteristics of the propagation medium and the antenna arrangement.
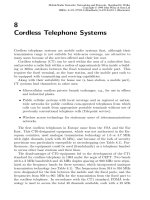
The propagation of electromagnetic waves in free space is extremely com-
plex. Depending on the frequency and the corresponding wavelength, elec-
tromagnetic waves propagate as ground waves, surface waves, space waves or
direct waves. The type of propagation is correlated with the range, or dis-
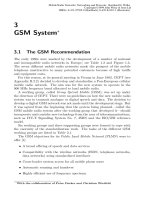
tance, at which a signal can be received (see Figure 2.2). The general rule is
that the higher the frequency of the wave to be transmitted, the shorter the
range.
Based on the curvature of the earth, waves of a lower frequency, i.e., larger
wavelength, propagate as ground or surface waves. These waves can still be
received from a great distance and even in tunnels.
T
R
mitter
Trans-
FilterFilter
Receiver
Feeder lines
W W
Z
0
Z
Z
Free space
antenna
Receive
antenna
Transmit
Figure 2.1: Radio transmission path: transmitter–receiver. Z
0
and Z
W
are the
radio wave resistances in free space and on the antenna feeder link
Mobile Radio Networks: Networking and Protocols. Bernhard H. Walke
Copyright © 1999 John Wiley & Sons Ltd
ISBNs: 0-471-97595-8 (Hardback); 0-470-84193-1 (Electronic)
28 2 System Aspects
30 kHz 300 kHz 3 MHz 30 MHz 300 MHz 3 GHz 30 GHz frequency
EHFSHFUHFVHFHFMFLF
Submarine
surface waves
Ground /
1000 km Radio horizon
Radar
Space waves
Radio
Navigation
Data, Radio and
Television Broadcasting
Line-of-Sight Radio
Satellite Radio
Space waves
Geom. horizon
Direct waves
100-150 km
Figure 2.2: Propagation and range of electromagnetic waves in free space
In the higher frequencies it is usually space waves that form. Along with
direct radiation, which, depending on the roughness and the conductivity
of the earth’s surface, is quickly attenuated, these waves are diffracted and
reflected based on their frequency in the troposphere or in the ionosphere.
The range for lower frequencies lies between 100 and 150 km, whereas it
decreases with higher frequencies because of the increasing transparency of the
ionosphere, referred to as the radio horizon. When solar activity is intense,
space waves can cover a distance of several thousand kilometres owing to
multiple reflection on the conductive layers of the ionosphere and the earth’s
surface.
Waves with a frequency above 3 GHz propagate as direct waves, and con-
sequently can only be received within the geometric (optical) horizon.
Another factor that determines the range of electromagnetic waves is their
power. The field strength of an electromagnetic wave in free space decreases
in inverse proportion to the distance to the transmitter, and the receiver input
power therefore fades with the square of the distance. The received power for
omnidirectional antennas can be described on the basis of the law of free-space
propagation.
An ideal point-shaped source, a so-called isotropic radiator of signal en-
ergy, transmits its power P
T
uniformly distributed into all directions. Such a
transmitter cannot be realized physically. The power density flow F through
the surface of a sphere at a distance d from an ideal radiator (see Figure 2.3)
can be expressed as
F =
P
T
4πd
2
[W/m
2
] (2.1)
In most cases antennas are used that focus the radiated power into one
direction. The resultant antenna gain g(Θ) into the direction Θ is expressed
by the radiated power normalized to the mean power, where P
0
represents the
total transmit power emitted from the antenna.
g(Θ) =
P (Θ)4π
P
0
(2.2)
2.1 Fundamentals of Radio Transmission 29
Distance d
Area
Isotropic
source
Figure 2.3: Power density flow F
The maximum signal energy radiated from the antenna is transmitted into the
direction of the main lobe. The maximum antenna gain g
max
at Θ = 0 gives
the amplification measure in comparison with an isotropic radiator using the
same signal energy.
According to Equation (2.1), the power density flow of an ideal loss-less
antenna with gain g
T
is
F =
P
T
g
T
4πd
2
[W/m
2
] (2.3)
The product P
T
g
T
is called EIRP (Effective Isotropically Radiated Power).
This is the transmit power necessary with an omnidirectional isotropic ra-
diator to reach the same power density flow as with a directional antenna
diagramme.
The energy arriving at the receiver is
P
R
= P
T
g
T
g
R
λ
4πd
2
(2.4)
In Equation (2.4) P
T
represents the power radiated by the transmitter and
P
R
the input power of the receiver. g
T
and g
R
stand for the corresponding
absolute antenna gains. λ is the wavelength and d the distance between sender
and receiver.
The free-space path loss
L =
λ
4πd
2
(2.5)
describes the spatial diffusion of the transmitted energy over a path of length
d, and g
R
is the receive antenna gain.
In a logarithmic representation this produces the path loss (P
T
− P
R
)
L
F
= −10 log g
T
− 10 log g
R
+ 20 log f + 20 log d − 20 log
c
4π
with c representing the wave propagation speed.
In a simple case scenario with isotropic antennas the free-space attenuation
L
0
is produced without antenna gain as the difference between received power
and radiated power:
30 2 System Aspects
L
0
[dB] = P
R
[dBm] − P
T
[dBm] = −10 log
P
R
[mW]
P
T
[mW]
= −20 log
λ
4πd
(2.6)
2.1.1 Attenuation
Weather conditions cause changes to the atmosphere, which in turn affect
the propagation conditions of waves. Attenuation is frequency-dependent and
has a considerable affect on some frequencies, and a lesser one on others. For
example, in the higher-frequency ranges above about 12 GHz attenuation is
strong when it is foggy or raining because of the scattering and absorption of
electromagnetic waves on drops of water.
Figure 2.4 shows the frequency-dependent attenuation of radio waves with
horizontal free-space propagation in which, as applicable, the appropriate at-
tenuation values for fog (B) or rain of different intensity (A) still need to
be added to the gaseous attenuation (curve C). What is remarkable are the
resonant local attenuation maxima caused by water vapour (at 23, 150, etc.,
GHz) or oxygen (at 60 and 110 GHz).
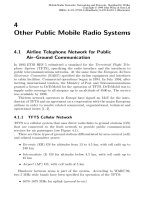
Based on 60 GHz as an example, Figure 2.5 shows the propagation atten-
uation and the energy per symbol E
s
related to N
0
(noise power), referred to
as the signal-to-noise ratio, for antenna gain of g
T
= g
R
= 18 dB. These gains
are achieved with directional antennas with approximately 20
◦
· 20
◦
beam
angles. The electric transmit power in the example is 25 mW, thereby pro-
ducing the value 2 dBW = 1.6 W for the radiated microwave power (EIRP).
The ranges which can be achieved are 800 m in good weather conditions and
500 m in rainy conditions (50 mm/h).
2.1.2 Propagation over Flat Terrain
Free-space propagation is of little practical importance in mobile communica-
tions, because in reality obstacles and reflective surfaces will always appear in
the propagation path. Along with attenuation caused by distance, a radiated
wave also loses energy through reflection, transmission and diffraction due to
obstacles.
A simple calculation [27] can be carried out for a relatively simple case
scenario: two-path propagation over a reflecting surface (see Figure 2.6). In
this case
P
R
P
T
= g
T
g
R
h
1
h
2
d
2
2
d h
1
, h
2
is a frequency-independent term. The corresponding path loss L
P
is
L
P
= −10 log g
T
− 10 log g
R
− 20 log h
1
− 20 log h
2
+ 40 log d
2.1 Fundamentals of Radio Transmission 31
Temperature:
Water vapour:
Sea level: 1 atm (1013.16 mbar)
20
C: Gaseous
2
10
3
0.1 g/m
3
A: Rain
2
10
100
O
2
H O
2
H O
2
Pressure:
O
C
2
7.5 g / m
B: Fog
O
m
H
3
µ
Wavelength:
Centimetre Millimetre
10 cm 1 cm 1 mmλ
Submillimetre
0.01
0.1
1
10
100
0.02
0.05
0.2
0.5
2
5
20
50
200
500
525 2 5 2 5
Frequency (GHz)
Specific attenuation (dB / km) for a horizontal path
10
A
A
A
A
A
B
B
B
C
C
150 mm/h
50 mm/h
25 mm/h
0.25 mm/h
Figure 2.4: Attenuation of radio propagation depending on the frequency due to
gaseous constituents and precipitation for transmission through the atmosphere,
(from CCIR Rep. 719, 721)
32 2 System Aspects
E N
/
= 18 dB
= 18 dB
2
) / [dB]
0s
Signal-to-noise ratio (
10
Path loss / dB
Path loss at 60 GHz
90
100
110
120
130
140
150
160
170
60
50
40
30
20
10
0
-10
Gain
Free-space propagation
Distance / m
800 m (good weather)500 m (rain)
3 4 5 6 7 8 9 98765432
Rain plus oxygen
+32 dB
Oxygen attenuation
+15 dB
2 3
10
3
Noise figure
Data rate
= 10 dB
= 1 Mbit/s
g
R
T
F
R
g
= 25 mWTransmit power P
T
Figure 2.5: Attenuation due to weather conditions
h
h
1
h
2
+
h
1
h
1
h
2
d
-
2
h
2
Reflected wave
φ
θ
θ
Figure 2.6: Model for two-path propagation due to reflection
and with isotropic antennas
L
F
dB
= 120 − 20 log
h
1
m
− 20 log
h
2
m
+ 40 log
d
km
(2.7)
In this model the receive power decreases much faster (∼ 1/d
4
) than with
free-space propagation (∼ 1/d
2
). This also depicts the reality of a mobile radio
environment more closely but does not take into account the fact that actual
ground surfaces are rough, therefore causing wave scattering in addition to
reflection. Furthermore, obstacles in the propagation path and the type of
buildings that exist have an impact on attenuation.
2.1 Fundamentals of Radio Transmission 33
E N
/ ) / [dB]
0s
Signal-to-noise ratio (
2 3 4 6 25
-10
60
50
40
= 18 dB
20
10
7
= 1 GHz
f
= 60 GHz
f
0
998
= 18 dB
T
P = 25 mW
g
R
F
T
R
g
= 1 Mbit/s
= 10 dB
3
10
876543
Distance / m
2
10
30
3
Path loss / dB
60
80
100
120
140
160
Direct plus reflected wave 1 GHz
Direct plus reflected wave 60 GHz
mean
Figure 2.7: Propagation attenuation in two-path model taking into account O
2
absorption
With the introduction of the propagation coefficent γ, the following applies
to isotropic antennas:
P
R
= P
T
g
T
g
R
λ
4π
2
1
d
γ
(2.8)
Realistic values for γ are between 2 (free-space propagation) and 5 (strong
attenuation, e.g., because of city buildings).
Different models can be used for calculating the path loss based on these
parameters, and are presented in Section 2.2.
Figure 2.7 compares the resulting propagation attenuation at 1 GHz and
at 60 GHz, taking into account O
2
absorption and interference caused by two-
path propagation. This interference leads to signal fading in sharply defined
geographical areas, and this is also relevant within the transmission range.
2.1.3 Fading in Propagation with a Large Number of
Reflectors (Multipath Propagation)
Fading refers to fluctuations in the amplitude of a received signal that oc-
cur owing to propagation-related interference. Multipath propagation caused
by reflection and the scattering of radio waves lead to a situation in which
transmitted signals arrive phase-shifted over paths of different lengths at the
receiver and are superimposed there. This interference can strengthen, distort
or even eliminate the received signal. There are many conditions that cause
fading, and these will be covered below.
34 2 System Aspects
Transmitter
Receiver
Figure 2.8: Multipath propagation
In a realistic radio environment waves reach a receiver not only over a direct
path but also on several other paths from different directions (see Figure 2.8).
A typical feature of multipath propagation (frequency-selective with broad-
band signals) is the existence of drops and boosts in level within the channel
bandwidth that sometimes fall below the sensitivity threshold of the receiver
or modulate it beyond its linear range.
The individual component waves can thereby superimpose themselves con-
structively or destructively and produce a stationary signal profile, referred to
as multipath fading, which produces a typical signal profile on a path when
the receiver is moving, referred to as short-term fading (see Figure 2.9).
The different time delays of component waves result in the widening of
a channel’s impulse response. This dispersion (or delay spread) can cause
interference between transmitted symbols (intersymbol interference).
Furthermore, depending on the direction of incidence of a component wave,
the moving receiver experiences either a positive or a negative Doppler shift,
which results in a widening of the frequency spectrum.
In general the time characteristics of a signal envelope pattern can be de-
scribed as follows:
r(t) = m(t)r
0
(t) (2.9)
Here m(t) signifies the current mean value of the signal level and r
0
(t) refers
to the part caused by short-term fading. The local mean value m(t) can be
deduced from the overall signal level r(t) by averaging r(t) over a range of
40–200 λ [21].
The receive level can sometimes be improved considerably through the use
of a diversity receiver with two antennas positioned in close proximity to each
other (n · λ/2; n = 1, 2, . . .). Because of the different propagation paths of
the radio waves, the receiving minima and maxima affected by fading of both
antennas occur at different locations in the radio field, thereby always enabling
2.1 Fundamentals of Radio Transmission 35
i
+1i
a
i
V
( )
r t
i
b
i
a
Signal envelope of the
tr
( )
tr
( )
b
µ
100
0.1
10
1
0.01
0 0.2 0.4 s
Mean
Fade margin
0
t
t
t
i
t
R
T
receive voltage
Fade duration
Connection duration
ThresholdR
for
threshold R
Figure 2.9: Receive signal voltage at a moving terminal under multipath fading
(overall and in detail)
Selection diversityScanning diversity
A A
2
r t
( )
2
r t
( )
1
r t
( )
1
r t
( )
tr
( )
tr
( )
Figure 2.10: Diversity reception
the receiver to pick up the strongest available receive signal. See Figure 2.10,
which shows the signal profile r
i
(t) of two antennas and the receive signal r(t).
With scanning diversity an antenna is replaced by a prevalent antenna when
its signal level drops below a threshold A. With selection diversity it is always
the antenna with the highest signal level that is used.
2.1.4 A Statistical Description of the Transmission Channel
It is only possible to provide a generic description of a transmission channel
on the basis of a real-life scenario. In the frequency range of mobile radio
being considered, changes such as the movement of reflectors alter propagation
conditions. Signal statistics is another way of developing a mathematical
understanding of the propagation channel.
36 2 System Aspects
2.1.4.1 Gaussian Distribution
The distribution function resulting from the superposition of an infinite num-
ber of statistically independent random variables is, based on the central limit
theorem, a Gaussian function:
p(x) =
1
√
2πσ
e
−
(x−m)
2
2σ
2
(2.10)
No particular distribution function is required for the individual overlaid ran-
dom variables, and they can even be uniformly distributed. The only prereq-
uisite is that the variances of the individual random variables should be small
in comparison with the overall variance.
A complete description of the Gaussian distribution is provided through its
mean value m and the variance σ
2
.
2.1.4.2 Rayleigh Distribution
On the assumption that all component waves are approximately incident at
a plane and approximately have the same amplitude, a Rayleigh distribution
occurs for the envelope of the signal. This assumption applies in particular
when the receiver has no line-of-sight connection with the transmitter because
of the lack of dominance of any particular component wave (see Figure 2.8).
The distribution density function of the envelope r(t) is
p(r) =
r
σ
2
e
−
r
2
2σ
2
(2.11)
with the mean value, quadratic mean value and variance
E{r} = σ
π
2
, E{r
2
} = 2σ
2
, σ
2
r
= σ
2
4 − π
2
For the representation with r(t) = m(t) · r
0
(t) a normalization of E{r
2
0
} = 1
is common and useful. The logarithmic representation with y = 20 log r
0
therefore produces
p(y) =
10
y/10
20 log e
e
−10
y/10
with the mean value, variance and standard deviation (C = 0.5772 . . . is
Euler’s constant)
E{y} = − C · 10 log e = −2.51 dB
σ
2
y
= (10 log e)
2
π
2
/6 = 31.03 dB, σ
y
= 5.57 dB
Figure 2.11 illustrates the distribution in half-logarithmic scaling.
2.1 Fundamentals of Radio Transmission 37
0
0.005
0.01
0.015
0.02
-30 -25 -20 -15 -10 -5 0 5 10
( )
Rayleigh-Fading dB
yp
y
Figure 2.11: Rayleigh distribution function (dB)
Fading frequency The frequency of fading, which can be of the order of
about 30 to 40 dB in depth, is dependent on the speed at which the receiver is
moving, and can be described on the basis of the Doppler shift of the transmit
frequency. The rate N
R
at which the prescribed field strength level is exceeded
is therefore calculated from
N
R
=
√
2πf
m
ρe
−ρ
2
(2.12)
with f
m
standing for the quotient arising from the vehicle speed v and wave-
length λ
f
m
= v/λ (2.13)
and ρ indicating the relationship between the received signal level and the
mean level.
Because the quadrature and in-phase components of the transmitted signal
are Gaussian-distributed and the field strength follows a Rayleigh distribu-
tion, the signal fluctuations that arise due to multipath propagation are also
referred to as Rayleigh fading.
The propagation paths are all of different lengths and have different re-
flection and transmission coefficients on the respective obstacles. This causes
phase shifts on the individual incoming paths.
Signal fading due to Rayleigh fading occurs at intervals of the order of half
the wavelength, λ/2.
Taking into account the attenuation and the multipath propagation with
the complex elements of all the paths, the following attenuation can be ob-
served in buildings according to [29]:
L = −20 log
λ
4π
n
i=0
Γ
i
d
i
e
2πd
i
λ
(2.14)
L overall attenuation in dB n number of incoming paths
d
i
length of ith path λ wavelength
38 2 System Aspects
Table 2.1: Parameter values for the Rice distribution
d ≤ 6 km d > 6 km
Environment r
s
K = r
2
s
/σ
2
r
s
K = r
2
s
/σ
2
Woodland 0.40 0.25 0.16 0.04
Small town 0.63 0.76 0.39 0.27
Village 0.74 1.15 0.40 0.24
Hamlet 0.81 1.61 0.77 1.35
Minor road 0.77 1.19 0.75 0.96
B-road 0.78 1.23 0.74 0.92
A-road 0.86 1.37 0.55 0.55
Γ
i
takes account of the reflections and transmissions experienced by the ith
ray on the path between transmitter and receiver:
Γ
i
=
r
j=0
R
j
t
k=0
T
k
(2.15)
R
j
jth reflection factor of
ith route
r number of reflections on jth
path
T
k
kth transmission factor of
ith route
t number of reflections on kth
path
2.1.4.3 The Rice Distribution
There are many cases in which the assumption of component waves having
the same amplitude does not apply, especially when a line-of-sight connection
dominates. The envelope is then described on the basis of a Rice distribution.
The distribution density function for the envelope r(t) produces
p(r) =
r
σ
2
e
−
r
2
+r
2
s
2σ
2
I
0
rr
s
σ
2
(2.16)
with I
0
is the Bessel function of 1st type and 0th order. The Rayleigh distri-
bution is a special case of the Rice distribution for r
s
= 0.
In concrete terms, r
2
s
represents the power of the direct, dominant com-
ponent wave, and σ
2
that of the randomly distributed multipath component
waves. Signal fades occur at longer intervals the further away the receiver is
from the transmitter; see Figure 2.7.
Reference [24] contains parameter values for several measurements in rural
areas (see Table 2.1). The values relate to the normalized signal envelope
r(t) = m(t)r
0
(t) and a dB-mean value of 0 for r
0
. Depending on the environ-
ment, σ
2
is clearly less than with Rayleigh fading. K = r
2
s
/σ
2
= 0 corresponds
to r
s
= 0, i.e., there is no line-of-sight connection. K → ∞ means that no
multipath signals are being received. Figure 2.12 shows the Rice distribution
for σ = 1.
2.1 Fundamentals of Radio Transmission 39
( )
r
s
p r
=1σ 0.6
0.5
0.4
0.3
0.2
0.1
0
0 2 4 6 8 10
2
1
0
4 6
r
Rice distribution for
Parameter
Figure 2.12: Rice distribution density function
IncidentIncident
Reflected Reflected
Transmitted Transmitted
Idealized
presentation
{
{
Real reflection
and transmission
Wall Wall
wave wave
wavewave
wavewave
Figure 2.13: Reflection at a wall
There is no closed-form solution for the mean value and variance for the
Rice distribution density function. These parameters can only be determined
using approximation formulas and tables.
2.1.5 Reflection
Waves are completely reflected on smooth surfaces, but otherwise they are
only partially reflected because of partial absorption—something that results
in undesirable phase shifts.
If a propagating wave hits a wall, part of it is reflected and part transmitted,
as is shown in Figure 2.13. The reflected part is a result of direct reflection
and a multitude of multiple reflections on the inside of the wall. In this same
40 2 System Aspects
way the entire transmitted part consists of one direct continuous wave and
many component waves reflected in the wall; see[19].
The sum total of the reflected and the transmitted wave differs from the in-
cident wave because the multiple reflections within the wall cause attenuation
loss.
In the prediction of actual radio propagation (e.g., using ray tracing tech-
niques) it is usually the geometric conditions of reflection and transmission on
a wall—albeit in the idealized form presented in Figure 2.13—that are taken
into account.
Geometric errors can occur for the following reasons:
1. Owing to refraction, the exit point of the transmitted wave on the inside
of the wall is shifted vertically from the exit point in the simplified
representation.
2. The parts resulting from multiple reflections do not actually exit from
the wall at the same place as the direct wave.
3. The point of reflection is fixed on the idealized wall and is therefore
misaligned by half the thickness of the wall from the actual point of
reflection.
According to [18], the reflection and transmission of an electromagnetic
wave on a dielectric layer are described as follows:
R
W all
=
r(e
−2jψ
− 1)
e
−2jψ
− r
2
, T
W all
=
1 − r
2
e
−jψ
− r
2
e
jψ
(2.17)
with
ψ =
2πd
λ
ε
r
− sin
2
ϕ (2.18)
and
r
⊥
=
cos ϕ −
ε
r
− sin
2
ϕ
cos ϕ +
ε
r
− sin
2
ϕ
, r
=
ε
r
cos ϕ −
ε
r
− sin
2
ϕ
ε
r
cos ϕ +
ε
r
− sin
2
ϕ
(2.19)
R
W all
complex reflection factor λ wavelength
T
W all
complex transmission factor d thickness of wall
ε
r
complex dielectric coefficient ϕ angle of incidence
The expressions in Equation (2.19) represent the reflection behaviour on an
ideal thin layer, with r
⊥
describing the behaviour in vertical polarization and
r
in parallel polarization.
The reflection curves calculated using Equation (2.17) and illustrated in
Figures 2.14 and 2.15 closely resemble those shown in [19]. No measurement
results are available for the transmission values (see Figures 2.16 and 2.17);
they are deduced from the reflection coefficients.
2.1 Fundamentals of Radio Transmission 41
Reflection loss over the angle of incidence
-7
-6
-5
-4
-3
-2
-1
0
0 10 20 30 40 50 60 70 80 90
Reflection loss [dB]
(degrees)
Refl. vert.
ϕ
Figure 2.14: Concrete wall (wall thick-
ness 150 mm), vertical polarization
-35
-30
-25
-20
-15
-10
-5
0
0 10 20 30 40 50 60 70 80 90
Reflection loss [dB]
(degrees)
Refl. par.
ϕ
Figure 2.15: Concrete wall (wall thick-
ness 150 mm), horizontal polarization
Transmission loss over the angle of incidence
-50
-45
-40
-35
-30
-25
-20
-15
-10
-5
0 10 20 30 40 50 60 70 80
(degrees)
90
Transmission loss [dB]
Trans. vert.
ϕ
Figure 2.16: Concrete wall (wall thick-
ness 150 mm), vertical polarization
-45
-40
-35
-30
-25
-20
-15
-10
-5
0 10 20 30 40 50 60 70 80 90
(degrees)
Transmission loss [dB]
Trans. par.
ϕ
Figure 2.17: Concrete wall (wall thick-
ness 150 mm), horizontal polarization
The figures show the attenuation of the reflection or the transmission over
the angle of incidence ϕ, with the attenuation being 20 log|R
W all
| [dB] and
20 log|T
W all
| [dB] respectively.
The results for the different polarization directions as a function of the angle
of incidence indicate a sharp drop in the Brewster angle area. Otherwise the
reflection factor increases from a minimum value of 0
◦
to a maximum value of
almost 90
◦
. The minimum value, the gradient of the curve and the Brewster
angle are dependent on the thickness and material of the wall.
The reflection characteristics of different materials in the area of 1–20 GHz
are presented as attenuation curves in [19].
42 2 System Aspects
2.1.6 Diffraction
Diffraction describes the modification of propagating waves when obstructed.
A wave is diffracted into the shadow space of an obstruction, thereby enabling
it to reach an area that it could ordinarily only reach along a direct path
through transmission.
The effect of diffraction becomes greater as the ratio of the wavelength to
the dimension of the obstacle increases. Diffraction is negligible at frequencies
above around 5 GHz.
2.1.7 RMS Delay Spread
The RMS (root mean square) delay spread describes the dispersion of a signal
through multipath propagation and takes into account the time delays of
all incoming paths with relation to the first path. The respective paths are
weighted with their received level:
τ
rms
=
1
n
i=1
P
i
n
i=1
(τ
2
i
P
i
) − τ
2
d
, with τ
d
=
n
i=1
(τ
i
P
i
)
n
i=1
P
i
(2.20)
τ
rms
RMS delay spread P
i
received level of path i
τ
i
time delay of ith path n # incoming paths
If the value of the RMS delay spread exceeds the tolerance limits of a system, it
is assumed that error-free reception is no longer possible. When this happens,
the waves travel over considerably different long paths, the levels of which
are not negligible. If the resultant time dispersion of the signal is greater
than the symbol duration during transmission then the receiver experiences
intersymbol interference and bit errors.
2.1.8 Shadowing
Obstacles in the line-of-sight path between transmitter and receiver outdoors
(mountains and buildings) or inside buildings (walls) hinder direct wave prop-
agation and therefore prevent the use of the shortest and frequently least
interfered (strongest) path between transmitter and receiver, and cause addi-
tional attenuation to the signal level, which is called shadowing. Shadowing
causes fluctuations to the signal level over a distance that, at 900 MHz for
example, can be of the order of around 25–100 m. Long-term fading occurs
when a moving receiver is lingering for a long time in the radio shadow, e.g.,
for 10 to 40 s.
Measurements have revealed that the local mean value m(t) in Equa-
tion (2.9) follows a lognormal distribution, i.e., L
m
= log m(t) is normally
distributed with a standard deviation of approximately 4 dB [21, 27]. This
2.2 Models to Calculate the Radio Field 43
is also called lognormal fading. This approximation applies to statistics for
large built-up areas.
2.1.9 Interference Caused by Other Systems
In addition to the interference caused by radio wave propagation, which has
already been discussed, there is also secondary interference, such as the re-
ciprocal effects of neighbouring radio systems on adjacent channels in the
spectrum and electromagnetic impulses caused by other systems, car starters,
generators and PCs—in other words man-made noise.
2.2 Models to Calculate the Radio Field
Reliable models for the calculation of expected signal levels are needed in
the planning of radio networks, establishing of supply areas and siting of base
stations. Data on terrain structure (topography) and buildings and vegetation
(morphology) are required for these calculations.
Radio propagation in a mobile radio environment can be described on the
basis of three components: long-term mean value, shadowing and short-term
fading. The sum total of these components L
P
= L
l
+ L
m
+ L
s
describes the
resultant overall path loss between transmitter and receiver; see Figure 3.45.
Another factor to be considered is that mobile stations usually move at
different speeds. The level, e.g., for determining GSM radio measurement
data, is measured on a time-related basis, so that the level is also affected by
the speed at which the mobile station is moving.
In the measurements by Okumura [25] the long-term mean value describes
the level value averaged over a large physical area of 1–1.5 km. The effects
of shadowing and short-term fading disappear through the averaging. This
long-term mean value can be calculated using approximate models.
A description of the most common models used in calculating the mean
value of the expected radio levels follows. A distinction is made between em-
pirical models, which are based on measurement data, and theoretical models,
which are based on the use of wave diffraction.
2.2.1 Empirical Models
The empirical approach is based on measurement data that when plotted
as regression curves or analytical expressions can be used to calculate signal
levels. The advantage of these models is that because of their measurement
basis, they all take into account known and unknown factors of radio prop-
agation. The disadvantage is that the models only cover certain frequencies
and scenarios and sometimes have to be revalidated for other areas.
Reference [27] offers an overview of the different measurements and the
models derived from them.
44 2 System Aspects
ReceiverSender
h
T
h
R
Figure 2.18: Obstacle in terrain as diffraction edge
2.2.2 Diffraction Models
Diffraction theory can be used to obtain a description of radio propagation.
In this case obstacles in uneven terrain are modelled as diffraction edges. A
section of terrain of the line of sight, which can usually be obtained from a
topographical database, is required for calculating diffraction loss. Figure 2.18
illustrates the principle for an edge.
For less steep forms of terrain, such as hills, cylinder diffraction can be
used as a model to produce better results. All types of terrain must be repre-
sented using several diffraction edges. Many different methods are available
for calculating the resultant diffraction loss (see the overview in [27]).
Diffraction models have the advantage that they can be calculated without
reference to any particular frequency or scenario, and consequently, in com-
parison with empirical models, can be used in a wider range of application
(frequencies, distances). The disadvantages are that the accuracy of the cal-
culation depends strongly on the accuracy of the topographical database and
that the different approaches produce widely different results for terrains with
several obstacles.
Because morphology plays an important role in the calculation of radio
propagation, empirical correction factors are also required for the diffraction
models. In practice, therefore, hybrid calculation methods are used with radio
network planning tools.
2.2.3 Ray Tracing Techniques
The long-term mean value of a signal level can be calculated using empirical
models and diffraction models. Some applications, such as the calculation of
radio propagation in networks with microcells (<1 km radio range), require
calculations with a more accurate resolution. The surroundings of the mobile
and base station (such as the geometry of the buildings) must be taken into
account if there is an interest in more than just the mean value over a large
area.
2.2 Models to Calculate the Radio Field 45
There are empirical and theoretical approaches to carrying out calcula-
tions. Good results can be achieved using ray tracing techniques, which can,
however, prove to be complicated for larger scenarios.
2.2.4 The Okumura/Hata Model
In 1962/63 and in 1965 Okumura carried out extensive measurements in and
around Tokyo for the frequency range from 500 MHz to 2 GHz. The results
of these measurements were published as regression curves [25]. To simplify
radio field predictions, Hata linearized some of these curves and approximated
them through analytical equations [12].
The basis for the calculation is an equation for the path loss in relatively
flat terrain with city dwellings (see Section 2.2.4.1) and isotropic antennas:
L
P
dB
= 69.55 + 26.16 log
f
MHz
− 13.82 log
h
T
m
−a(h
R
) +
44.9 − 6.55 log
h
T
m
log
d
km
(2.21)
This equation applies to frequencies f from 150 to 1500 MHz, (effective)
transmitting antenna heights h
T
from 30 to 200 m and distances d from 1
to 20 km. a(h
R
) is a correction factor for the height of the receiving antenna
h
R
.
Based on a frequency of 900 MHz, a 30 m base station antenna height and
a 1.5 m mobile station antenna height in a medium-sized city (a(h
R
) ≈ 0),
Equation (2.21) gives
L
P
dB
= 126.42 + 35.22 log
d
km
A comparison with free-space propagation (also see Section 2.1)
L
P
dB
= 91.52 + 20 log
d
km
and with propagation over a flat area (Equation (2.7))
L
P
dB
= 86.94 + 40 log
d
km
shows the path loss to be clearly higher than in these two theoretical models;
with a value of 3.5, the propagation exponent is somewhat lower than it is
with propagation over a flat area.
2.2.4.1 Terrain Profile
Okumura distinguishes between two types of terrain:
• Quasi-flat terrain
Flat terrain with a maximum 20 m altitude difference.
46 2 System Aspects
• Irregular terrain
All other irregular types of terrain, divided into:
– Rolling hilly terrain
– Isolated mountain
– General sloping terrain
– Mixed land–sea path
Diagrams with correction factors for calculating the radio propagation for
each of these categories are provided.
2.2.4.2 Types of Morphology
Okumura refers to three types of morphology:
• Open area
Open area without any major obstacles: farmland, etc.
• Suburban area
City or town with houses and trees, low-density housing
• Urban area
City with high rises or at least two-storey high buildings
The diagrams with the correction factors for the open and suburban mor-
phology types in Okumura’s work have been approximated into formulas by
Hata. In each case the correction factors must be added to the basic path loss
Equation (2.21):
Suburban
K
suburban
dB
= −2
log
f
28MHz
2
− 5.4
Open
K
open
dB
= −4.78
log
f
MHz
2
+ 18.33 log
f
MHz
− 40.94
The values for a frequency of 900 MHz are K
suburban
= −10 dB, K
open
=
−28.5 dB, and for 1800 MHz they are K
suburban
= −12 dB, K
open
= −32 dB.
2.2.5 Radio Propagation in Microcells
Today’s radio networks use hierarchical cell structures with small microcells
below the level of conventional macrocells. This increases network capacity in
areas with high traffic volumes (city centres, trade fairs, etc.).
Microcells cover areas extending up to several 100 m, with radio illumina-
tion greatly affected by the geometry of the base station surroundings. The
Okumura/Hata model only lends itself to the calculation of the mean value for
large areas and cell sizes with a radius of several kilometres. Other methods
are required for calculating radio illumination in microcells [26, 36].
2.3 Cellular Systems 47
cluster
3-cell
7-cell
cluster
F1
F3
F3 F4
F5
F6F7
F2 F1
F6
F5
F4
F2
F7
F1
F2 F3
F7 F6
F1F2
F3 F4
F5
F6F7
F1F2
F7 F6
F5
F2 F3
F1F3F2
F1
F3F2
F1
F1
F2 F3
F1
F2 F3
F2 F3
F1
F2 F3
F3 F4
F5
F1 F5
F3 F4
F6F7
F2 F2
Figure 2.19: A cellular network supplying an extended area
2.3 Cellular Systems
Traditional radio networks (1st-generation) that try to provide coverage to
large areas by increasing the transmitting power of the individual base sta-
tions are only able to serve a limited number of subscribers because of the
bandwidth used. In these radio networks an allocated radio channel is re-
tained as long as possible, even if a receiver has already moved into another
supply area. Because the physical boundaries of a supply area are not pre-
cisely defined, neighbouring supply areas must use different radio channels in
order to avoid interference. Where user density is high, this results in a heavy
demand for frequencies, which, however, are restricted because of the scarcity
of available spectrum.
The poor utilization of frequency spectrum in these radio networks and the
increase in the number of mobile radio users, which these systems could no
longer handle, led to the development of cellular networks.
Cellular networks are based on dividing the entire area over which a network
is to be operated into radio cells, each of which is served by a base station.
Each base station is only allowed to use a certain number of the total available
frequency channels, which can only be reused after a sufficient interval to avoid
any interference from neighbouring cells (see Figure 2.19). F
i
(i = 1, 2, . . . , n)
indicates the groups of frequency channels used in the respective cells.
In cellular networks the low transmitting power of the base stations enables
them to use allocated frequencies only in a strictly defined area of the radio
cell, thereby allowing these frequencies to be reused after a predetermined
reuse distance.
48 2 System Aspects
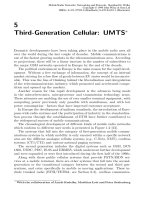
Figure 2.20: Simulated best server cells of a metropolitan scenario
Cells are generally represented as idealized regular hexagons, but because of
topographical and environmental conditions, this is only an approximation of
what actually occurs; see Figure 2.20. In reality radio cells are very irregular in
their external shape and furthermore are designed to overlap with one another
by approximately 10–15%. This enables mobile stations operating near the
boundary of a cell to choose with which base station they set up a call.
2.3.1 Cluster Patterns and Carrier-to-Interference Ratio
Radio cells are combined into clusters, and each frequency is used once per
cluster. Cells of a cluster neighbouring any other cluster may reuse all fre-
quencies occupied in the cluster in a regular way and thereby repeat the
cluster. Because the clusters must supply an entire area with coverage, only
certain cluster patterns consisting of, e.g., 3, 4, 7, 12, 15 or 21 cells, are pos-
sible. The lower the number of cells per cluster, the greater the number of
radio-frequency channels that can be used per cell for the entire mobile radio
system in a given frequency band. However, frequencies reused within a short
distance increase the co-channel interference across clusters. The carrier-to-
interference ratio is the ratio of the received carrier signal C to the received
interference signal I from the co-channels.
Figure 2.21 shows an example of frequency planning using a 3-cell cluster
(frequency groups 1, 2, 3) and a regular hexagonal cell structure. This kind
of uniform cluster structure always has six co-channel cells in close proximity
to any base station. The interference usually originates from these cells; co-
channel cells further away will be of less harm.
2.3 Cellular Systems 49
1
2 3
1
2 3 1
2 3
1
1
2 3
1
2 3 1 2 3
2 3
Interferer
Figure 2.21: Interference by co-
channel cells
R
D
Figure 2.22: Co-channel cells in a cellular
network
The distribution of interference level is caused by the overlapping of many
independent sources of interference and therefore can be regarded as a normal
distribution. On the downlink the base stations are the source of interference;
on the uplink it is the mobile stations from the co-channel cells.
2.3.2 C/I Ratio and Interference-Reduction Factor
Depending on the modulation technique employed and the technical equip-
ment of the receiver, the smallest acceptable C/I ratio for a cellular network
is based on the number of co-channel cells, the distance between these cells,
the transmitting power and the terrain characteristics.
The C/I ratio required for cell planning is calculated below on the basis of
an idealized concept for the model. The calculation considers a system such
as the one in Figure 2.22. In the central cell with radius R a mobile station
is in radio contact with its base station. The interference cells in which the
mobile and base stations are transmitting on the same frequency and therefore
can cause interference are arranged in a circle around the cell at distance D.
Co-channel interference by cells further away can be ignored because of the
larger associated path loss. On the assumption that statistically all mobile
stations transmit independently of one another, the total interference power
for a base station with K
I
interfering mobile stations is calculated on the basis
of a combination of the individual interference contribution I
k
and the noise
power N:
I =
K
I
k=1
I
k
+ N (2.22)
50 2 System Aspects
The noise power N in the receiver is
N = F KΘv (2.23)
F stands for the noise factor of the receiver (which is between 5 and 10), K
for Boltzmann’s constant (1.38 · 10
−23
W·s/K), Θ for the temperature in K
and v for the bit rate in bit/s. The ratios in the model produce a noise power
of approximately 5.6 · 10
−12
mW, or a level of −112 dBm.
If one ignores the noise power in a homogeneous system in which all mobile
stations are transmitting at the same power then the co-channel carrier-to-
interference ratio only depends on where the mobile stations are located in
relationship to one another:
C
I
=
R
−γ
K
I
k=1
D
−γ
k
(2.24)
In Equation (2.24) D
k
indicates the distance to the kth mobile station and
γ indicates the path loss parameter for the receive power. Because K
I
= 6
cells are located at the same distance from the central cell in the model, and
for purposes of simplification, all distances can be considered as equal, and it
follows that
C
I
=
R
−γ
6D
−γ
=
1
6
q
γ
(2.25)
The ratio q = D/R is called the co-channel interference reduction factor and
is
q =
D
R
=
6
C
I
1
γ
(2.26)
Aiming towards a co-channel carrier-to-interference ratio C/I of, e.g., 11 dB,
using a realistic value of, e.g., γ = 4, produces a reduction factor of q = 2.85.
The next step in cell planning is the selection of a suitable cluster type to
meet the requirement for a specific ratio of cell radius R to reuse distance D.
If large clusters are used, the distance between the interfering cells will also
be great; however, each cell will be able to carry less traffic because the trunk
of frequency channels of the available band must be distributed among the
clusters. Therefore, for maximum spectrum utilization efficiency, there has to
be a balance between the number of cells per cluster and achievable transmis-
sion quality. The reduction factor produces the following actual values for the
cluster sizes:
Cluster size 3 4 7 12
D/R 3 3.464 4.58 5.6
2.3 Cellular Systems 51
Figure 2.23: Adapting cell size to traffic density
2.3.3 Traffic Load and Cell Radius
Another parameter in radio network planning is the size of the cell radii.
By reducing the size of the cells, a system can be adapted to cope with a
higher level of user density (see Figure 2.23). However, the system dictates
the minimum possible size of a cell derived from cost/benefit considerations.
In practice networks are usually initially set up with relatively large cell radii.
If it turns out that this structure is no longer able to carry existing traffic,
the cells with high traffic density are reduced in size through the process of
cell splitting and equipped with additional base transceiver stations. This
approach always provides an optimal solution in terms of network utilization,
necessary signalling for handover, service quality for the user, as well as costs
of the network infrastructure. The number of base station locations can be
reduced by setting up three neighbouring cells, with the cells serving three
120
◦
sectors (= cells) with different channel groups (also see Section 2.4).
The main advantage of cellular systems is that the same radio channels can
be reused, and consequently coverage can be provided to areas of any size.