Tài liệu RF và mạch lạc lò vi sóng P2 pdf
Bạn đang xem bản rút gọn của tài liệu. Xem và tải ngay bản đầy đủ của tài liệu tại đây (330.48 KB, 48 trang )
2
COMMUNICATION SYSTEMS
Modern communication systems require radio frequency and microwave signals for
the wireless transmission of information. These systems employ oscillators, mixers,
®lters, and ampli®ers to generate and process various kinds of signals. The
transmitter communicates with the receiver via antennas placed on each side.
Electrical noise associated with the systems and the channel affects the performance.
A system designer needs to know about the channel characteristics and system noise
in order to estimate the required power levels. This chapter begins with an overview
of microwave communication systems and the radio frequency wireless services to
illustrate the applications of circuits and devices that are described in the following
chapters. It also gives an idea to the reader about the placement of different building
blocks in a given system.
A short discussion on antennas is included to help in understanding the signal
behavior when it propagates from transmitter to receiver. The Friis transmission
formula and the radar range equation are important in order to understand effects of
frequency, range, and operating power levels on the performance of a communica-
tion system. Note that radar concepts now ®nd many other applications, such as
proximity or level sensing in an industrial environment. Therefore, a brief discussion
on Doppler radar is also included in this chapter. Noise and distortion characteristics
play a signi®cant role in analysis and design of these systems. Minimum detectable
signal (MDS), gain compression, intercept-point, and the dynamic range of an
ampli®er (or the receiver) are subsequently introduced. Other concepts associated
with noise and distortion characteristics are also introduced in this chapter.
9
Radio-Frequency and Microwave Communication Circuits: Analysis and Design
Devendra K. Misra
Copyright # 2001 John Wiley & Sons, Inc.
ISBNs: 0-471-41253-8 (Hardback); 0-471-22435-9 (Electronic)
2.1 TERRESTRIAL COMMUNICATION
As mentioned in the preceding chapter, microwave signals propagate along the line-
of-sight. Therefore, the earth-curvature limits the range over which a microwave
communication link can be established. A transmitting antenna sitting on a 25-foot-
high tower can typically communicate only up to a distance of about 50 km. The
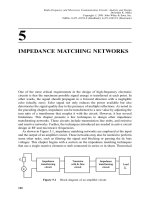
repeaters can be placed at regular intervals to extend the range. Figure 2.1 illustrates
the block diagram of a typical repeater.
The repeater system operates as follows. A microwave signal arriving at antenna
A works as input to port 1 of the circulator. It is directed to port 2 without loss,
assuming that the circulator is ideal. Then it passes through the receiver protection
circuit that limits the magnitude of large signals but passes those of low intensity
with negligible attenuation. The purpose of this circuit is to block excessively large
signals from reaching the receiver input. The mixer following it works as a down-
converter that transforms a high-frequency signal to a low frequency one, typically
in the range of 70 MHz. The Schottky diode is generally employed in the mixer
because of its superior noise characteristics. This frequency conversion facilitates
ampli®cation of the signal economically. A band-pass ®lter is used at the output of
the mixer to stop undesired harmonics. An intermediate frequency (IF) ampli®er is
Figure 2.1 Block arrangement of a repeater system.
10
COMMUNICATION SYSTEMS
then used to amplify the signal. It is generally a low-noise solid-state ampli®er with
ultralinear characteristics over a broadband. The ampli®ed signal is mixed again with
another signal for up-conversion of frequency. After ®ltering out undesired harmo-
nics introduced by the mixer it is fed to a power ampli®er stage that feeds circulator
B for onward transmission through antenna B. This up-converting mixer circuit
generally employs the varactor diode. Circulator B directs the signal entering at port
3 to the antenna connected at its port 1. Similarly, the signal propagating upstream is
received by antenna B and the circulator directs it toward port 2. It then goes through
the processing as described for the downstream signal and is radiated by antenna A
for onward transmission. Hence, the downstream signal is received by antenna A and
transmitted in the forward direction by antenna B. Similarly, the upstream signal is
received by antenna B and forwarded to the next station by antenna A. The two
circulators help channel the signal in the correct direction.
A parabolic antenna with tapered horn as primary feeder is generally used in
microwave links. This kind of composite antenna system, known as the hog-horn,
is fairly common in high-density links because of its broadband characteristics.
These microwave links operate in the frequency range of 4±6 GHz, and signals
propagating in two directions are separated by a few hundred megahertz. Since this
frequency range overlaps with the C-band satellite communication, their interference
needs to be taken into design consideration. A single frequency can be used twice
for transmission of information using vertical and horizontal polarization.
2.2 SATELLITE COMMUNICATION
The ionosphere does not re¯ect microwaves as it does radio frequency signals.
However, one can place a conducting object (satellite) up in the sky that re¯ects
them back to earth. A satellite can even improve the signal quality using on-board
electronics before transmitting it back. The gravitational force needs to be balanced
somehow if this object is to stay in position. An orbital motion provides this
balancing force. If a satellite is placed at low altitude then greater orbital force will
be needed to keep it in position. These low- and medium-altitude satellites are
visible from a ground station only for short periods. On the other hand, a satellite
placed at an altitude of about 36,000 km over the equator is visible from its shadow
all the time. These are called geosynchronous or geostationary satellites.
C-band geosynchronous satellites use between 5725 MHz and 7075 MHz for their
uplinks. The corresponding downlinks are between 3400 MHz and 5250 MHz. Table
2.1 lists the downlink center frequencies of a 24-channel transponder. Each channel
has a total bandwidth of 40 MHz; 36 MHz of that carries the information and the
remaining 4 MHz is used as a guard-band. It is accomplished with a 500-MHz
bandwidth using different polarization for the overlapping frequencies. The uplink
frequency plan may be found easily after adding 2225 MHz to these downlink
frequencies. Figure 2.2 illustrates the simpli®ed block diagram of a C-band satellite
transponder.
SATELLITE COMMUNICATION
11
A 6-GHz signal received from the earth station is passed through a band-pass
®lter before amplifying it through a low-noise ampli®er (LNA). It is then mixed with
a local oscillator (LO) signal to bring down its frequency. A band-pass ®lter that is
connected right after the mixer ®lters out the unwanted frequency components. This
signal is then ampli®ed by a traveling wave tube (TWT) ampli®er and transmitted
back to the earth.
Another frequency band in which satellite communication has been growing
continuously is the Ku-band. The geosynchronous Fixed Satellite Service (FSS)
generally operates between 10.7 and 12.75 GHz (space to earth) and 13.75 to
14.5 GHz (earth to space). It offers the following advantages over the C-band:
The size of the antenna can be smaller (3 feet or even smaller with higher-
power satellites) against 8 to 10 feet for C-band.
Because of higher frequencies used in the up- and downlinks, there is no
interference with C-band terrestrial systems.
TABLE 2.1 C-Band Downlink Transponder Frequencies
Horizontal Polarization Vertical Polarization
Channel Center Frequency (MHz) Channel Center Frequency (MHz)
1 3720 2 3740
3 3760 4 3780
5 3800 6 3820
7 3840 8 3860
9 3880 10 3900
11 3920 12 3940
13 3960 14 3980
15 4000 16 4020
17 4040 18 4060
19 4080 20 4100
21 4120 22 4140
23 4160 24 4180
Figure 2.2 Simpli®ed block-diagram of a transponder.
12
COMMUNICATION SYSTEMS
Since higher-frequency signals attenuate faster while propagating through adverse
weather (rain, fog, etc.), Ku-band satellites suffer from this major drawback. Signals
with higher powers may be used to compensate for this loss. Generally, this power is
of the order of 40 to 60 W. The high-power direct broadcast satellite (DBS) system
uses power ampli®ers in the range of 100 to 120 W.
The National Broadcasting Company (NBC) has been using the Ku-band to
distribute its programming to its af®liates. Also, various news-gathering agencies
have used this frequency band for some time. Convenience stores, auto parts
distributors, banks, and other businesses have used the very small aperture terminal
(VSAT) because of its small antenna size (typically, on the order of three feet in
diameter). It offers two-way satellite communication; usually back to hub or
headquarters. The Public Broadcasting Service (PBS) uses VSATs for exchanging
information among the public schools.
Direct broadcast satellites (DBSs) have been around since 1980, but early DBS
ventures failed for various reasons. In 1991, Hughes Communications entered into
the direct-to-home (DTH) television business. DirecTV was formed as a unit of GM
Hughes, with DBS-1 launched in December 1993. Its longitudinal orbit is at
101:2
W and it employs a left-handed circular polarization. Subsequently, DBS-2
was launched in August 1994. It uses a right-handed circular polarization and its
orbital longitude is at 100:8
W. DirecTV employs a digital architecture that can
utilize video and audio compression techniques. It complies with the MPEG-2
(Motion Picture Experts Group). By using compression ratios 5 to 7, over 150
channels of programs are available from the two satellites. These satellites include
120-W traveling wave tube (TWT) ampli®ers that can be combined to form eight
pairs at 240 W power. This higher power can also be utilized for high-de®nition
television (HDTV) transmission. Earth-to-satellite link frequency is 17.3 to
17.8 GHz while satellite-to-earth link uses the 12.2- to 12.7-GHz band. Circular
polarization is used because it is less affected by rain than linear orthogonal (HP and
VP) polarization.
Several communication services are now available that use low-earth-orbit
satellites (LEOS) and medium-earth-orbit satellites (MEOS). LEOS altitudes range
from 750 km to 1500 km while MEOS systems have an altitude around 10350 km.
These services compete with or supplement the cellular systems and geosynchro-
nous earth-orbit satellites (GEOS). The GEOS systems have some drawbacks due to
the large distances involved. They require relatively large powers and the propaga-
tion time-delay creates problems in voice and data transmissions. The LEOS and
MEOS systems orbit the earth faster because of being at lower altitudes and,
therefore, these are visible only for short periods. As Table 2.2 indicates, several
satellites are used in a personal communication system to solve this problem.
Three classes of service can be identi®ed for mobile satellite services:
1. Data transmission and messaging from very small, inexpensive satellites
2. Voice and data communications from big LEOS
3. Wideband data transmission
SATELLITE COMMUNICATION
13
Another application of L-band microwave frequencies (1227.60 MHz and
1575.42 MHz) is in the global positioning system (GPS). It uses a constellation of
24 satellites to determine a user's geographical location. Two services are available:
the standard positioning service (SPS) for civilian use, utilizing a single frequency
course=acquisition (C=A) code, and the precise positioning service (PPS) for the
military, utilizing a dual-frequency P-code (protected). These satellites are at an
altitude of 10,900 miles above the earth with their orbital period of 12 hours.
2.3 RADIO FREQUENCY WIRELESS SERVICES
A lot of exciting wireless applications are reported frequently that use voice and data
communication technologies. Wireless communication networks consist of micro-
cells that connect people with truly global, pocketsize communication devices,
telephones, pagers, personal digital assistants, and modems. Typically, a cellular
system employs a 100-W transmitter to cover a cell of 0.5 to 10 miles in radius. The
handheld transmitter has a power of less than 3 W. Personal communication networks
(PCN=PCS) operate with a 0.01- to 1-W transmitter to cover a cell radius of less than
450 yards. The handheld transmitter power is typically less than 10 mW. Table 2.3
shows the cellular telephone standards of selected systems.
There have been no universal standards set for wireless personal communication.
In North America, cordless has been CT-0 (an analog 46=49 MHz standard) and
cellular AMPS (Advanced Mobile Phone Service) operating at 800 MHz. The
situation in Europe has been far more complex; every country has had its own
standard. While cordless was nominally CT-0, different countries used their own
frequency plans. This led to a plethora of new standards. These include, but are not
TABLE 2.2 Speci®cations of Certain Personal Communication Satellites
Iridium (LEO)y Globalstar (LEO) Odyssey (MEO)
No. of satellites 66 48 12
Altitude (km) 755 1,390 10,370
Uplink (GHz) 1.616±1.6265 1.610±1.6265 1.610±1.6265
Downlink (GHz) 1.616±1.6265 2.4835±2.500 2.4835±2.500
Gateway terminal uplink 27.5±30.0 GHz C-band 29.5±30.0 GHz
Gateway terminal downlink 18.8±20.2 GHz C-band 19.7±20.2 GHz
Average sat. connect time 9 min. 10±12 min. 2 hrs.
Features of handset
Modulation QPSK QFPSK QPSK
BER 1E-2 (voice) 1E-3 (voice) 1E-3 (voice)
1E-5 (data) 1E-5 (data) 1E-5 (data)
Supportable data rate 4.8 (voice) 1.2±9.6 (voice & data) 4.8 (voice)
(Kbps) 2.4 (data) 1.2±9.6 (data)
y It is going out-of-service because of its excessive operational costs.
14
COMMUNICATION SYSTEMS
TABLE 2.3 Selected Cellular Telephones
Analog Cellular Digital Cellular Phones
Standard AMP ETACS NADC (IS-54) NADC (IS-95) GSM PDC
Frequency range Tx 824±849 871±904 824±849 824±849 890±915 940±956
1177±1501
(MHz) Rx 869±894 916±949 869±894 869±894 935±960 810±826
1429±1453
Transmitter's power (max.) 600 mW 200 mW 1 W
Multiple access FDMA FDMA TDMA=FDM CDMA=FDM TDMA=FDM TDMA=FDM
Number of channels 832 1000 832 20 124 1600
Channel spacing (kHz) 30 25 30 1250 200 25
Modulation FM FM p=4 DQPSK BPSK=0QPSK GMSK p=4 DQPSK
Bit rate (kb=s) ± ± 48.6 1228.8 270.833 42
RADIO FREQUENCY WIRELESS SERVICES
15
TABLE 2.4 Selected Cordless Telephones
Analog Cordless Digital Cordless Phones
Standards CT-0 CT-1 & CT-1 CT-2 & CT-2 DECT PHS (Formerly PHP)
Frequency range (MHz) 46=49 CT-1: 915=960
CT-1: 887±932
CT-1: 864±868
CT-2: 930=931
940=941
1880±1990 1895±1907
Transmitter's power (max.) 10 mW & 80 mW 250 mW 80 mW
Multiple access FDMA FDMA TDMA=FDM TDMA=FDM TDMA=FDM
Number of channels 10±20 CT-1: 40
CT-1:80
40 10 (12 users per channel) 300 (4 users per channels)
Channel spacing (kHz) 40 25 100 1728 300
Modulation FM FM GFSK GFSK p=4 DQPSK
Bit rate (kb=s) ± ± 72 1152 384
16
COMMUNICATION SYSTEMS
limited to, CT-1, CT-1, DECT (Digital European Cordless Telephone), PHP
(Personal Handy Phone, in Japan), E-TACS (Extended Total Access Communication
System, in UK), NADC (North American Digital Cellular), GSM (Global System
for Mobile Communication), and PDC (Personal Digital Cellular). Speci®cations of
selected cordless telephones are given in Table 2.4.
2.4 ANTENNA SYSTEMS
Figure 2.3 illustrates some of the antennas that are used in communication systems.
These can be categorized into two groupsÐwire antennas and the aperture-type
antennas. Electric dipole, monopole, and loop antennas belong to the former group
whereas horn, re¯ector, and lens belong to the latter category. The aperture antennas
can be further subdivided into primary and secondary (or passive) antennas. Primary
antennas are directly excited by the source and can be used independently for
transmission or reception of signals. On the other hand, a secondary antenna requires
another antenna as its feeder. Horn antennas fall in ®rst category whereas the
re¯ector and lens belong to the second. Various kinds of horn antennas are
commonly used as feeders in re¯ector and lens antennas.
When an antenna is energized, it generates two types of electromagnetic ®elds.
Part of the energy stays nearby and part propagates outward. The propagating signal
represents the radiation ®elds while the nonpropagating is reactive (capacitive or
inductive) in nature. Space surrounding the antenna can be divided into three
regions. The reactive ®elds dominate in the nearby region but reduce in strength at a
faster rate in comparison with those associated with the propagating signal. If the
largest dimension of an antenna is D and the signal wavelength is l then reactive
®elds dominate up to about 0:62
p
D
3
=l and diminish after 2D
2
=l. The region
beyond 2D
2
=l is called the far ®eld (or radiation ®eld) region.
Power radiated by an antenna per unit solid angle is known as the radiation
intensity U. It is a far ®eld parameter that is related to power density (power per unit
area) W
rad
and distance r as follows:
U r
2
W
rad
2:4:1
Directive Gain and Directivity
If an antenna radiates uniformly in all directions then it is called an isotropic
antenna. This is a hypothetical antenna that helps in de®ning the characteristics of a
real one. The directive gain D
G
is de®ned as the ratio of radiation intensity due to the
test antenna to that of an isotropic antenna. It is assumed that total radiated power
remains the same in the two cases. Hence,
D
G
U
U
o
4pU
P
rad
2:4:2
ANTENNA SYSTEMS
17
where
U radiation intensity due to the test antenna, in watts-per-unit solid angle
U
o
radiation intensity due to the isotropic antenna, in watts-per-unit solid
angle
P
rad
total radiated power in watts
Since U is a directional dependent quantity, the directive gain of an antenna depends
on the angles y and f. If the radiation intensity assumes its maximum value
Figure 2.3 Some commonly used antennas: (a) electric dipole, (b) monopole, (c) loop,
(d) pyramidal horn, (e) cassegrain re¯ector, and (f ) lens.
18
COMMUNICATION SYSTEMS
then the directive gain is called the directivity D
o
. That is,
D
o
U
max
U
o
4pU
max
P
rad
2:4:3
Gain of an Antenna
Power gain of an antenna is de®ned as the ratio of its radiation intensity at a point to
the radiation intensity that results from a uniform radiation of the same input power.
Hence,
Gain 4p
Radiation intensity
Total input power
4p
Uy; f
P
in
2:4:4
Most of the time, we deal with relative gain. It is de®ned as a ratio of the power
gain of the test antenna in a given direction to the power gain of a reference antenna.
Both antennas must have the same input power. The reference antenna is usually a
dipole, horn, or any other antenna whose gain can be calculated or is known.
However, the reference antenna is a lossless isotropic source in most cases. Hence,
Gain 4p
Uy; f
P
in
Lossless isotropic antenna
2:4:5
When the direction is not stated, the power gain is usually taken in the direction of
maximum radiation.
Radiation Patterns and Half-Power Beam Width (HPBW)
Far-®eld power distribution at a distance r from the antenna depends upon the spatial
coordinates y and f. Graphical representations of these distributions on the
orthogonal plane (y-plane or f-plane) at a constant distance r from the antenna
are called its radiation patterns. Figure 2.4 illustrates the radiation pattern of the
vertical dipole antenna with y.Itsf-plane pattern can be found after rotating it about
the vertical axis. Thus, a three-dimensional picture of the radiation pattern of a
dipole is doughnut shaped. Similarly, the power distributions of other antennas
generally show peaks and valleys in the radiation zone. The highest peak between
the two valleys is known as the main lobe while the others are called the side-lobes.
The total angle about the main peak over which power reduces by 50 percent of its
maximum value is called the half-power beam width on that plane.
The following relations are used to estimate the power gain G and the half-power
beam width HPBW (or BW) of an aperture antenna
G
4p
l
2
A
e
4p
l
2
Ak 2:4:6
ANTENNA SYSTEMS
19
and,
BW in degree
65 Â l
d
2:4:7
where A
e
is the effective area of the radiating aperture in square meters; A is its
physical area (p  d
2
=4, for a re¯ector antenna dish with its diameter d); k is the
ef®ciency of the antenna (ranges from 0.6 to 0.65); and l is the signal wavelength in
meters.
Example 2.1: Calculate the power gain (in dB) and the half-power beam width of a
parabolic dish antenna of 30 m in diameter that is radiating at 4 GHz.
Signal wavelength and area of the aperture are
l
3 Â 10
8
4 Â 10
9
0:075 m
and
A
pd
2
4
p
30
2
4
706:8584 m
2
Figure 2.4 Radiation pattern of a dipole in the vertical (y) plane.
20
COMMUNICATION SYSTEMS
Assuming that the aperture ef®ciency is 0.6, the antenna gain and the half-power
beam width are found as follows:
G
4p
0:075
2
 706:8584  0:6 947482:09 10 log
10
947482:09
59:76 % 60 dB
BW
65 Â 0:075
30
0:1625 deg:
Antenna Ef®ciency
If an antenna is not matched with its feeder then a part of the signal available from
the source is re¯ected back. It is considered as the re¯ection (or mismatch) loss. The
re¯ection (or mismatch) ef®ciency is de®ned as a ratio of power input to the antenna
to that of power available from the source. Since the ratio of re¯ected power to that
of power available from the source is equal to the square of the magnitude of voltage
re¯ection coef®cient, the re¯ection ef®ciency e
r
is given by
e
r
1 ÀjGj
2
G Voltage reflection coefficient
Z
A
À Z
o
Z
A
Z
o
where Z
A
is the antenna impedance and Z
o
is the characteristic impedance of the
feeding line.
Besides mismatch, the signal energy may dissipate in an antenna due to imperfect
conductor or dielectric material. These ef®ciencies are hard to compute. However,
the combined conductor and dielectric ef®ciency e
cd
can be experimentally deter-
mined after measuring the input power P
in
and the radiated power P
rad
. It is given as
e
cd
P
rad
P
in
The overall ef®ciency e
o
is a product of the above ef®ciencies. That is,
e
o
e
r
e
cd
2:4:8
Example 2.2: A 50-O transmission line feeds a lossless one-half-wavelength-long
dipole antenna. Antenna impedance is 73 O. If its radiation intensity, Uy; f,is
given as follows, ®nd the maximum overall gain.
U B
o
sin
3
y
ANTENNA SYSTEMS
21
The maximum radiation intensity, U
max
,isB
o
that occurs at y p=2. Its total
radiated power is found as follows:
P
rad
2p
0
p
0
B
o
sin
3
y sin y dy df
3
4
p
2
B
o
Hence,
D
o
4p
U
max
P
rad
4pB
o
3
4
p
2
B
o
16
3p
1:6977
or,
D
o
dB10 log
10
1:6977dB 2:2985 dB
Since the antenna is lossless, the radiation ef®ciency e
cd
is unity (0 dB). Its mismatch
ef®ciency is computed as follows.
Voltage re¯ection coef®cient at its input (it is formulated in the following chapter)
is
G
Z
A
À Z
o
Z
A
Z
o
73 À 50
73 50
23
123
Therefore, the mismatch ef®ciency of the antenna is
e
r
1 À23=123
2
0:9650 10 log
10
0:9650dB À0:1546 dB
The overall gain G
o
(in dB) is found as follows:
G
o
dB2:2985 À 0 À 0:1546 2:1439 dB
Bandwidth
Antenna characteristics, such as gain, radiation pattern, impedance, and so on, are
frequency dependent. The bandwidth of an antenna is de®ned as the frequency band
over which its performance with respect to some characteristic (HPBW, directivity,
etc.) conforms to a speci®ed standard.
Polarization
Polarization of an antenna is same as the polarization of its radiating wave. It is a
property of the electromagnetic wave describing the time varying direction and
relative magnitude of the electric ®eld vector. The curve traced by the instantaneous
22
COMMUNICATION SYSTEMS
electric ®eld vector with time is the polarization of that wave. The polarization is
classi®ed as follows:
Linear polarization: If the tip of the electric ®eld intensity traces a straight line
in some direction with time then the wave is linearly polarized.
Circular polarization: If the end of the electric ®eld traces a circle in space as
time passes then that electromagnetic wave is circularly polarized. Further, it
may be right-handed circularly polarized (RHCP) or left-handed circularly
polarized (LHCP), depending on whether the electric ®eld vector rotates
clockwise or counterclockwise.
Elliptical polarization: If the tip of the electric ®eld intensity traces an ellipse
in space as time lapses then the wave is elliptically polarized. As in the
preceding case, it may be right-handed or left-handed elliptical polarization
(RHEP and LHEP).
In a receiving system, the polarization of the antenna and the incoming wave need
to be matched for maximum response. If this is not the case then there will be some
signal loss, known as polarization loss. For example, if there is a vertically polarized
wave incident on a horizontally polarized antenna then the induced voltage available
across its terminals will be zero. In this case, the antenna is cross-polarized with
incident wave. The square of the cosine of the angle between wave-polarization and
antenna-polarization is a measure of the polarization loss. It can be determined by
squaring the scalar product of unit vectors representing the two polarizations.
Example 2.3: The electric ®eld intensity of an electromagnetic wave propagating in
a lossless medium in z-direction is given by
~
E
~
r; t
^
xE
o
x; y cosot À kz V=m
It is incident upon an antenna that is linearly polarized as follows:
~
E
a
~
r
^
x
^
yEx; y; z V=m
Find the polarization loss factor.
In this case, the incident wave is linearly polarized along the x-axis while the
receiving antenna is linearly polarized at 45
from it. Therefore, one-half of the
incident signal is cross-polarized with the antenna. It is determined mathematically
as follows.
The unit vector along the polarization of incident wave is
^
u
i
^
x
ANTENNA SYSTEMS
23
The unit vector along the antenna polarization may be found as
^
u
a
1
2
p
^
x
^
y
Hence, the polarization loss factor is
j
^
u
i
^
u
a
j
2
0:5 À3:01 dB
Effective Isotropic Radiated Power (EIRP)
EIRP is a measure of power gain of the antenna. It is equal to the power needed by
an isotropic antenna that provides the same radiation intensity at a given point as the
directional antenna. If power input to the feeding line is P
t
and the antenna gain is G
t
then EIRP is de®ned as follows:
EIRP
P
t
G
t
L
2:4:10
where L is the input-to-output power ratio of transmission line that is connected
between the output of the ®nal power ampli®er stage of the transmitter and the
antenna. It is given by
L
P
t
P
ant
2:4:10
Alternatively, the EIRP can be expressed in dBw as follows:
EIRPdBwP
t
dBwÀLdBGdB2:4:11
Example 2.4: In a transmitting system, output of its ®nal high-power ampli®er is
500 W and the line feeding its antenna has an attenuation of 20 percent. If gain of
the transmitting antenna is 60 dB, ®nd EIRP in dBw.
P
t
500 W 26:9897 dBw
P
ant
0:8 Â 500 400 W
G 60 dB 10
6
and,
L
500
400
1:25 10 log
10
1:250:9691 dB
24
COMMUNICATION SYSTEMS
Hence,
EIRPdBw26:9897 À 0:9691 60 86:0206 dBw
or,
EIRP
500 Â 10
6
1:25
400 Â 10
6
W
Space Loss
The transmitting antenna radiates in all directions depending upon its radiation
characteristics. However, the receiving antenna receives only the power that is
incident on it. Hence, the rest of the power is not used and is lost in space. It is
represented by the space loss. It can be determined as follows.
Power density w
t
of a signal transmitted by an isotropic antenna is given by
w
t
P
t
4pR
2
W=m
2
2:4:12
where P
t
is the transmitted power in watts and R is the distance from the antenna in
meters. The power received by a unity gain antenna located at R is found to be
P
r
w
t
A
eu
2:4:13
where A
eu
is the effective area of an isotropic antenna.
From (2.4.6), for an isotropic antenna
G
4p
l
2
A
eu
1
or,
A
eu
l
2
4p
Hence, (2.4.12) can be written as
P
r
P
t
4pR
2
Â
l
2
4p
2:4:14
and the space loss ratio is found to be
P
r
P
t
l
4pR
2
2:4:15
ANTENNA SYSTEMS
25
It is usually expressed in dB as follows:
Space loss ratio 20 log
10
l
4pR
dB 2:4:16
Example 2.5: A geostationary satellite is 35 860 km away from the earth's surface.
Find the space loss ratio if it is operating at 4 GHz.
R 35860000 m
and,
l
3 Â 10
8
4 Â 10
9
0:075 m
Hence,
Space loss ratio
4p  35860000
0:075
2
2:77 Â 10
À20
À195:5752 dB
Friis Transmission Formula and the Radar Range Equation
Analysis and design of communication and monitoring systems often require an
estimation of transmitted and received powers. Friis transmission formula and the
radar range equation provide the means for such calculations. The former is
applicable to a one-way communication system where the signal is transmitted at
one end and is received at the other end of the link. In the case of the radar range
equation, the transmitted signal hits a target and the re¯ected signal is generally
received at the location of the transmitter. We consider these two formulations here.
Friis Transmission Equation
Consider a simpli®ed communication link as illustrated in Figure 2.5. A distance R
separates the transmitter and the receiver. Effective apertures of transmitting and
Figure 2.5 Simpli®ed block diagram of the communication link.
26
COMMUNICATION SYSTEMS
receiving antennas are A
et
and A
er
, respectively. Further, the two antennas are
assumed to be polarization matched.
If power input to the transmitting antenna is P
t
then isotropic power density w
o
at
a distance R from the antenna is given as follows:
w
o
P
t
e
t
4pR
2
2:4:17
where e
t
is the radiation ef®ciency of the transmitting antenna.
For a directional transmitting antenna, the power density w
t
can be written as
follows:
w
t
P
t
G
t
4pR
2
P
t
e
t
D
t
4pR
2
2:4:18
where G
t
is the gain and D
t
is the directivity of transmitting antenna.
Power collected by the receiving antenna is
P
r
A
er
w
t
2:4:19
From (2.4.6),
A
er
l
2
4p
G
r
2:4:20
where the receiving antenna gain is G
r
.
Therefore, we ®nd that
P
r
l
2
4p
G
r
w
t
l
2
4p
G
r
P
t
G
t
4pR
2
or
P
r
P
t
l
4pR
2
G
r
G
t
e
t
e
r
l
4pR
2
D
r
D
t
2:4:21
If signal frequency is f then for a free-space link,
l
4pR
3 Â 10
8
4pfR
where f is in Hz and R is in meters.
ANTENNA SYSTEMS
27