Tài liệu HPLC for Pharmaceutical Scientists 2007 (Part 8D) pdf
Bạn đang xem bản rút gọn của tài liệu. Xem và tải ngay bản đầy đủ của tài liệu tại đây (446.82 KB, 17 trang )
8.5.5.5 Case Study 2: Concluding Remarks. Extreme changes in selectivity
and reversal of elution order of phenolic isomeric compounds were obtained
after changing either the pH of the mobile phase, the temperature of the
system, or the type of organic eluent employed. Changes in the analyte ion-
ization state were observed upon increasing the acetonitrile composition as
well as the temperature. Method development for ionizable analytes requires
a judicious choice of the mobile-phase conditions and system parameters in
order to perform the analysis of the compounds in their desired ionization
state. Choosing the optimal parameters in the “chromatographer’s toolbox”
allows for the development of rugged and reproducible methods.
8.5.6 Case Study 3: Method Development for a Diprotic Basic Compound
A case study is presented for the method development of a diprotic base com-
pound. The first step in method development is to look at the chemical struc-
ture of the analyte and to determine if there are any ionizable sites on the
molecule. If there are ionizable sites then their respective pK
a
values should
be determined. The pK
a
values may have been already determined by the pre-
formulation group and close communication with that group would avoid
duplication of work. However, commercially available programs such as ACD
Labs (Advanced Chemistry Development,Toronto, Canada) are also available
to allow for in-silico prediction of the analyte pK
a
. Also, using selected frag-
ments of the molecule can also be helpful for pK
a
determination of the desired
molecule because the pK
a
values for each of these fragments of the molecule
may be readily available from the literature. This is only an estimate at best,
but can guide the chromatographer down the right path for initial mobile-
phase pH selection.
In the following case study for this pharmaceutical compound M, the
method development scenario and rationale for each iteration in the method
development process is highlighted. Also, a method development flow chart
for gradient separations is included which can be used as a general strategy
for method development (Figure 8-37). References are made in this case study
to the flow chart in Figure 8-37.
8.5.6.1 Step 1: Analyze the Molecule. In Step 1 of the flow chart (Figure
8-37) it is recommended to analyze the molecule from a physicochemical point
of view (knowledge of the pK
a
, log P, log D). The structure of the compound
must be analyzed to determine the ionizable functionalities, and the pK
a
values
of each ionizable group should be determined. In this case, Product M is a
diprotic base with two pK
a
values 3.3 and 5.3 estimated by ACD. This com-
pound contains an aromatic basic functional group (pyridinal nitrogen) with
an electron-withdrawing group, chlorine, in the meta position and also
contains electron-donating groups on the same aromatic ring. Electron-
withdrawing groups such as chlorine tend to intensify the positive charge of
the anilinium/pyridinum ion; this destabilizes the ion relative to the free
METHOD DEVELOPMENT APPROACHES 405
amine/pyridine, therefore decreasing the basicity compared to pyridine (pK
a
5.2). If one does not have a program to predict pK
a
, the pK
a
of this analyte
could be estimated to be close to that of meta chloro pyridine,
w
w
pK
a
2.95. The
other basic functionality contains a phenyl group attached to a morpholine
group. The pK
a
of morpholine is 8.8; but because the phenyl ring is attached
to the nitrogen group, this leads to resonance stabilization and consequently
leads to a reduction of the analyte pK
a
.
Note that because this compound does have multiple basic functionalities,
two ionization equilibria could be written for this amphoteric species. At
mobile
w
w
pH values between 3 and 5 the existence of multiple species is
expected. Since the two pK
a
values are close to one another (~2 pK
a
units
apart), the inflection points overlap, making titration and/or chromatographic
406 METHOD DEVELOPMENT
Figure 8-37. Method development flow chart for gradient separations.
pK
a
prediction for each ionizable functionality difficult. At
w
w
pH 4.3, the basic
site (pyrdinal nitrogen) is predominately neutral (90%) and the other basic
site (morpholine nitrogen) is predominately ionized (90%). In turn, it would
be expected to observe only one inflection point from both the potentiomet-
ric titration and chromatographic determination of the pK
a
.
Alternatively, if the pK
a
of the analyte is not known and software is not
available for in-silico prediction of the pK
a
, the chromatographer can go
directly to step 2 (determine the isocratic conditions for pH scouting studies)
and step 3 (determine pK
a
chromatographically) in the flow chart in Figure 8-
37. The analyte could be analyzed at six different pH values at a particular
organic composition (isocratic mode) for an estimate of the analyte
s
s
pH and
for determination of the suitable chromatographic conditions to analyze the
analyte.
If the pK
a
is known, the chromatographer can go directly to step 4.
8.5.6.2 Step 2: Determine the Isocratic Conditions for pH Scouting
Experiments. If the chromatographer intends to determine the chromato-
graphic pK
a
and understand the influence of mobile-phase pH on the target
analyte retention, pH scouting studies need to be performed in isocratic mode.
In order to begin this process, the appropriate set of isocratic conditions to
adequately retain the analyte in its fully ionized form and to elute the analyte
in its fully neutral state needs to be determined. Usually a steep gradient run
is used to estimate the initial isocratic elution conditions. In an example
shown in Figure 8-38 a probe linear gradient from 5 to 95 v/v% acetonitrile
METHOD DEVELOPMENT APPROACHES 407
Figure 8-38. Mobile phase
A: 0.2 v/v% H
3
PO
4
. Mobile phase B: Acetonitrile, linear
gradient from 5% B to 95% B over 10 min. Column: Luna C8(2) 150 × 4.6 mm.
Injection volume, 10 µL; flow, 1.0 mL/min; wavelength, 300 nm, column temperature,
35°C.
from 0–10 min was run and the target basic analyte (in its predominately
ionized form) eluted at 6.0 min. The
w
w
pH of the mobile phase was 1.9 and the
flow rate was 1.0 mL/min. Note that the selection of the UV wavelength of
detection should have already been performed using off-line UV, or alterna-
tively a diode array detector can be used and the proper wavelength for detec-
tion would consequently be extracted during the data processing. The
concentration of organic in isocratic mode, which is necessary for the adequate
retention of the analyte in its ionized form, now can be estimated. The
w
w
pH of
the aqueous portion of the mobile phase was chosen to be 1.9 (0.2 v/v%
H
3
PO
4
) and the flow rate was 1.0 mL/min. Using the linear gradient from 5 to
95 v/v% acetonitrile over 10 min, the v/v% organic per minute was calculated
as 9 v/v% ACN/min (Scheme 1). However, the dwell volume (V
D
) of the instru-
ment must be accounted for because the actual gradient does commence
within the column until about 1–2 min (depending on the instrument and
instrumental setup). The dwell volume of most common HPLC systems is 1–2
mL and can be easily determined (see reference 19 for details). However, at
1 mL/min flow rate (F), an estimate of a 1.5-min dwell time (t
D
) was used for
this purpose (t
D
= V
D
/F). Note that the velocity of the analyte moving through
the column under gradient conditions is not constant and follows a pseudo-
exponential profile (see Chapter 2, Section 2.17). The estimation given in
Scheme 1 serves as an approximation to determine the starting isocratic
elution conditions from the probe gradient run. By taking into account the
gradient slope of 9% ACN/min and accounting for the dwell time (1.5 min)
and elution time (6 min from Figure 8-38) of the analyte from the probe gra-
dient run, the estimated isocratic composition to elute the analyte at the same
retention as in the gradient probe run can be calculated as shown. The esti-
mated isocratic composition in which the analyte would elute at 6 min (k ~3.5)
is estimated as 41 v/v% acetonitrile ±10% acetonitrile using 0.2 v/v% H
3
PO
4
(
w
w
pH 1.9) mobile phase. The isocratic conditions chosen to perform the pH
scouting study was 30 v/v% acetonitrile.
408 METHOD DEVELOPMENT
Gradient slope × (Elution time from probe gradient run − Dwell time)
= Isocratic % organic composition ± 10% organic composition
9% ACN/min × (6 min − 1.5 min) = 41% ACN ±10% ACN
Gradient Slope =
90% ACN
min
ACN
min
Dwell Time =
1.5 mL
mL
min
10
9
10
15
=
=
%
.
. min
Scheme 1. Estimation of isocratic conditions from gradient probe run.
8.5.6.3 Step 3: Determine pK
a
Chromatographically. The retention of the
analyte can be determined at different eluent pH values and can be used to
determine its pK
a
in a particular hydro-organic mixture and assist the chro-
matographer in proper pH selection for the aqueous portion of the mobile
phase. The goal is to avoid a pH region where minor changes in pH can
adversely affect the retention of the target analyte. If the pK
a
values are not
known, it is suggested to perform the pH scouting experiments from pH 1.5
to 10 (at least five
w
w
pH values should be investigated). In this example, the pK
a
values of the two ionization centers were predicted by ACD, and the
s
s
pH
values chosen were at least 1 unit less than the lowest
s
s
pK
a
in the molecule
and at least 1 unit greater than the highest
s
s
pK
a
of the molecule. Generally,
the pK
a
of a basic compound decreases by about 0.2 pK
a
units per 10 v/v% ace-
tonitrile (see Chapter 4, Sections 4.5 and 4.6) and if 30 v/v% acetonitrile is
used, it is expected to lead to a reduction of 0.6 pK
a
units (0.2*3 = 0.6 pK
a
unit
basic analyte pK
a
shift) for both basic ionization centers. Therefore this cor-
relates with a
s
s
pK
a
of 2.7 for pyridinal nitrogen (i.e., 3.3 − 0.6 = 2.7) and with
a
s
s
pK
a
of 4.7 for the morpholinal nitrogen (i.e., 5.3 − 0.6 = 4.7). The expected
pK
a
determined by chromatography is to be midpoint of these two
s
s
pK
a
values
(i.e., 3.7).
In step 3, for this study the upper
s
s
pH for the mobile phase to be prepared
was determined to be
s
s
pH 6.7 (at least two units greater than the highest
s
s
pK
a
of the molecule). The lower
s
s
pH for the mobile phase (containing 30 v/v%
MeCN) that should be prepared for this study should be 1.7, but this would
mean that an aqueous mobile-phase
w
w
pH of 1.1 would have to be prepared to
obtain a
s
s
pH of 1.7 (see Chapter 4, Section 4.5 for pH shift). Remember that
the pH shift of the mobile phase for a phosphate buffer is approximately
0.2 pH units in the upward direction for every 10 v/v% acetonitrile. In this
case, not to compromise the stability of the packing material (column chosen
has recommended a lower pH limit of
w
w
pH 1.5), a pH of
w
w
pH 1.6 was
chosen to be prepared which correlates to a
s
s
pH of 2.2 (
w
w
pH 1.6 + 0.6 units
upward pH shift upon addition of 30 v/v% acetonitrile). Most definitely the
final method will not be set at this low pH, since the analyte would exist in
multiple ionization states; however, the experiment was performed at this low
pH to elucidate the effect of the pH on the analyte retention in this low-pH
region.
Five to six
s
s
pH values would then be chosen between
s
s
pH 2.2 and 6.7 to run
the pH study at isocratic conditions (30 v/v% MeCN). In Figure 8-39 the chro-
matographic retention as a function of the
s
s
pH are shown. Note that blanks
do not need to be run, just multiple injections of the same analyte. Once the
retention of multiple injections of the target analyte is achieved, the column
is deemed to be equilibrated with the mobile phase. Usually after eluting 25
column volumes through the column, the column is assumed to be equilibrated
(this may not be the case if an ion-pairing reagent is used). In this study, three
injections at each pH were run. Only the last injection is shown in Figure
8-39 and Table 8-8. One recommendation is to perform the pH study either
METHOD DEVELOPMENT APPROACHES 409
from low to high pH or from high to low pH for faster equilibration between
each successive pH experiments.
The k (retention factor) values are then plotted versus the
s
s
pH values, and
the inflection point of this sigmoidal relationship could be taken as the
s
s
pK
a
of that particular compound at particular hydro-organic mixture. The
s
s
pK
a
determined at 30 v/v% MeCN was determined to be 3.9 (using nonlinear
regression analysis program MathCad 8). This corresponds well to our origi-
nal estimation of
s
s
pK
a
3.7.
The retention of this analyte leveled off between pH values
w
w
pH 4.6 (
s
s
pH
~5.2) and
w
w
pH 6.1 (
s
s
pH ~6.7), where the analyte is in its neutral form. No lower
410 METHOD DEVELOPMENT
Figure 8-39. Phenomenex Luna 3u C8(2) Column. [150 × 4.6 mm, 3 µm]. Mobile
phase: 10 mM K
2
HPO
4
, acetonitrile (70 : 30, v/v), pH adjusted with w/ H
3
PO
4
; flow rate,
1.0 mL/min; injection volume, 10 µL; wavelength, 247 nm., column temperature, 35°C.
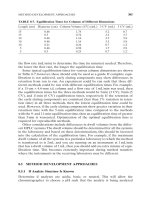
TABLE 8-8. Retention of Diprotic Compound at
w
w
pH
and
s
s
pH
w
w
pH
s
s
pH t
R
6.1 6.7 49.8
4.6 5.2 49.1
3.6 4.2 34.3
2.6 3.2 11.2
2.1 2.7 6.0
1.6 2.2 3.8