Tài liệu HPLC for Pharmaceutical Scientists 2007 (Part 8E) docx
Bạn đang xem bản rút gọn của tài liệu. Xem và tải ngay bản đầy đủ của tài liệu tại đây (298.65 KB, 7 trang )
422 METHOD DEVELOPMENT
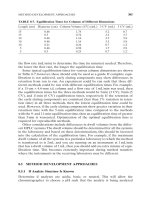
Figure 8-47. Resolution map for all critical pairs. Color scale on the left indicates the
minimum resolution that is predicted for a particular color in the resolution map. The
x axis is the gradient time and the y axis is the temperature. The crosshair can be moved
to obtained the predicted conditions for optimal resolution of all critical pairs. See color
plate.
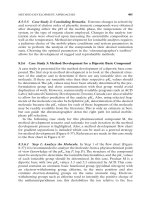
Figure 8-48. (T
op) Drylab-predicted chromatogram versus (bottom) verification run.
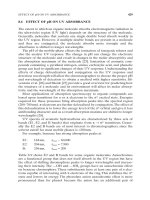
8.5.6.12 Running Forced Degradation Samples. Prior to initiating method
development as was mentioned in Section 8.4, the structure must be analyzed
to predict most probable degradation products. For this compound in this
case study, it has an amide functionality, so most probable impurity is the
carboxylic acid impurity. It was indeed determined by a forced degradation
study (acidic conditions) that it was the major acid hydrolysis degradation
product. Using the method that was optimized by Drylab, a forced degrada-
tion sample was run that was stressed at 50°C for 1 week in pH 1 diluent. It
was noted that a major impurity was formed (Figure 8-49) and was determined
to be the carboxylic acid impurity by MS analysis. This compound contains an
amide and is prone to hydrolysis. Scheme 2 shows the potential degradation
pathway. Therefore to enhance the retention of this potential degradation
product the initial organic composition of the gradient was reduced from 35%
to 25 v/v% acetonitrile (Figure 8-49). The carboxylic acid impurity has an
enhanced retention at lower organic composition and had adequate resolu-
tion between active and impurity eluting after main component was still
obtained.
METHOD DEVELOPMENT APPROACHES 423
Scheme 2.
Using this optimized method shown in Figure 8-49 that starts at 25 v/v%
acetonitrile, LC-MS studies were performed to determine the [M + H]
+
ion of
the impurity that has been resolved from the main peak. The mass spectrum
of Product M was taken and was shown to be spectrally homogeneous. The
mass spectrum of the impurity (RRT 1.04) that has now been resolved from
the main peak was also taken. The UV and the total ion chromatograms are
shown in Figure 8-50. This impurity, RRT 1.04, has the same [M + H]
+
ion that
was co-eluting with the main component in the initial separation on the C8
424 METHOD DEVELOPMENT
Figure 8-49. Effect of organic composition on the retention of carboxylic acid degra-
dation product. Column: Waters Sunfire C18, 3.5 µm, 150 × 4.6 mm. (A) 10 mM
NH
4
OAc, pH 5.8. (B) Acetonitrile: Flow, 1.5 mL/min; temperature, 35°C.
Figure 8-50. Chromatographic conditions: Column: Sunfire C18, 3.5 µm, 150 × 4.6 mm.
Mobile phase: 10 mM NH
4
OAc, pH 5.8; acetonitrile, 25% acetonitrile to 75% acetoni-
trile over 10 min and 5-min hold at 75% acetonitrile. Wavelength: 247 nm, column tem-
perature, 35°C, flow, 1.3 mL/min; injection volume, 10 µL; MS conditions flow split 10 :
1. ESI: + ion mode, single quadrupole, Z-Q. Capillary, + 3.5 kV; cone, 25V; source tem-
perature, 150°C; desolvation temperature, 400°C; cone gas flow, 113 L/hr; desolvation
gas flow, 419 L/hr.
column (Figure 8-41). This confirms that the optimized method was able to
resolve the impurity from the main component.
8.5.6.13 Final Optimization. The method could then be further optimized
for speed by increasing the flow rate and decreasing gradient time (t
g
) pro-
portionally or by decreasing gradient range (∆%) and decreasing t
g
pro-
portionally. These are further discussed in Chapter 17, Section 17.3. The
temperature could be increased as well, but the chromatographer should be
aware that although increases in speed may be realized, the selectivity may
change with modifications in the temperature.
Other potential improvements in the method could include using a smaller
(e.g., 3mm) i.d. column while using the same length column and particle size
of the packing material. A 3.0-mm-i.d. column can be used to reduce solvent
waste, since columns with smaller diameters have reduced column volume and
require use of lower flow rates, and therefore they can decrease solvent waste
by at least 60%. A simple calculation to achieve equivalent retention on a
smaller-i.d. column at the same linear velocity is shown in equation (8-2).
For example, if the original method used a 15-cm × 4.6-mm column with a
1.5 mL/min flow rate, what would be the equivalent flow rate for a 15-cm × 3-
mm column? Using the following equation, this can be calculated.
(8-2)
If you divide the 1.5-mL/min flow rate by 0.425, then a flow rate of 0.64 mL/min
is obtained. Moreover, use of lower flow rates can lead to enhanced ionization
efficiency using ESI (no flow splitting). Increasing the flow rate increases
droplet size, which decreases the yield of gas-phase ions from the charged
droplets.
8.5.6.14 Case Study 3: Concluding Remarks. There is no cookbook for
method development. The strategies presented an approach that could be
taken for effective method development and optimization. In summary, a steep
gradient was used initially to predict the suitable isocratic conditions for deter-
mining the most suitable pH for the method. The retention behavior of active
as a function of pH (isocratic) was determined. The best mobile-phase pH for
further gradient experiments was determined. Also, ACD was shown to be
able to estimate the pK
a
of the molecule; and by applying the rules based on
pH shift of the mobile phase and pK
a
shift of the analyte upon addition of
organic component, the optimal pH for analysis was predicted. In order to elu-
cidate if there was co-elution of impurities with the target analyte spectral
homogeneity was assessed using both PDA and LC-MS. If possible, use
AMDS/Dry Lab for method optimization and then use MS to confirm the sep-
aration of active species from possible co-eluting species. MS/MS analysis can
Π
Π
rL
rL
r
r
2
30
2
46
30
46
0
425
.
.
.
.
.
-i.d.column
-i.d.column
-i.d.column
2
-i.d.column
2
==
METHOD DEVELOPMENT APPROACHES 425
be performed for further structural elucidation of the impurities. Deuterated
experiments can be performed to support structural assignments.
8.5.7 Case Study 4: Structural Elucidation Employing a Deuterated Eluent
The fine structural details of analytes could be further defined by a deuterium-
exchange experiments that measures the number of exchangeable protons in
each molecule. The number of exchangeable protons in a molecule can be
determined based on the mass shift. This technique allows an understanding
of which protons are susceptible to exchange, but also can be used to differ-
entiate compounds of the same molecular weight that have a different number
of exchangeable protons. Deuterium exchange provides strong evidence to
support degradation product and synthetic by-product elucidation. Take, for
example, the two compounds 5-aminoindazole and 1-aminoindan, both of
which have an [M + H]
+
of 133.9. An HPLC method was developed to sepa-
rate these two compounds (Figure 8-51). The mass spectra for each compound
are shown in Figures 8-52A and 8-52B. Both of these compounds show
[M + H]
+
ions of 133.9.
If an analytical chemist were to discern between these two compounds,
MS/MS analysis could be performed, but if only a single quadrupole instru-
ment was available, what additional experiments could the analytical chemist
perform on the single quadrupole instrument? The use of deuterated mobile
phases could be used. Since 5-aminoindazole has three exchangeable protons
and 1-aminoindan has only two exchangeable protons, by using a deuterated
mobile phase the [M + D]
+
species would be different. Both these compounds
were run by the same HPLC method as in Figure 8-51, but with a deuterated
mobile phase (70% D
2
O : 30% MeCN). The mass spectra of the two
components were taken from this chromatographic run. In Figure, 8-53,
426 METHOD DEVELOPMENT
Figure 8-51. HPLC separation of 5-aminoindazole (R
T at 1.23 min) and 1-aminoindan
(RT at 2.28 min), 70% H
2
O:30% MeCN. Flow, 0.5 mL/min; Waters symmetry shield,
50 × 4.6 mm, 5 µm.