Determining the intrinsic value of common stock – the case of DHG pharmaceutical joint stock company
Bạn đang xem bản rút gọn của tài liệu. Xem và tải ngay bản đầy đủ của tài liệu tại đây (1.72 MB, 108 trang )
INTRODUCTION
1. Rationales of the research
Vietnam's stock market has been born for 22 years since 1998 but has made a strong
development, making an important contribution to the country's economic
development. Vietnam's stock market is happening very vibrant and growing quite
fast. Contributing to the success of the stock market is the participation of its
members: government, financial intermediaries, listed companies and investors.
Securities investment is a new investment channel for our country's financial
market, bringing a lot of profits for domestic and foreign investors. However, it also
contains great risks. In order to make the stock market more stable and professional,
when deciding to invest, investors must analyze and revalue stocks. Valuation is
absolutely necessary. It helps listed companies determine the fair price when issuing
stocks, determining the cost of equity as well as the cost of merger and acquisition.
Besides, stock valuation helps commercial banks to determine stock value before
deciding to lend. Valuing stocks is also an indispensable stage in all decisions of
individuals as well as organizations, help investors know the real value of stocks,
find investment opportunities and make appropriate investment decisions.
Supply and demand activities in the market are often sentimental and follow the
“herd mentality” so the stock price is raised, far exceeding its real value. Therefore,
many investors have made the wrong decision. They have suffered heavy economic
losses from those mistakes. On the one hand, the stock valuation methods have its
own advantages and disadvantages. This is a challenge for analysts: How to choose
the right and most appropriate valuation methods for Vietnam's stock market and
for each type of business? On the other hand, stock valuation carry subjective views
as well as depending on the qualifications of the analysts. As a result, it still has
multi – dimensional perspectives, positive and negative sides of the valuation
results.
With a desire to find reasonable valuation methods for stocks on Vietnam's stock
market and then make recommendations to improve the financial position of a
particular enterprise, help the intrinsic value of shares of that enterprise increase in
the future, I decided to choose the research topic: DETERMINING THE
INTRINSIC VALUE OF COMMON STOCK – THE CASE OF DHG
PHARMACEUTICAL JOINT STOCK COMPANY.
Research questions
- What is the intrinsic value of DHG stock after applying alternative
valuation methods and recommendation to different stakeholders?
2. Objectives of the research
General objectives
On the basis of theories of stock analysis and stock valuation, analyzing and
valuing DHG stock. Since then, making recommendations to investors and
business managers.
Particular objectives
- Systematizing the theory of common stock analysis and pricing.
- Analyzing the financial ratios of DHG Pharmaceutical Joint Stock
Company.
- Applying valuation methods to value DHG stock.
- Describing the difficulties in the process of valuing DHG stock.
- Making recommendations for investors and business managers.
3. Subjects and scope of the research
Research subject: Determining the intrinsic value of DHG stock.
Research scope:
- Space: DHG Pharmaceutical Joint Stock Company.
- Time: Statistics collected from 2015 to 2019.
4. Research methodology
Secondary data collection
Literature review
Alternative valuation methods such as FCFF, FCFE, DDM, P/E, P/B. Details
of methods will be explained clearly in chapter 1.
5. Organization of the graduation thesis
Apart from Introduction, Conclusion, Recommendations and References; contents
of the graduation thesis are organized into 4 chapters:
Chapter 1: Literature review of stock valuation
Chapter 2: Analysis of macroeconomic environment and pharmaceutical industry
Chapter 3: Financial situation analysis through financial ratios
Chapter 4: Valuation for stock of DHG Pharma – Recommendation for
stakeholders
CHAPTER 1
LITERATURE REVIEW OF STOCK VALUATION
1.1. Introduction of some theoretical issues about stock valuation
1.1.1. Stock market
Stock market is a place where shares of pubic listed companies are traded (Frederic
S. Mishkin, 2010, p. 8). Buying and selling securities can take place in the primary
market, secondary market, stock exchange, over – the counter market, spot market
or future market. It help stockholders earn profits from selling securities and its
price depends on the supply and demand of the market at that time. Securities are
issued for the purpose of raising capital for businesses/ companies or the
government.
1.1.2. Common stock
1.2.2.1. Definition
Common stocks, also known as equity securities or equities, represent ownership
shares in a corporation. Each share of common stock entitles its owner to one vote
on any matters of corporate governance that are put to vote at the corporation’s
annual meeting and to a share in the financial benefits of ownership (Bodie, Jane &
Marcus, 2014, p. 41).
1.1.2.2. Characteristics of common stock
The two most important characteristic of common stock as an investment are its
residual claim and limited liability features.
Residual claim means that stockholders are the last in line of all those who
have a claim on the assets and income of the corporation. In a liquidation of
the firm’s assets, the shareholders have a claim to what is left after all other
claimants such as the tax authorities, employees, suppliers, bondholders, and
other creditors have been paid. For a firm not in a liquidation, shareholders
have claim to the part of operating income left over after interest and taxes
have been paid. Management can either pay this residual as cash dividends to
shareholders or reinvest it in the business to increase the value of the shares.
Limited liability means that the most shareholders can lose in the event of
failure of the corporation is their original investment. Unlike owners of
unincorporated businesses, whose creditors can lay claim to the personal
assets of the owner (house, car, furniture), corporate shareholders may at worst
have worthless stock. They are not personally liable for the firm’s obligations.
1.1.3. Corporation
1.1.3.1. Definition
A corporation is a business owned by stockholders, or shareholders. A business
becomes a corporation when the state approves its articles of incorporation 1and the
first stock share is issued. Unlike a proprietorship and a partnership, a corporation is
legal entity distinct from its owners (Horngren, Harrison & Oliver, 2012, p. 6).
1.1.3.2. Advantages and disadvantages of a corporation
Advantages:
Separate legal entity
A corporation is a distinct entity from a legal perspective. It is an entity that
exists apart from its owners. However, the corporation has many of the rights
that a person has. Items that the business owns (its assets) and those items that
the business has to pay later (its liabilities) belong to the corporation and not
the individual stockholders.
Transferable ownership rights
Stockholders may transfer stock as they wish by selling or trading the stock to
another person, giving the stock away, bequeathing it in a will or disposing of
the stock in any other way. The transfer of stock is entirely at the discretion of
1
The articles of incorporation are the rules approved by the state that govern the management of the
corporation
the stockholder. It does not require the approval of either the corporation or
other stockholders.
Continuous life
The life of a corporation is stated in its charter. The life may be perpetual, or it
may be limited to a specific number of years. If it is limited, the company can
extend the life through renewal of the charter.
Limited liability of stockholders
Since a corporation is a separate legal entity, creditors have recourse only to
corporate assets to satisfy their claims. The liability of stockholders is
normally limited to their investment in the corporation. Creditors have no legal
claim on the personal assets of the owners unless fraud has occurred.
Ability to acquire capital
It is relatively easy for a corporation to obtain capital through the issuance of
stock. Buying stock in a corporation is often attractive to an investor because a
stockholder has limited liability and shares of stock are readily transferable.
Disadvantages:
Separation of ownership and management
Stockholders legally own the corporation. However, they manage the
corporation indirectly through a board of directors they elect. Thus,
stockholders do not have to disrupt their personal affairs to manage the
business.
Additional taxes
Corporations are separate taxable entities. First, corporations pay their own
income tax on corporate income. Then, the stockholders pay personal income
tax on the earnings that they receive from corporations.
Government regulation
To protect persons who loan money to a corporation or who invest in its stock,
states monitor the actions of corporation. Corporations are subjected to more
governmental regulation than other form of business.
1.1.4. Intrinsic value versus market price
The intrinsic value of an asset is the present value of expected future cash flows
earning from that asset, discounted to the present with the investor’s appropriate
required rate of return.
The market value of an asset is its price when it is traded in the market. This value
is determined by supply and demand in the market.
If the intrinsic value, or the investor’s own estimate of what the stock is really
worth, exceeds the market price, the stock is considered undervalued and a good
investment. If the intrinsic value is lower than the market value, this stock is
overpriced in the market. If the stock market works effectively, market value and
real value of securities would be equal. Anytime, when the intrinsic value of a
security is different from its current market value, the competition between
investors seeking profit opportunities will quickly push market prices back to their
intrinsic values. Therefore, an effective market is one in which the value of all
securities at any time fully reflects all publicly available information. In such a
market, the market value and the intrinsic value are the same.
1.1.5. Definition of stock valuation
Stock valuation is a method of determining the intrinsic value of a stock. The
importance of valuing stocks evolves from the fact that the intrinsic value of a stock
is not attached to its current price. By knowing a stock’s intrinsic value, an investor
may determine whether the stock is overvalued or undervalued at its current market
price.
If the intrinsic value is greater than the market price, the stock is considered
undervalued. At that time, investors will buy this stock because the price of the
stock will increase to return to its intrinsic value. In contrast, investors will not buy
stocks being sold at prices higher than their intrinsic value because after a while, the
stock price will decline to return to its intrinsic value.
1.2. Stock analysis
Stock analysis is a top-down approach in 3 steps: Economic analysis, industry
analysis and company analysis.
1.2.1. Economic analysis
To determine the fair price for a company's stock, securities analysts must forecast
dividends and expected earnings from the company. The performance of each
company will be influenced by the state of the overall economy and each industry.
In addition, the macroeconomic picture affects stocks in different ways with varying
degrees. In conclusion, analyzing the economy including the global economy and
the domestic economy to identify the factors that positively and negatively affect
the company, and then make forecasts for the valuation of the company's stock.
1.2.1.1. Global economy
First, world economic growth may affect the domestic economic situation, import
and export prospects, industry and company.
Second, exchange rate between domestic currency and foreign currency. Exchange
rate affects import and export trends, trends of accumulation and investment of the
economy.
1.2.1.2. Domestic macroeconomic
Volatility of the stock market is closely related to the domestic macro economy.
The analysis of the macro economy is to assess the business environment and the
impact of the business environment on the operation and business results of the
company, and then impact on the company's stock price. There are many basic
macro factors that directly affect stock analysis and stock valuation.
Gross domestic product (GDP): is the market value of all final goods and
services produced within a country in a given period of time (N. Gregory
Mankiw, 2011, p. 494). During the flourishing period, GDP increases and vice
versa during the recession, GDP decreases.
Inflation: is a situation in which the economy’s overall price level is rising (N.
Gregory Mankiw, 2011, p. 514). The inflation rate is the percentage change in
the price level from the previous period. Inflation is often accompanied by
economic growth and an increase in the number of jobs. Inflation itself is not
bad because Inflation could encourage economic development. Moderate
increases in price level tend to stimulate investment, including domestic
investment and foreign investment, maintaining high employment rate and
increase in GDP. In contrast, high inflation would reduce growth and limit
investment.
Interest rate: is the cost of borrowing, or the price paid for the rental of funds
(Frederic S. Mishkin, 2012, p. 38). Interest rates are probably the most
important macroeconomic factors to consider in investment analysis. The
increase in interest rates could be bad news for the stock market. Although
there are many different interest rates in the economy, these interest rates tend
to vary in the same direction, so economists often discuss at a representative
interest rate.
1.2.2. Industry analysis
Industry analysis is the analysis of a specific industry (production, service, trade),
which helps enterprises and analysts understand the industry's competitive
advantage, including: supply and demand statistics, the level of competition in the
industry and with other emerging industries, future prospects and the influence of
external factors on the industry. Industry analysis is important for the same reasons
as macroeconomic analysis; similarly, it is unusual for a firm in a troubled industry
to perform well.
1.2.3. Company analysis
1.2.3.1. Financial ratio analysis
Ratio analysis expresses the relationship among selected items of financial
statement data. A ratio expresses the mathematical relationship between one
quantity and another. The relationship is expressed in terms of either a percentage, a
rate, or a simple proportion.
Liquidity ratios
Liquidity ratios measure the short-term ability of the company to pay its
maturing obligations and to meet unexpected needs for cash
1. Current ratio
Current ratio =
The current ratio measures a company’s ability to pay current liabilities
with its current assets (Horngren, Harrison & Oliver, 2012, p. 733). The
higher the value of this ratio, the better the ability to pay current liabilities
of the enterprise. If current ratio is less than 1, enterprises cannot afford to
pay short-term debts. However, if this ratio is too high, it means the
company has invested too much in short-term assets beyond what it needs.
Normally, that surplus will not make a profit, so that investment will be less
effective.
2. Quick ratio
Quick ratio =
Quick ratio indicates the ability to repay short-term debts regardless of the
sale of inventories. Inventories are typically the least liquid of a firm current
assets, and if sales slow down, they might not be converted to cash as
quickly as expected (Brigham & Houston, 2019, p. 110). Removing this
item will more accurately reflect a company's ability to pay its liabilities if
they came due immediately. If this ratio is less than 1, the enterprise cannot
afford to pay all the short-term debts immediately.
3. Cash ratio
Cash ratio =
This ratio reflects the ability to pay short-term debts with its available
amount of cash and assets can be converted quickly into cash in the
business.The cash ratio is too high, it means that the company reserves too
much cash, it would miss the opportunity to make a profit. Creditors often
rate the reasonable level for this ratio to be 0.5. When this ratio is greater
than 0.5, solvency in cash of the business is positive and vice versa.
Asset management ratios
The management ratios measure how effectively the firm is managing its
assets.
1. Inventory turnover
Inventory turnover =
Inventory turnover measures the number of times, on average, the inventory
is sold during the period. Its purpose is to measure the liquidity of the
inventory (Weygandt, Kimmel & Kieso, 2014, p. 724). It should be noted
that inventories are of a business nature, so not every low inventory level is
good, high inventory level is bad.
Days’ sales in inventory (DOH)
Days’ sales in inventory =
This measures the average number of days inventory is held by the
company.
2. Receivables turnover
Receivable turnover =
It measures the number of times, on average, the company collects
receivables during the period (Weygandt, Kimmel & Kieso, 2014, p. 724).
The greater the ratio, the faster the debt recovery rate of the enterprise, the
higher the ability to convert receivables to cash. This helps businesses
create the initiative in financing working capital in production. In contrast,
if this ratio is low, the amount of cash in business appropriated would
increase, the amount of cash will decrease, which reduces the initiative of
enterprises in financing working capital in production and businesses may
need to borrow from banks to finance this working capital.
Days of sales outstanding (DSO)
Days of sales outstanding =
Days of sales outstanding represents the average length of time the firm must
wait after making a sale before receiving cash (Brigham & Houston, 2019, p.
112). Tracking the change in the days of sales outstanding will help businesses
timely make adjustments to the credit policy and collection policy. The shorter
the ratio, the faster the speed of debt collection from customers, enterprises are
less likely to have their capital appropriated. In contrast, the longer the days of
sales outstanding indicates the slower the collection speed, enterprises are at
risk of being appropriated a lot of capital. The higher the receivable turnover,
the lower the days of sales outstanding and vice versa.
3. Fixed assets turnover
Fixed assets turnover =
Fixed assets turnover measures how effectively the firm uses its plant and
equipment (Brigham & Houston, 2019, p. 113). This ratio help answer this
question: How much is net revenue for every Vietnam dongs spent on fixed
assets?
4. Total assets turnover
Total assets turnover =
Total assets turnover measures how effectively the firm uses its total assets.
Total assets turnover shows: How much is net revenue for every Vietnam
dongs spent on total assets? The higher this ratio proves that the assets are
moving quickly, contribute to increasing of sales and is a condition to improve
profits of the business. In contrast, this low ratio indicates that the assets are
moving slowly.
Debt management ratios
Debt management ratios are a set of ratios that measure how effectively a firm
manages its debt.
1. Total debt ratio
Total debt ratio =
Total debt ratio shows the proportion of assets financed with debt
(Horngren, Harrison & Oliver, 2012, p. 738). If this ratio is low, it shows
that the enterprises borrow less. This implies that businesses have high
financial autonomy. But it can also imply that businesses do not yet know
how to exploit financial leverage, it means enterprises do not know how to
raise capital in the form of borrowing. In contrast, this ratio is too high,
implying that enterprises do not have financial capacity but mainly borrow
to get business capital. This shows a higher level of corporate risk.
2. Debt – equity ratio
Debt – equity ratio =
Debt – equity ratio shows the proportion of total liabilities relative to the
proportion of total equity that is financing the company’s assets. Thus, this
ratio measures financial leverage. If the debt to equity ratio is greater than
1, then the company is financing more assets with debt than with equity. If
the ratio is less than 1, then the company is financing more assets with
equity than with debt. The higher the debt to equity ratio, the higher the
company’s financial risk. (Horngren, Harrison & Oliver, 2012, p. 738).
3. Interest coverage ratio
Interest coverage ratio =
Interest coverage ratio is a measure of the firm’s ability to meet its annual
interest payments. It measures the number of times EBIT can cover interest
expense. A high interest coverage ratio indicates ease in paying interest
expense; a low ratio suggests difficulty. (Horngren, Harrison & Oliver,
2012, p. 738).
Profitability ratios
Profitability ratios is a group of ratios that shows the combined effects of
liquidity, asset management and debt on operating results.
1. Net profit margin (ROS)
ROS =
The net profit margin measures net income per Vietnam dongs of revenue.
This ratio is positive, it means that the business is profitable. The higher the
ratio, the hìgher the profit. This ratio is negative, meaning that the business
enterprise is at a loss.
2. Return on assets (ROA)
ROA =
Return on assets measures a company’s success in using assets to earn a
profit (Horngren, Harrison & Oliver, 2012, p. 739). This ratio is greater
than 0, it means that the business is profitable. The higher the ratio, the
hìgher the profit. This ratio is samller than 0, meaning that the business
enterprise is at a loss.
3. Return on equity (ROE)
ROE =
The rate of return on common stockholders’ equity shows how much
income is earned for each one Vietnam dong invested by the common
shareholders. This ratio is positive, it means that the business is profitable.
This ratio is negative, meaning that the business enterprise is at a loss.
Market value ratios
Market value ratios are ratios that relate the firm’s stock price to its earning
and book value per share.
1. Earnings per share (EPS)
EPS =
Earnings per share is a measure of the net income earned on each share of
the company’s outstanding common stock (Weygandt, Kimmel & Kieso,
2014, p. 728).
2. Dividend per share (DPS)
DPS =
Dividend per share shows the dividends that investors receive when they
hold the company's shares.
3. Price/Earnings ratio (P/E)
P/E =
The price/earnings (P/E) ratio shows how much investors are willing to pay
per Vietnam dong of reported profits.
1.2.3.2. Using financial ratios to assess performance
Although financial ratios help us evaluate financial statements, it is often hard to
evaluate a company by just looking at the ratios.
Comparision to industry averages
Benchmarking
The company could compare itself with a subset of top competitors in their
industry. This is called benchmarking, and the companies used for the
comparison are called benchmark companies.
Trend analysis
The company could compare its ratios to its own past levels. Trend could give
clues as to whether a firm’s financial condition is likely to improve or to
deteriorate. To do trend analysis, simply plot a ratio over time.
1.2.3.3. Dupont equation analysis
ROE = profit margin x Total assets turnover x Equity multiplier
Dupont equation is a formula that show the rate of return on equity can be found as
the product of profit margin, total assets turnover and the equity multiplier. It show
the relationships among asset management, debt management and profitability
ratios (Brigham & Houston, 2019, p. 124).
The corporate financial situation is a holistic one. So there is a close relationship
between financial ratios. Use the Dupont equation to see the factors affecting return
on equity. The above analysis shows that the return on equity of a business can be
increased in 3 ways:
Businesses can increase their competitiveness to increase revenue and at the
same time reduce costs. This increases the net profit margin.
Businesses can improve their business efficiency by generating more revenue
from existing assets, through increasing the scale of net sales and using total
assets economically and reasonably.
Enterprises can improve business efficiency by improving financial leverage
or in other words, borrowing more capital to invest in production and business.
However, the return on assets of the enterprise is higher than the lending
interest rate so that borrowing cash for investment would be effective.
When applying Dupont equation to ROE analysis, analysts will compare
enterprise’s ROE with previous years. And then, they will consider the growth or
decline of this ratio over the years from which of the three causes. From there,
analysts will make comments and predict the trend of ROE in the following years.
Dupont diagram
1.3. SWOT analysis
SWOT analysis is an overall evaluation of the company’s Strength (S), Weaknesses
(W), Opportunities (O) and Threats (T) (Philip Kotler & Gary Armstrong, 2014, p.
77).
The SWOT analysis model is a useful tool for capture and decision making, which
includes financial decisions in any situation with any enterprise. The data is
organized in SWOT format in a logical order that is easy to understand, easy to
present, easy to discuss and make decisions, which can be used in any process of
decision making. The SWOT analysis sample is presented as a 2 – column, 2 – row
matrix, which is divided into 4 parts: Strengths, Weaknesses, Opportunities and
Threats.
Strengths include internal capabilities, resources and positive situational
factors that may help the company serve its customer and achieve its objects.
Weaknesses include internal limitations and negative situational factors that
may interfere with the company’s performance.
Opportunities are favorable factors or trends in the external environment that
the company may be able to exploit to its advantages.
Threats are unfavorable external factors or trends that may represent
challenges to performance.
The SWOT analysis model is suitable for assessing the current state of the
enterprise through analyzing the internal situation (Strengths and Weaknesses) and
external situation (Opportunities and Threats).
Internal factors to be analyzed may be: corporate culture, corporate image,
organizational structure, key personnel, ability to use resources, available
experience, operational efficiency, brand reputation, market share, financial
sources, copyright and trade secret.
External factors to be analyzed may be: customers, competitors, market trend,
suppliers, partners, social changes, new technology, economic environment,
political and legal environment.
The goal of SWOT analysis is to match the company’s strengths to attractive
opportunities in the environment, while eliminating or overcoming the weaknesses
and minimizing the threats (Philip Kotler & Gary Armstrong, 2014, p. 78)
1.4. Discount rate
There are two common ways to determine discount rates, including: Capital Assets
Pricing Model (CAMP) is used to determine the cost of equity and Weighted
Average Cost of Capital (WACC) is used to determine the enterprise’s cost of
capital.
1.4.1. Capital Assets Pricing Model
Cost of equity is extremely important, because just the difference from 1% - 2%
also makes the firm value change significantly. The most common way to identify
is to apply Capital Assets Pricing Models (CAMP). CAMP is a model based on
the proposition that any stock’s required rate of return is equal to the risk free rate
of return plus a risk premium that reflects only the risk remaining after
diversification (Brigham & Houston, 2019, p. 283).
=
+βx(
–
)
Where:
is the cost of equity
is the risk – free rate
β is systematic risk of equity
is the market return
–
is the market risk premium
- Risk free rate is the interest rate at which the risk of assets is close to 0 (No credit
risk and absolutely not affected by economic fluctuations). Normally, the interest
rate of government bonds is chosen as the risk-free rate, especially the interest rate
of Treasury bills. Becasue when investing in these securities investors will surely
get back the amount of money they bought securitites and the amount of interest
that has been determined.
- Beta is a measure of the volatility of a stock compared to the general market.
- Market risk premium is the difference between the expected rate of return from the
market portfolio and the risk-free rate. This is the rate of return that the investor
hopes to get beyond the risk-free rate, to compensate for the higher risk that
investors have to bear when investing in the stock market.
1.4.1.1. Beta coefficient
β=
Where:
Covar ( ,
) is the covariance between the return on Asset i and the return
on the market portfolio.
Var (
Meaning:
) is the variance of the market.
Systematic risk coefficient estimate the degree of stock price volatility compared to
the volatility of the entire market. β = 1 indicates that the company's stock price
moves in the same direction as the entire market, risk is equal to market average. β
> 1: Stock prices are more volatile than the market, the risk is higher than the
market average. β < 1: stock prices are less volatile than the market, the risk is
lower than the market average. It is rare for a company to have a negative β
coefficient. If that happens, the stock price of the company tends to move in the
opposite direction with the market.
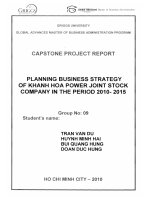
1.4.1.2. The Security Market Line
This expected return – beta relationship is the most familiar expression of the
CAPM. The expected return – beta relationship can be portrayed graphically as the
security market line (SML).
Figure 1.1: SML – Stock Market Line and a negative – alpha stock
The security market line is considered a standard criterion for evaluating each
investment option. Given the risk of an investment (as measured by its beta), the
SML tell us how much the required rate of return on the investment plan must be to
compensate for the risk that investors have to bear.
From the meaning of the security market line, fairly – priced assets plot exactly on
the SML. Points above or below the SML are all indicative of a price situation that
does not reflect the equilibrium value in the market. If the point is above the SML,
that security is undervalued. In this case, you should buy that stock. In contrast, for
points below the SML, it is not recommended to buy such securities because their
prices are higher than their real values.
The difference between the fair and actually expected rates of return on a stock is
called the stock’s alpha, denoted by α.
α = E(r) – {
+βx[
–
]}
α > 0: Buy securities
α < 0: Sell securitites
1.4.2. Weighted Average Cost of Capital (WACC)
Weighted Average Cost of Capital is a very important quantity to discount cash
flow to the present. The nature of cost of capital is the opportunity cost to use
capital sources, which is invested in the business operation of the enterprise. The
capital of the enterprise includes equity and debt. Each type of capital has different
usage costs.
Formula for WACC:
WACC =
x
x
x (1 -
)
Where:
D is the value of debt,
E is the value of equity,
is the cost of debt (pre – tax)
is the cost of equity
V = E + D: Total debt and equity
D/V, E/V is called the capital structure, corresponding to the ratio of debt and
ratio of equity over the total capital of the enterprise
The weighted average cost of capital is used to discount the cash flow of the
enterprise, not to discount the cash flow of equity.
1.5. Stock valuation methods
1.5.1. Dividend Discount Model (DDM)
The Dividend Discount Model is built on the view that stock prices are determined
by the present value of all future dividends. Suppose a stock is held until the year n,
dividends paid from the first year to year n are
respectively. Knowing
and the investors’ required rate of return is r
that the stock price in year n is
(constant). The formula for calculating the stock value using DDM method is as
follows:
Where:
: Current stock price
: Dividend in year t
r: required rate of return/ cost of equity
If the stock is held indefinitely by the investor, the formula becomes:
1.5.1.1. The zero – growth DDM
In the case: the company does not grow, the annual dividend will be fixed, it means
that
=
=…=
=
. Then, the stock price is calculated by the formula:
1.5.1.2. The constant – growth DDM
When dividends grow steadily, it means that dividends grow annually at a fixed rate
g.
=
=
,
=
=
Assume that r > g > 0, the stock price is calculated as follows:
The above formula is only true when r > g. This is perfectly reasonable because g is
growth rate in the long run, while r is the required rate of return in the short run and
is frequently changed.
1.5.1.3. Multistage dividends growth
In reality, no company has had a constant growth rate during its life. In their life
cycle, each company will have different growth stages. Therefore, this is the most
realistic case. It is common for dividends to grow unevenly for a number of years,
before entering the stable period.
To determine the stock price, first, we must divide the development process of the
company into different stages of development, mainly two stages. The first stage is
the period of unstable growth. During this period, investors need to base on earnings
estimates and dividend policy to determine annual dividends. The second stage is
the long – term development period and assume that it is a period of constant
growth.
To calculate the stock price, we combine the formula of the two cases above:
Suppose in the first year, the dividend value is estimated to be
the year (n + 1) onwards, dividend growth rate is g (constant).
The stock price is calculated as follows:
1.5.2. Discounted Cash Flow Model (DCF)
,
,…
From
Free Cash Flow (FCF) is the amount of cash that could be withdrawn without
harming a firm’s ability to operate and to produce future cash flows (Brigham &
Houston, 2019, p. 81).
The stock value of the DCF model is calculated by discounting all future free cash
flows to the present value at an appropriate discount rate. Therefore, when the free
cash flow was determined with an appropriate discount rate, the 2 method
calculating stock value of DCF model is as follows:
1.5.2.1. Free Cash Flow to Firm (FCFF)
Free cash flow to firm is the total cash flow of income for all stakeholders in the
enterprises (include: creditors and owners (shareholders)).
FCFF = EBIT x (1 –
) + Depreciation – Capex – Change in NWC
Where:
EBIT: Earnings before interest and taxes
The corporate tax rate
Capex: Capital expenditures
NWC: Net working capital
The firm value is calculated by the formula:
Case 1: The FCFF of enterprises grow steadily at a rate of g
Assume that: g < WACC, firm value will be calculated by:
PV=
Case 2: FCFF of enterprises grow unsteadily
Assume that: FCFF of enterprises has different growth rates between periods. Stage
1: from the first year to year t. Stage 2: from year (t + 1), growing steadily at a rate of g.