Tài liệu HPLC for Pharmaceutical Scientists 2007 (Part 8F) docx
Bạn đang xem bản rút gọn của tài liệu. Xem và tải ngay bản đầy đủ của tài liệu tại đây (405.78 KB, 26 trang )
8.6 EFFECT OF pH ON UV ABSORBANCE
The extent to which an organic molecule absorbs electromagnetic radiation in
the ultraviolet region (UV light) depends on the structure of the molecule.
Generally, molecules that contain one single double bond absorb weakly in
the UV region. However, if multiple double bonds are present in a molecule
and they are conjugated, the molecule absorbs more strongly and the
absorbance is shifted to longer wavelengths.
The pH of the mobile-phase effects the ionization of ionogenic solutes and
also the analyte UV response. The change in pH can change the electronic
structure of the molecule and result in changes in the molar absorptivity and
the absorption maximum of the molecule [25]. Ionization of aromatic com-
pounds containing a pyridinal nitrogen, amino, carboxylic acid, and phenolic
group can lead to significant changes of their UV response. Understanding the
effects of charge delocalization and conjugation on the UV response and
detection wavelength will allow the chromatographer to choose the proper pH
and wavelength of detection to obtain a method with higher sensitivity. Sil-
verstein et al. [26] and Shenk [27] provide a good overview for predicting how
the structure of a molecule and its environment will affect its molar absorp-
tivity and the wavelength of the absorption maximum.
Most applications of absorption spectroscopy to organic compounds are
based upon transitions for n or π electrons to the π* excited state. Energies
required for these processes bring absorption peaks into the spectral region
(200–700nm). π-electrons are further delocalized by conjugation. The effect of
this delocalization is to lower the energy level of the π* orbital and give it less
antibonding character and as a result absorption maxima are shifted to longer
wavelengths [28].
UV spectra of aromatic hydrocarbons are characterized by three sets of
bands (E1, E2, and B bands) that originate from π→π* transitions. Gener-
ally the E2 and B bands are of most interest to chromatographers, since the
solvent cutoff for most mobile phases is <200nm.
For example, benzene has strong absorption peaks at
E1: 184nm, ε
max
~ 60,000
E2: 204nm, ε
max
= 7,900
B: 256nm, ε
max
= 200
Table 8-9 shows E2 and B bands for some organic molecules. Auxochromes
are a functional group that does not itself absorb in the UV region but have
the effect of shifting chromophore peaks to longer wavelengths and increas-
ing their intensity. The —OH and —NH
2
groups have an auxochromic effect
on benzene chromophore. These substituents have at least one pair of n elec-
trons capable of interacting with π electrons of the ring. This stabilizes the π*
state and lowers its energy. The phenolate anion auxochromic effect is more
pronounced than for phenol because the anion has an additional pair of
EFFECT OF pH ON UV ABSORBANCE 429
unshared electrons. Aniline has a pair of n electrons capable of interacting
with the π electrons of ring. This stabilizes the π* state by the relationship
shown in Equation (8-3), thereby lowering its energy [28]. With a decrease in
protonation, the absorption maxima would be shifted to longer wavelengths
and increasing intensities and a red shift occurs. However, upon protonation
the nonbonding electrons are lost by formation of the anilinium cation, and
the auxochromic effect disappears as a consequence.
(8-3)
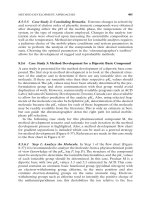
The change in the mobile-phase
s
s
pH at a constant organic composition may
have an effect on an ionizable analyte’s UV response (Figure 8-55A). Also, at
constant
w
w
pH as the organic concentration is increased, this may also lead to
a change in the analytes absorbance at a particular wavelength. Increasing
concentration of the organic shifts the pH of the mobile phase upward (for an
acidic modifier), and changes in UV absorbance may be observed (Figure
8-55B).
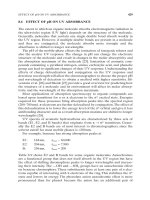
At 232nm there is a decrease in aniline’s absorbance as this analyte
becomes progressively more ionized. A plot of the UV absorbance at a par-
ticular wavelength versus the
w
w
pH of the aqueous phase will lead to a sig-
moidal dependence (Figure 8-56). The inflection point corresponds to the
analyte pK
a
(not corrected for pH shift of the mobile phase). When perform-
ing method development experiments a judicious choice for the wavelength
of the detection should be carefully considered because this can lead to
desired/undesired effects (change in sensitivity at particular wavelength as a
function of pH) on the resulting chromatography. Figure 8-57 demonstrates
that a greater response for aniline is observed at
w
w
pHs where the analyte is in
Ehv
hc
==
l
430 METHOD DEVELOPMENT
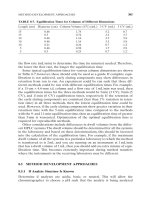
TABLE 8-9. Molar Absorptivity Values for Neutral, Acid, and Basic Species
a
Molecular
E
2
Band B Band
Compound Formula λ
max
(nm) ε
max
λ
max
(nm) ε
max
Benzene C
6
H
6
204 7,900 256 200
Naphthalene C
10
H
8
286 9,300 312 289
Toluene C
6
H
5
CH
3
207 7,000 261 300
Chlorobenzene C
6
H
5
Cl 210 7,600 265 240
Phenol C
6
H
5
OH 211 6,200 270 1,450
Phenolate ion C
6
H
5
O
−
235 9,400 287 2,600
Thiophenol C
6
H
5
SH 236 10,000 269 700
Aniline C
6
H
5
NH
2
230 8,600 280 1,430
Anilinium ion C
6
H
5
NH
3
+
203 7,500 254 160
a
Values from reference 28.
EFFECT OF pH ON UV ABSORBANCE 431
Figure 8-55. Effect of pH on UV absorbance for aniline (obtained from diode array).
(A) 10 v/v% acetonitrile and pH of 15 mM K
2
HPO
4
·7H
2
O adjusted to
w
w
pH 1–9 with
H
3
PO
4
. (B)
w
w
pH2.0 and acetonitrile concentration changed from 10 to 50 v/v%.
Figure 8-56. Absorbance at 232 nm versus the
w
w
pH of the aqueous phase. Mobile phase
contains 10 v/v% acetonitrile.
its neutral state.As the analyte ionization state varies with pH so does the con-
jugation. In some cases, the wavelength in a specific region does not vary with
the pH and the sensitivity of the analysis will not change as a function of pH
as seen for 2,4-dihydroxybenzoic acid, at 280 nm in Figure 8-58.
8.7 ANALYTE pK
a
—FROM AN ANALYTICAL
CHEMIST’S PERSPECTIVE
In order to avoid any secondary equilibrium effects on the retention of iono-
genic analytes, it is preferable to use a mobile-phase pH either two units
greater or less than the analyte pK
a
. Therefore knowledge of the analyte pK
a
is very important. A basic understanding of how functional group substitution
on a molecule affects the pK
a
of the ionizable group on the substrate is given.
An exhaustive description of all the nuances of analyte substitution on analyte
pK
a
is not included in this section. However, further details can be found in
the references 29–31.
8.7.1 Aromatic Acids
Effect of Analyte Substitution on Analyte pK
a
. The acidity of substituted
phenols or carboxylic acids depend upon the substituent attached to the cor-
432 METHOD DEVELOPMENT
Figure 8-57. Effect of pH on UV absorbance for aniline. Conditions: Column:
15-cm × 0.46-cm Luna C18(2). Eluent: 90% aqueous:10% MeCN. Aqueous: 15 mM
K
2
HPO
4
·7H
2
O adjusted to
w
w
pH 1.5–9 with H
3
PO
4
, Flow rate, 1 mL/min; temperature,
25°C; detection, PDA.
responding substrate, phenol, or carboxylic acid Aromatic acids with an
electron-withdrawing substituent are more acidic because these substituents
stabilize the ion by delocalizing the negative charge. Aromatic acids with elec-
tron-donating groups are less acidic because the substituents destabilize the
ion by localizing the charge.
8.7.1.1 Electron-Withdrawing Effects—Aromatic Acids. Electron-withdrawing
groups in the nucleus of the substrate increases the acidity. Inductive effect
usually falls off with distance: ortho (o) > meta (m) > para (p). However,
electron-withdrawing mesomeric effects also play a role when the electron-
withdrawing substituent is in the o- or p-position (see Figure 8-59). This
promotes ionization by stabilization (through delocalization) of resultant
anion.
8.7.1.2 Electron-Donating Groups—Aromatic Acids. The effect of elec-
tron-donating groups such as alkyl groups attached to the benzene nucleus
are small. These substituents destablize the phenoxide anion and disturb the
interaction of the negative charge with delocalized p orbitals of the aromatic
nucleus, shown in the following table.
ANALYTE pK
a
—FROM AN ANALYTICAL CHEMIST’S PERSPECTIVE 433
Figure 8-58. Effect of pH on UV absorbance for 2,4-dihydroxybenzoic acid. Condi-
tions: Column: 15-cm × 0.46-cm Luna C18(2). Eluent: 90% aqueous:10% MeCN.
Aqueous: 15 mM K
2
HPO
4
·7H
2
O adjusted to
w
w
pH 1–7 with H
3
PO
4
. Flow rate, 1 mL/min;
temperature, 25°C; detection, PDA.
8.7.2 Amines
8.7.2.1 Arylamines. Arylamines like aliphatic amines are basic. A lone pair
of nonbonding electrons on nitrogen can bond to acids, yielding an arylam-
monium salt. Base strength of arylamines are lower than aliphatic amines. A
stronger base corresponds to a less acidic ammonium ion (higher pK
a
). A
weaker base corresponds to a more acidic ammonium ion (lower pK
a
).
8.7.2.2 Aromatic Amines—Electron-Donating Groups. Electron-donating
groups tend to disperse the positive charge of the anilinium ion, and this
stabilizes the ion relative to the amine. Electron-donating groups increase the
basicity. Electrons are being pushed toward nitrogen and makes the fourth
pair more available for sharing with acid. These activating substituents make
the aromatic ring electron-rich. Some examples are shown in Figure 8-60A.
Electron donors (–CH
3
, –NH
2
, –OCH
3
) increase the basicity of arylamines.
8.7.2.3 Aromatic Amines—Electron-Withdrawing Groups. Electron-withdrawing
groups tend to intensify the positive charge of the anilinium ion, and this desta-
bilizes the ion relative to the amine. This increase the reactivity of an aromatic
434 METHOD DEVELOPMENT
Figure 8-59. pK
a
values of aromatic acid (phenols) species with electron-withdrawing
groups.
Figure 8-60A. pK
a
values of aromatic amine species with electron-donating groups.
Compound pK
a
phenol 9.95
o-MePhenol 10.28
m-MePhenol 10.08
p-MePhenol 10.19
REVERSED-PHASE VERSUS NORMAL-PHASE SEPARATIONS 435
Figure 8-60B. pK
a
values of aromatic amine species with electron-withdrawing groups.
Figure 8-61. pK
a
values of secondary amine species of two pharmaceutical compounds.
ring toward electrophilic substitution. Electron-withdrawing groups decrease
the basicity and pull electrons away from nitrogen and make the fourth
pair less available for sharing with acid. These deactivating substituents
make the aromatic ring electron-poor. Some examples are shown in Figure
8-60B. Electron-withdrawing groups (–C1, –NO
2
, –CN) decrease arylamine
basicity.
8.7.2.4 Alkyl Amines and Amides. Nonaromatic secondary and tertiary
amines have pK
a
values greater than 8, as shown for two beta blockers in
Figure 8-61. Amides are nonbasic, poor nucleophiles and do not protonate in
aqueous acids. As with carboxylic acids, the resonance stabilization of the neg-
ative charge of the CH
3
CONH– rationalizes the higher acidity of the amide.
pK
a
values of amides are typically greater than 15.
8.8 REVERSED-PHASE VERSUS NORMAL-PHASE SEPARATIONS
Reversed-phase HPLC is the dominant method used for the majority of
pharmaceutical applications (>95%). Normal-phase chromatography may be
required for separations that are not compatible with reversed-phase mode.
Solutes that are labile (i.e., reacts with protic solvents) or exhibit poor solu-
bility in aqueous media are prime candidates for normal-phase chro-
matography. Normal phase is well-suited for the separation of isomers and
diastereomers, as well as for separating compounds with saturated and
unsaturated side chains. Generally, the greater is the amount of unsat-
uration the greater the retention due to increased polarizability of double
bond.
Diol phases are a good starting point for normal-phase application. Silica,
amino, and cyano are alternative phases. Silica tends to strongly retain solutes
that can interact with its highly active sites. Hexane or heptane modified with
a polar organic solvent is generally utilized as the mobile phase. The polar
organic solvent can be chosen based on it physicochemical properties (dipole,
hydrogen bond acceptor/donor). Generally, small changes of the polar organic
solvent can cause large changes in retention, and this should be investigated
during method development. Common solvents include ethanol, isopropanol,
tetrahydrofuran, ethyl acetate, and dichloromethane. The level of water in the
solvents needs to be controlled as well, since differences in retention may be
observed. Additives such as trifluoroacetic acid or triethylamine can be used
to reduce interactions with the highly active sites of silica, allowing for reduced
retention and improved peak shape. A further description of normal-phase
chromatography can be found in Chapter 5.
Normal-Phase Chromatography Example. Vitamin E, an antioxidant, is a
complex made up of tocopherols and tocotrienols (Figure 8-62), which are
sometimes used to stabilize formulations. Tocopherols are a series of related
benzopyranols with a C16 saturated side chain. Tocotrienols contain three
double bonds on the C16 side chain [32].
Could you predict the elution order of the alpha, beta, gamma, and delta
isomers in the normal-phase mode? Note that in the normal phase, the less
hydrophobic the compound and the more substituents that could potentially
hydrogen bond to the stationary phase, the greater the affinity for the sta-
tionary phase and the longer the retention. The order of elution for the alpha,
beta, gamma, and delta isomers for both the tocopherols and the tocotrienols
series is the same (Figure 8-63) [32]. The order of elution for beta and gamma
would be hard to predict because they have very similar hydrophobicity and
same number of potential hydrogen bonding moieties. Their differences in
elution order depend on the planarity of the molecule and its interaction with
the stationary phase. In normal-phase chromatography, the more unsaturated
molecules, tocotrienols, elute later compared to the tocopherols, which have a
saturated side chain, and this could be attributed to the increased polarizabil-
ity of the double bond [33]. Comparing the separation to reversed mode, the
elution order is reversed, where the retention is as follows: delta tocopherol <
gamma tocopherol < beta tocopherol < alpha tocopherol < alpha tocopheryl
acetate (Figure 8-64).
436 METHOD DEVELOPMENT
REVERSED-PHASE VERSUS NORMAL-PHASE SEPARATIONS 437
Figure 8-62. Structures of substituted tocopherol and tocotrienols.
Figure 8-63. HPLC conditions: Genesis silica column (250 × 4.6 mm, 4 µm). Flow rate,
1.5 mL/min. Mobile phase: Hexane-1,4-dioxane (96 : 4). Fluorimetric detection: Fluor
LC 304 (excitation @ 294 nm and emission @ 326 nm). (Reprinted from reference 32,
with permission.)
8.9 INSTRUMENT/SYSTEM CONSIDERATIONS
The four common causes for high-performance liquid chromatography
(HPLC) column failure include column clogging at the inlet frit (from
samples/mobile phase), voids generated in the column, strongly adsorbed
impurities from solvent/sample, and chemical attack of the stationary phase
from the mobile phase or analytes. Procedure for removal of strongly adsorbed
impurities from sample/mobile phase was discussed in Chapter 3, Section 3.9.2.
8.9.1 Column/System Backpressure
Column backpressure gives a good indication of how the column and/or
system are operating. The initial backpressure of the column should be
438 METHOD DEVELOPMENT
Figure 8-64. Separation of synthetic tocopherols by reversed-phase HPLC (280 nm).
(1) δ-tocopherol, (2) γ-tocopherol, (3) β-tocopherol, (4) α-tocopherol, (5) α-tocopheryl
acetate. (Reprinted from reference 33, with permission.)