Tài liệu HPLC for Pharmaceutical Scientists 2007 (Part 5) pdf
Bạn đang xem bản rút gọn của tài liệu. Xem và tải ngay bản đầy đủ của tài liệu tại đây (428.9 KB, 21 trang )
5
NORMAL-PHASE HPLC
Yong Liu and Anant Vailaya
5.1 INTRODUCTION
High-performance liquid chromatography (HPLC) is a separation tool par
excellence for the analysis of compounds of wide polarity. Since its inception
approximately four decades ago, HPLC has revolutionized numerous disci-
plines of science and technology. Among the various modes of HPLC,
reversed-phase and normal-phase chromatography (NPC) are employed most
commonly in separation. Normal-phase chromatography was the first liquid
chromatography mode, discovered by M. S. Tswett in 1903, and it is well estab-
lished as evidenced by a plethora of books and articles that have been pub-
lished in recent years. In this chapter we describe a simplified overview of the
theory and practice of normal-phase chromatography.
5.2 THEORY OF RETENTION IN
NORMAL-PHASE CHROMATOGRAPHY
Unlike the more popular reversed-phase chromatographic mode, normal-
phase chromatography employs polar stationary phases, and retention is mod-
ulated mainly with nonpolar eluents. The stationary phase is either (a) an
inorganic adsorbent like silica or alumina or (b) a polar bonded phase con-
taining cyano, diol, or amino functional groups on a silica support. The mobile
phase is usually a nonaqueous mixture of organic solvents. As the polarity of
the mobile phase decreases, retention in normal-phase chromatography
241
HPLC for Pharmaceutical Scientists, Edited by Yuri Kazakevich and Rosario LoBrutto
Copyright © 2007 by John Wiley & Sons, Inc.
increases. Figure 5-1 illustrates the mechanism of retention in NPC [1]. Reten-
tion is governed by the extent to which the analyte molecules displace the
adsorbed solvent molecules on the surface of the stationary phase. This reten-
tion model based on adsorption was first proposed by Snyder [2–5] to describe
retention on silica and alumina adsorbents and later extended to explain reten-
tion on polar bonded phases, such as diol-, cyano-, and amino-bonded silica.
Snyder assumed a homogeneous surface so that adsorption energies for solute
and solvent molecules are constant. The stoichiometry of solute–solvent com-
petition can be given by
(5-1)
m and a refer to solute (S) and solvent (E) molecules in the mobile and
adsorbed phases, respectively. n is the coefficient that takes into account dif-
ferent adsorption cross sections for solute and solvents; that is, adsorption of
a solute molecule displaces n solvent molecules in the adsorbed monolayer.
For a binary mobile-phase system consisting of a weak nonpolar solvent and
a strong polar solvent, adsorption of the weak solvent can be ignored. There-
fore, solute retention can be expressed by
(5-2)
ln lnkk
A
A
N
S
E
E21
()
=
()
−
()
ln
SnE SnE
maam
+↔+
242 NORMAL-PHASE HPLC
Figure 5-1. Hypothetical representation of the adsorption mechanism of retention in
normal-phase chromatography. S denotes sample molecule, E denotes molecule of
strong polar solvent, and X and Y are polar functional groups of the stationary phase.
Prior to retention, the surface of stationary phase is covered with a monolayer of
solvent molecules E. Retention in normal-phase chromatography is driven by the
adsorption of S molecules upon the displacement of E molecules. The solvent mole-
cules that cover the surface of the adsorbent may or may not interact with the adsorp-
tion sites, depending on the properties of the solvent. (Reprinted from reference 1, with
permission.)
Here, A
S
is the solute cross-sectional area, A
E
is the molecular area of the
strong solvent, N
E
is the mole fraction of the strong solvent in the mobile
phase, k
2
is retention factor of the solute in the binary mobile-phase mixture,
and k
1
is the retention factor in the strong solvent alone.
Yet another adsorption-based retention model similar to that of Snyder was
proposed by Soczewinski [6] to describe the retention in NPC. It assumes that
retention in NPC is the product of competitive adsorption between solute and
solvent molecules for active sites on the stationary phase surface. The sta-
tionary-phase surface consists of a layer of solute and/or solvent molecules,
but, unlike the former, the latter model assumes an energetically heteroge-
neous surface where adsorption occurs entirely at the high-energy active sites,
leading to discrete, one-to-one complexes of the form
(5-3)
A* is an active surface site and q refers to the number of substituents on
a solute molecule that are capable of simultaneously interacting with the
active site. This equation takes into account the possibility of an analyte mol-
ecule’s interaction with multiple sites. Based on this model, the solute reten-
tion factor can be expressed by the following equation, which is similar to
Snyder’s:
(5-4)
where d is a constant. Comparison of the two models reveals that both predict
a linear log k
2
versus log N
E
plot. Snyder’s model predicts that the slope of
this line should be the ratio of the molecular areas of solute and solvent,
whereas Soczewinski’s model predicts that the slope is the number of strongly
adsorbing substituent groups (number of adsorption sites on the analyte) on
the solute.
In practice, it was found that equations (5-1) and (5-2) are most reliable for
less polar solvents and solute molecules on alumina or silica stationary phases
only. Neither of the models is entirely satisfactory in the forms presented, par-
ticularly for predicting retention behavior on bonded stationary phases.These
phases contain strongly adsorbing active sites as assumed in Soczewinski’s
model, but the solute molecular area and not just polar substituents are known
to play an important role in competitive adsorption as assumed by Snyder.
Furthermore, secondary solvent effects resulting from solute–solvent interac-
tions in both the mobile and adsorbed phases are not taken into considera-
tion in either model.These effects, such as hydrogen bonding, give rise to some
of the most useful changes in retention and often are an important source of
chromatographic selectivity [7, 8].
Another experimental deviation from equations (5-1) or (5-2) was deter-
mined to be due to the localization of solvent molecules onto the adsorption
sites of stationary phase resulting from silanophilic interactions. When the
log logkdq N
E2
=−
SqEA SAqE
ma m
+↔+--**
THEORY OF RETENTION IN NORMAL-PHASE CHROMATOGRAPHY 243
polar substitution groups of a solvent molecule interact strongly with the polar
groups on the surface of the column packing, they become attached or local-
ized onto the stationary-phase surface. An important consequence of solvent
localization is the apparent change in the solvent strength value of a polar
solvent. (Solvent strength is presented by e
0
, which is determined empirically
by using polyaromatic hydrocarbons that do not localize but lie flat on a
surface. Solvent with larger value of e has stronger elution power [1].) Con-
sequently, the solvent strength does not vary linearly with the concentration
of the stronger solvent for a binary mixture where one solvent is stronger than
the other [7].There is competition between the two solvents for the active sites
of the adsorbent and the stronger solvent will preferentially adsorb, resulting
in a more concentrated adsorbed layer of the stronger solvent. For instance,
the dependence of solvent strength for several binary mixtures on alumina as
adsorbent shows a large increase in solvent strength due to a small increase
in the concentration of a polar solvent at low concentrations. But at the other
extreme, a relatively large change in the concentration of the polar solvent
affects the solvent strength of the mobile phase to a lesser extent. In the case
of low concentration of polar solvent before the localization on the surface of
stationary phase reaches saturation, a small change of the polar solvent con-
centration can greatly affect the number of polar active sites on the column
packing. As a consequence, significant variations of analytes retention are
observed. Once the polar active sites of the stationary phase are localized com-
pletely, change of polar solvent concentration will have a smaller impact on
analyte retention.
These deficiencies were addressed by revising Snyder’s model as follows
[8]. To account for the preferential adsorption of solute and solvent onto the
strong sites, empirical A
S
and N
E
values larger than those calculated from mol-
ecular dimensions are used based on experimental observation. The revised
model acknowledges the tendency of polar molecules to localize on the
strongly adsorbing active site and expresses solute retention in terms of the
solvent strength as follows:
(5-5)
where a′ is an adsorbent activity factor, e
0
1
and e
0
2
are solvent strengths for
solvent 1 and 2, and A
S
is the analyte cross-sectional area on the adsorbent
surface. The “analyte” cross-sectional area can be predicted from molecular
dimensions. Secondary solute–solvent interactions are incorporated into the
revised model by adding extra terms denoted by ∆ for each of the solvents as
follows:
(5-6)
When a nonlocalizing, nonpolar solvent such as hexane is employed as a weak
solvent, the equation can be further simplified so that
log logkkaA
S21
1
0
2
0
21
=−
′
−
()
+−
()
εε ∆∆
log logkkaA
S21 1
0
2
0
=−
′
−
()
εε
244 NORMAL-PHASE HPLC
(5-7)
assuming hexane does not induce any secondary solvent effects and its solvent
strength is zero. Here k
h
is the analyte retention factor in pure hexane. Equa-
tion (5-7) has been found useful to understand the fundamental principles
governing the retention behavior as far as solute, solvent, and bonded-phase
properties are concerned. For instance, by fitting equation (5-7) to the exper-
imental NPC data, the extent of solute localization can be determined by com-
paring the slopes of a log k
2
versus e
0
2
plot, provided that the molecular cross
section can be estimated accurately.
5.3 EFFECT OF MOBILE PHASE ON RETENTION
Selection of suitable mobile-phase system is critical in NPC to achieve the
desired separation [4]. In general, a suitable solvent should have the follow-
ing properties: low viscosity, compatibility with detection system (for instance,
solvent should be transparent at wavelength of detection if UV is used as
detector), available in pure state, low flammability and toxicity, highly inert,
and adequate solubility for solutes. Unlike RPLC, analytes become less
retained as solvent strength (solvent polarity) increases. Solvent strength in
NPC can be represented by e
0
, and values of e
0
for some commonly used NPC
solvents are listed in Table 5-1 for silica as column packing [1]. Relative solvent
strength for other NPC column packings such as alumina and polar bonded
phases follow the same trend as in the table; that is, larger values of e
0
are
obtained for more polar solvents. Ideally, the mobile-phase strength should be
chosen to maintain analyte retention factor within the optimum range of 1 ≤
k′≤5 with selectivity values sufficient to reach a satisfactory resolution.
In general, binary mobile phases, such as a mixture of a nonselective solvent
hexane with a polar solvent, are used for NPC separations.If separation cannot
be achieved by adjusting mobile phase strength (change the concentration of
one of the components in a binary mixture), then variation of polar solvent
nature has to be pursued. Snyder has developed a useful scheme to classify
solvents (nonelectrolytic solvents) nature based on their interactions with
solutes and the stationary phase [9].This approach should not be taken as con-
crete rules but rather as a phenomological approach.The property of a solvent
is characterized by the three most important parameters, which are its proton-
acceptor (Xe), proton-donor (Xd), and dipole-donor (Xn) affinity. Each of
these contributes to the overall polarity of the solvent, which in turn is related
to its chromatographic strength. Rohrschneider determined the values of these
parameters from distribution coefficients of test solutes such as ethanol,
dioxane, and nitrobenzene [10].A medium polar solvent—such as chloroform,
which has a polarity of 4.31—involves 31% proton acceptor, 35% proton
donor, and 34% dipole interactions. If the parameter values of the solvents are
plotted on a triple coordinate system, various solvents can be grouped into
log logkkaA
hS22
0
2
=−
′
+ε∆
EFFECT OF MOBILE PHASE ON RETENTION 245
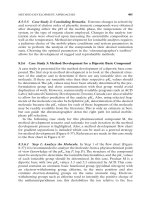
eight classes (Figure 5-2) [9]. Solvents within each class should show similar
selectivity for a set of components, while the nature of solvents from different
classes are quite different and may impart differences in selectivity for the
same set of components. In NPC method development, replacing solvents
belonging to the same selectivity class cannot offer substantial variation in
chromatographic separation. Therefore, it is recommended to select solvents
that are placed close to the apices of the triangle for maximum selectivity.
Common solvents in group I are isopropyl ether and MTBE, group VII sol-
vents include dichloromethane and 1,2-dichloroethane, and chloroform and
fluoro-alcohols constitute group VIII solvents. Solvent mixtures having the
same elution strength but different selectivities are called isoelutropic mobile
phases.
Binary mixtures,however,have only limited abilities for controlling mobile-
phase selectivity. Therefore, ternary and even quaternary mobile phases that
contain two or more different polar solvents along with a nonpolar solvent are
often used to achieve the required selectivity. If the ratio of the concentration
of two polar solvents is constant but the sum of the their concentration is being
changed with respect to that of the nonpolar solvent, the effect on retention
is much the same as when the concentration of the single strong solvent
246 NORMAL-PHASE HPLC
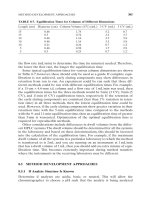
TABLE 5-1. NPC Solvent Strength (e
0
) and Selectivity
a
of Various Solvents
Employed in HPLC
Solvent ε
0
Localization Basic? UV
b
Hexane, heptane, octane 0.00 No c 201
1,1,2-Triflurotrichloroethane 0.02 No c 235
(Freon FC-113)
Chloroform 0.26 No c 247
1- or 2-Chloropropane 0.28 No c 225
Methylene chloride 0.30 No c 234
2-Propyl ether 0.32 Minor c 217
1,2-Dichloroethane 0.34 No c 234
Ethyl ether 0.38 Yes Yes 219
MTBE
d
0.48 Yes Yes 225
Ethyl acetate 0.48 Yes No 256
Dioxane 0.51 Yes Yes 215
Acetonitrile 0.52 Yes No 192
THF 0.53 Yes Yes 230
1- or 2-Propanol 0.60 Yes e 214
Methanol 0.70 Yes e 210
a
Silica used as absorbent.
b
Minimum UV wavelength; assumes that maximum baseline absorbance (100% B) is 0.5 AU.
c
Solvent basicity is irrelevant for nonlocalizing solvents.
d
Methyl t-butyl ether.
e
Different selectivity due to presence of proton donor group.
Source: Reprinted from Ref. 1, with permission.
changed in a binary mobile phases. On the other hand, if the sum of the two
polar solvents stays constant but the ratio is variable, larger effects on the
selectivity of separation are observed than in the system where the ratio is
constant. This is attributable to changes in dipole–dipole and proton–donor–
acceptor interactions between polar solvents and the analytes. Such selectiv-
ity tuning is the main purpose of using ternary mobile phases in NPC. A
phenomenological approach for the appropriate selection of ternary mobile
mixture based on Snyder’s solvent selectivity triangle concept combined with
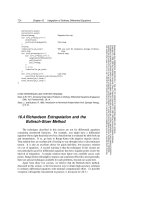
a statistical approach can be applied [11–15]. As can be seen in Figure 5-4, a
seven-run design is used. A primary binary solvent mixture such as hexane-
MTBE with the solvent strength that is convenient for the separation is first
selected. This binary mixture represents one corner of the selectivity triangle.
Two other binary mixtures, namely, hexane-dichloromethane and hexane-
chloroform, having the composition with the same solvent strength, are then
tested. As shown in Figure 5-3, the area bound by the sides of the triangle
formed by MTBE, dichloromethane, and chloroform defines the selectivity
domain in which the optimum mobile-phase composition will be found. Next,
separations are performed with three different ternary mobile-phase systems
produced by mixing an equal volume of each of the binary solvents. Thus, the
three experiments are set in the middle of triangle. Finally, the analysis is
carried out by mixing in the three binary mixtures in equal ratio. By compar-
ing the seven chromatograms obtained in the above experiment, optimum
EFFECT OF MOBILE PHASE ON RETENTION 247
Figure 5-2. Snyder’s selectivity triangle for solvents. (Reprinted from reference 9, with
permission.)
solvent composition for the separation can be easily identified. Figure 5-4
demonstrates the triangle reduction method whereby the same procedure is
repeated, starting from a smaller triangle—for instance, as defined by apices
2, 4, and 5, which corresponds to an area where the resolution is the highest—
until an optimum mobile-phase mixture is determined for adequate resolution
of the separated mixtures.Furthermore, optimum solvent composition can also
be obtained by regression analysis with data obtained from the seven runs
experiment [14].
Separation of acidic or basic analytes on NPC generally results in signifi-
cant peak tailing due to the strong hydrogen-bonding interactions with silanol
group on the stationary phase. Therefore, acidic or basic additive such as TFA
(trifluoroacetic acid) or DEA (diethylamine) are often included in the mobile-
phase system to minimize the hydrogen-bonding interactions.
5.4 SELECTIVITY
5.4.1 Effect of Analyte Structure
In NPC, analytes retentions generally increase in the following sequence:
alkane < alkenes < aromatic hydrocarbons ≈ chloroalkanes < sulfides < ethers
< ketones ≈ aldehyde ≈ esters < alcohols < amides << phenols, amines, and
carboxylic acids [16]. The retention also depends to some extent on the
248 NORMAL-PHASE HPLC
Figure 5-3. Selected solvents for mobile-phase optimization in NPC. (Reprinted from
reference 11, with permission.)