Tài liệu HPLC for Pharmaceutical Scientists 2007 (Part 16) ppt
Bạn đang xem bản rút gọn của tài liệu. Xem và tải ngay bản đầy đủ của tài liệu tại đây (412.89 KB, 28 trang )
16
THE ROLE OF HPLC IN
TECHNICAL
TRANSFER AND MANUFACTURING
Joseph Etse
16.1 INTRODUCTION
Analytical technology transfer and manufacturing is the mechanism by which
knowledge acquired about a process for making a pharmaceutical active ingre-
dient or dosage form during the clinical development phase is transferred
from research and development to commercial scale-up operation or shared
between internal groups or with third parties. Analytical technology transfer
guarantees that laboratories can routinely execute tests, obtain acceptable
results, and be able to accurately and independently judge the quality of com-
mercial batches. One of the most important analytical technology transfers is
high-performance liquid chromatography (HPLC) methods. The success or
failure of analytical technology transfers are judged on the merits of data gen-
erated using HPLC. Consequently, a major focus of regulatory authorities
[1–3] is on methods transfer as a critical link in the drug development con-
tinuum. Depending on the structure of the pharmaceutical organization,trans-
fer of analytical technology and manufacturing may occur at the end of the
phase II clinical studies or during the transition from phase II to phase III.
However, for a successful transfer of analytical technology to occur, the exis-
tence of HPLC methods that have been fully validated in accordance with the
ICH guidelines on validation will be required [4–7]. A full description of
method validation is provided in Chapter 9.
735
HPLC for Pharmaceutical Scientists, Edited by Yuri Kazakevich and Rosario LoBrutto
Copyright © 2007 by John Wiley & Sons, Inc.
16.2 PREREQUISITES FOR TRANSFER OF HPLC METHODS
16.2.1
Availability of Either Fully or Partially Validated Methods
A prerequisite for the transfer of analytical technology is the establishment of
fully validated methods in accordance with the International Council on Har-
monization (ICH) [4, 5],United States Pharmacopeia (USP) [6] and European
Pharmacopeia (EP) [7] guidelines for method validation, the existence of a
final synthetic process for the active pharmaceutical ingredients (APIs), and
final market image of the pharmaceutical dosage form. Method development
and validation usually parallels the API and pharmaceutical dosage form
development. It progresses from very rudimentary Tier 1 methods with limited
validation as shown in Table 16-1 through to Tier 2 methods and culminating
in Tier 3/registration-type methods [8–10].
Differences between methods from Tier 1 through Tier 3 are due to the
extent of validation of the analytical figures of merit that is performed [3].
During early development of the active pharmaceutical ingredient and early
dosage form development, emphasis is placed on speed and quantitation of
the API. At this stage, methods rely on the use of short columns, fast flows,
and very minimum validation to quickly identify the most desirable synthetic
route for the API that will produce an adequate impurity profile (overall yield
may not be optimized at this stage) and most desirable prototype formulations
and excipients that will ultimately lead to the selection of the final formula-
736 THE ROLE OF HPLC IN TECHNICAL TRANSFER AND MANUFACTURING
TABLE 16-1. Progressive Validation of Analytical Figures of Merit
Progressive Method Development
Discovery/
Phase I Phase II Phase III Phase IV
Analytical Figures of Merit Tier 1 Tier 2 Tier 3 Registration
1. Linearity √√√ √
2. Range √√√ √
3. Accuracy — √√ √
4. Specificity/stress studies — √√ √
5. Precision
•
Repeatability (injection) √√√ √
•
Intermediate precision (API) — √√ √
•
Intermediate precision (RS) — — √√
6. Robustness — — √√
7. Solution stability √√√ √
8. Limit of detection (LOD) — — √√
9. Limit of quantitation (LOQ) — √√ √
√,
Validated; —, not validated; R&D, discovery research, API, active pharmaceutical ingredient;
RS, related substance.
Source: Reprinted from Am. Pharm. Rev. Vol. 8(1), (2005), 76, with permission.
tion. Typically, Tier 1 and Tier 2 methods include validation of some, but not
all,
of the analytical figures of merit as shown in Table 16-1. Tier 1 methods
are the simplest methods in the sense that only linearity and precision may
have been validated. As the synthesis scheme for the API becomes optimized
with respect to improving the overall API yield and as the dosage form devel-
opment evolves from prototype formulations to the more robust final market
image formulations, the analytical methods employed also evolve and become
increasingly robust and optimized for the quantitation of the API as well as
degradation products and related substances. Once the final synthesis is set
and final formulations are selected, more robust and fully validated Tier 3
methods [3] are established to ensure the successful transfer of analytical tech-
nology from research and development to commercial operation. Supple-
mentary to this prerequisite is the identification of the commercial production
site or launch site where the pharmaceutical dosage form will be manufac-
tured. This is usually the stage in which all the drug development activities
come together in a New Drug Application (NDA) for regulatory approval
(Figures 16-1 and 16-2). Phase IV methods are usually slight variations of Tier
3 methods which include but are not limited to calculation formulas, the
number of sample preparations for API, and the number of dosage units.
PREREQUISITES FOR TRANSFER OF HPLC METHODS 737
Figure 16-1. Drug development and method transfer continuum for pharmaceutical
active ingredients (APIs).
16.2.2 Availability of the Finalized Pharmaceutical Active Ingredient
(API),
Known Degradation Products, By-products and Reference Standards
Besides the existence of validated HPLC methods, the availability of a final-
ized API synthetic scheme and optimized formulations is another prerequisite
for ensuring a successful transfer of analytical technology from research and
development to commercial operation (Figure 16-1). Evaluation of data gen-
erated from the HPLC analysis of the API provides the means by which deter-
mination is made about whether a validated API synthetic scheme exists and
if the API can be made reproducibly during commercial operation.
Confirmation of the existence of a validated API synthetic process is based
on the interpretation of acquired nuclear magnetic resonance (NMR) spec-
trum of the API in conjunction with definitive molecular formula for the API
and its components based on mass spectroscopy (MS). Concluding that a
reproducible API manufacturing process exists is based on whether purity
profiles of subsequent drug substance batches retain the same profile of the
API and its related substance peaks as was in the reference material. In that
sense, data generated using HPLC and hyphenated HPLC techniques such
as HPLC/MS, HPLC-MS/MS, and HPLC/NMR serve as the foundation for
declaring the existence of reproducible API manufacturing process [11–13].
738 THE ROLE OF HPLC IN TECHNICAL TRANSFER AND MANUFACTURING
Figure 16-2. Drug development and method transfer continuum for pharmaceutical
dosage forms.
16.2.3 Availability of Drug Products Made by the Definitive
Manufacturing Process
Once the
API has been selected for further development, a clear definition
and demonstration of the validated status of the manufacturing process for
the pharmaceutical dosage form is required in order to initiate transfer of ana-
lytical technology and manufacturing process. Development of the phar-
maceutical dosage form consists of a series of experimental activities that
ultimately result in the transformation of the API into a dosage form (i.e.,
tablet, capsule, suspension, injectable, patch, creams, inhalation product) suit-
able for human use [14]. This is achieved through the manufacture of batches
at the chosen commercial site for scale-up production (Figure 16-2). As the
formulation development process evolves into the final market image dosage
form, more robust HPLC methods as shown in Table 16-1 are established [3].
Assessment of whether or not the transfer of manufacturing process has been
successful is usually done by sampling and analyzing batches for blend uni-
formity [15, 16]. Sampling of the batches can be done in a number of ways.
Sampling by variables or the Bergum approach [17] are examples of sampling
techniques that can be used to measure the quality characteristics of the batch
on a continuous statistical scale. A simple method of measurement used to
judge the quality of the batch is the sample mean value (SMV) and its corre-
sponding percent relative standard deviation (%RSD). A sample mean value
that is close to the expected target value of 100% with a corresponding low
%RSD serves to prove the attainment of a homogeneous product that is
uniform and not variable in the content of the API. Assessment of product
quality using the Bergum approach relies on whether selected samples of a
batch has an SMV and %RSD that match the Bergum acceptance criteria.The
process is rejected if the SMV and %RSD lie outside the allowable Bergum
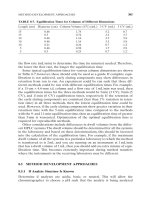
acceptance criteria [17–19]. An example of how the Bergum acceptance crite-
ria are applied for evaluating content uniformity data generated using HPLC
is shown in Figure 16-3. A sample with an SMV of 95% will pass the Bergum
criteria, provided that its corresponding %RSD is less than or equal to 3.5.
Similarly, a sample with a %RSD of 2.0 must have a corresponding SMV of
either 90% or 109% to pass the Bergum acceptance criteria.The general trend
as seen with Bergum acceptance criteria is that an increase in the magnitude
of the %RSD and its corresponding sample mean value (SMV) follow a bell-
shaped distribution in such way that %RSD decreases to zero as the SMV
becomes greater than or less than 100%.
16.2.4 Availability of Suitable Instruments and Personnel
A critical activity that precedes the start of analytical technology transfer is to
assess whether suitable instrumentation and qualified personnel are available
at the receiving laboratory.The receiving laboratory is the laboratory to which
the analytical methods are transferred to. This assessment is accomplished
through the organization of an analytical challenge meeting. The purpose of
PREREQUISITES FOR TRANSFER OF HPLC METHODS 739
this meeting is usually to open up channels of communication between the
participating laboratories to discuss the methods that are going to be trans-
ferred,
to share and exchange knowledge about the idiosyncrasies of the
methods, and to agree on the types of tests to perform and samples that will
be used for the cross-over testing. Because of the potential impact of sample-
to-sample variability on the agreement between data generated, participating
labs should agree to use identical batches and also decide on the number and
types of batches that should be tested [17–20]. Additionally, identification of
key contact persons and assignment of responsibilities are other items that can
be agreed upon during the analytical challenge meeting.
16.2.5 Availability of a Protocol Containing Predetermined
Acceptance Criteria
The methods transfer protocol is the main driver that governs the conduct of
the experiments and ensures that assessment of results generated is not unduly
influenced by biases due to either (a) the analytical method or (b) inherent
batch-to-batch variability of the active pharmaceutical ingredient or pharma-
ceutical dosage form. The methods transfer protocol establishes the predeter-
mined acceptance criteria by which results will be judged to have either passed
or failed the methods transfer.The criteria for assessment of success or failure
contained in the methods transfer protocol is achieved through an iterative
740 THE ROLE OF HPLC IN TECHNICAL TRANSFER AND MANUFACTURING
Figure 16-3. Bergum acceptance curve for evaluating content uniformity (CU) data.
Note:The curve shows that for a relative standard deviation (%RSD) of 4.5%, a sample
mean value (SMV) of 100% must be achieved for the manufacturing process to be
judged as validated.
process of exchange of ideas and comments between the originating lab and
the participating or receiving labs
.
Since the aim of the protocol is to ensure the mitigation of problems,
the essential elements of the protocol consists of sections that include (a) an
Introduction, (b) treatment and disposition of data,(c) types of methods being
transferred, (d) materials, reference standards, and reagents being used, (e)
recommended type of equipment, (f) sample handling, (g) predetermined
acceptance criteria, and (h) an Acknowledgment section. An example of a
typical table of contents (TOC) of an analytical methods transfer protocol is
discussed in Table 16-2.
PREREQUISITES FOR TRANSFER OF HPLC METHODS 741
TABLE 16-2. Table of Contents of an Example of Analytical Transfer Protocol
Section Description
1. Introduction
•
Aim and scope of the protocol
•
Brief description of dosage forms
•
Arguments for waivers, bracketing, and
matrixing (if applicable)
2. Treatment and disposition of data
•
Format for reporting data (i.e., number of
decimal places
•
Archival of data
•
Handling and resolution of OOS or OOT
results
3. Materials, standards, and reagents
•
Batches to be tested including batch-
specific data (storage conditions, shelf life,
etc.)
•
Reference substances (including storage
conditions and expiry dates)
•
Special handling instructions or
precautions (if applicable)
•
Reagents and source of supplier(s)
4. Test methods and specifications
•
Lists all applicable test methods and
specifications
•
List methods that will not be transferred
by cross-over testing
5. Acceptance criteria
•
Lists pass or fail requirements
•
Enumerates the release acceptance
requirements
•
Stipulates the number of required
replicate determinations
•
Establishes the statistical assessment
requirements
6. Method acknowledgment
•
Feedback from participating labs
•
Signature of acceptance/approval
(receiving and transfer laboratory)
OOS, out-of-specification results; OOT, out-of-trend results.
Source:
Adapted from Am. Pharm. Rev. 8(1) (2005), 76, with permission.
16.2.5.1 Introduction. T
he introduction section lays down the purpose of
the transfer and clearly identifies the originator lab where the method was
developed as the reference lab (also designated as center A or originator lab)
and identifies all the other labs participating in the transfer as participating or
receiving labs. A brief description of the pharmaceutical dosage forms being
transferred as well as any arguments for bracketing and matrixing of the
testing plan is included in this section. Because a minimum of three batches
of each dosage strength of a pharmaceutical dosage form is normally required
to be to tested during the transfer activities [17–19], any argument that serves
as justification for omitting the testing of certain dosage strengths through the
application of bracketing and matrixing strategies becomes an important con-
sideration that is addressed in this section.
Bracketing and matrix testing is the approach in which only the highest and
lowest dosage strengths are tested in the cross-over experiments and carry the
benefits of reducing the amount of testing required. When this approach is
applied to a pharmaceutical dosage form consisting of 50-, 75-, 100-, 125-, and
150-mg dosage strengths, cross-over testing is performed using only the 50-,
100-, and 150-mg dose strengths. In that sense, passing results generated for
the 50-, 100-,and 150-mg strengths automatically becomes surrogate and proof
of the transfer for the 75- and 125-mg dose strengths. Usually, arguments for
bracketing and matrixing are easier to justify if the analytical sample prepa-
ration steps for all dosage strengths are similar and if the dosage strengths are
made from similar or identical granulation and the excipient-to-drug content
ratio is dose and/or weight proportional.
16.2.5.2 Treatment and Disposition of Data. This section discusses treat-
ment and disposition of data and establishes the mechanism by which data will
be assessed as having passed or failed the predetermined acceptance criteria.
It is important that this section also address (a) the mechanism by which out-
of-specification (OOS) or out-of-trend (OOT) results will be handled and (b)
procedures for reporting and archiving of data. Stipulation of how assessment
of reported results and the archival and disposition of data will be handled
should also be discussed under this section. Clear rules governing how assess-
ment of data is handled takes on an ever-increasing significance because of
the intense scrutiny regulatory agencies apply when reviewing any docu-
mented report that claims equivalency based on data comparison between
different laboratories [20–22].
16.2.5.3 List of Materials, Standards, and Reagents. The impact that
batch-to-batch variability of a pharmaceutical dosage form can have on the
interpretation of results can be very challenging [17, 18]. The same challenges
are also present for the API because different vendors may be used for the
raw materials that may lead to different impurity profiles of the API. Hence,
the purpose of this section of the protocol is to describe in unequivocal terms
742 THE ROLE OF HPLC IN TECHNICAL TRANSFER AND MANUFACTURING
the analytical methods, test samples, standards, and reagents that should be
used.
An approach that greatly helps to alleviate potential differences that lead
to non-agreement of data between the participating and originator labs due
to the potential impact of batch-to-batch variability is to use either freshly
manufactured or well-characterized batches.This can be accomplished by pro-
viding all the participating labs with identical samples derived from previously
prepared composite samples or aliquots from the same batches of drug
product (DP) and drug substance (DS). The prepared composite samples for
the DP or DS are subdivided evenly into smaller lots that are distributed to
all participating laboratories. Because the ultimate goal of the technical trans-
fer is the transfer of analytical test methods and not the identification of inher-
ent batch-to-batch variability that may exist among batches, it is essential to
stipulate the lot number, date of manufacture and the required storage con-
dition of the batches selected. For example, a storage condition of “5°C” or
“Do not store above 30°C,” together with any special handling instructions,
and the appropriate “Re-test” or “Expiry date (i.e., 2 years, etc.),” should be
provided [23, 24].Additionally, it may also be necessary to stipulate and restrict
the number of vendors/suppliers of reagents and reference standards as a
means by which potential biases from such sources on the results generated
can be eliminated or minimized. For example, if in-house reference standards
are used, it may be necessary to quarantine that particular lot of reference
standard material to ensure that adequate supplies are available at all times
for the duration of the analytical methods transfer. Material Safety and Data
Sheet (MSDS) classification of the reagents, standards, and the API should be
provided to assure the types of adequate precaution that should be taken
to avoid unintended exposure of analysts to potentially dangerous materials
[23, 24].
16.2.5.4 Test Methods and Specifications. This section tabulates all the test
methods and specifications that are being transferred via an interlaboratory
cross-over testing plan. In addition, a discussion of the rationale for transfer-
ring the methods should be provided in this section. When transfer of related
substances methods is required, a number of steps should be considered to
ensure that data generated will be reasonable and meaningful for the purposes
of comparing data between the different laboratories.Transfer of related sub-
stances methods often presents a challenging situation because related sub-
stances tend to occur in low levels,especially in recently manufactured batches,
or may be present at levels that are close to the quantitation limits of the
method. To circumvent this, a very well-defined strategy can adopted by
the participating labs to mitigate difficulties associated with the transfer of
related substances. For example, clear instructions regarding whether a spike
experiment involving the use of pre-prepared samples containing a known
amount of the degradation product or the use of samples containing well-
characterized amount of the degradation product of interest can be stipulated.
Also, clear definition of the sample preparation in regard to sonication (power
PREREQUISITES FOR TRANSFER OF HPLC METHODS 743
output, water level in batch), shaking, filtration steps, and so on, must be
communicated [25–29].
Another aspect of this section of the protocol is to discuss the rationale for
not transferring certain methods
. In general, test methods such as microbial
limit tests (MLT) and other types of test methods based on universally
accepted pharmacopeia procedures are not typically subjected to interlabora-
tory cross-over testing. Instead, such methods are validated locally by demon-
strating suitability for their intended purpose. Similarly, test methods that rely
on the use of well-established techniques that are considered routine such
as “appearance by visual examination” and “uniformity of dosage units by
weights” are not normally subjected to interlaboratory cross-over testing.
However, if some of the more common tests such as “Appearance of Solution”
tests require special pharmacopeia procedures that are not routine, it may be
necessary to consider the inclusion of such methods in the interlaboratory
cross-over testing scheme.Any decision that is contemplated to either include
or exclude a test method or methods from conventional cross-over testing
should clearly be justified on the basis of sound scientific argument(s).
16.2.5.5 Acceptance Criteria. A most important section of the protocol is
the section that outlines all the acceptance criteria by which results generated
for each method being transferred will be judged as having fulfilled the
requirements of the transfer. Since the interpretation of acceptance criteria is
often based on the application of some type of statistical value, an important
aspect of this section is to include clear instructions regarding the number of
batches and the number of replicate determinations that has to be performed
[18, 19]. Table 16-3 shows examples of acceptance criteria that may be applied
744 THE ROLE OF HPLC IN TECHNICAL TRANSFER AND MANUFACTURING
TABLE 16-3. Example of Acceptance Criteria for Assay, Content Uniformity, and
Dissolution
Test Replicates (n) Acceptance Criteria
Assay 3
•
Mean difference ≤ 2.0%
[%RSD, n = 6) ≤3.0%]
Content uniformity (CU) 10
•
Results meet current USP <905>
and/or harmonized USP, JP, and EP
2.6.1 requirements.
•
If %RSD at either site is >4.0%, then
[STDev (Lab B)/STDev (Lab A)]
≤2.0%
•
For each site, SMV =±3% of the
mean assay within each site
Dissolution 12
•
Mean difference ≤7.5%
SMV, sample mean value; RSD, relative standard deviation; n,
number of replicates; USP, United
State Pharmacopeia; JP, Japanese Pharmacopeia; EP, European Pharmacopeia.
Source: Adapted from Am. Pharm. Rev. 8(1) (2005), 77, with permission.
for comparing assay, content uniformity, and dissolution data between par-
ticipating labs
.
For the purposes of comparing assay, content uniformity, and dissolution
data, simple statistics such as sample mean value (SMV) and relative standard
deviation (%RSD) derived from experience of performing the tests over long
periods of time can be used as acceptance criteria. Alternatively, more sophis-
ticated statistics such as the z-test, F-test or t-test as shown in Table 16-4 can
be applied [17–19, 25]. In the case of evaluating CU data, it can be concluded
that results from two labs are equivalent based on applying the simple statis-
tics of the difference between the SMV from Lab A and Lab B (Table 16-4)
not to be more than 2.0%. In the other examples where the more sophisti-
cated statistics such as z-test, F-test, or t-test are applied (Table 16-4), results
from two labs are considered to be equivalent because the calculated statis-
tics in each case (z-calculated values of 0.32/0.64, F-calculated value of 0.14,
or T-calculated values of 0.30/0.60) are less than the predicted statistics
(z-critical value of 1.64, F-critical values of 3.18, or T-critical value of 1.73)
[19, 25].
16.2.5.6 Method Acknowledgment. Since the goal of the transfer is to
achieve an efficient and an issue-free transfer, a meeting to discuss the HPLC
methods with the participating labs prior to the start of the transfer activities
is highly recommended. As previously discussed, the meeting provides oppor-
tunities for the participating labs (or receiving labs) to be made aware of any
special features or idiosyncrasies of the methods. Hence, the primary focus of
this section is to capture feedback and suggestions from discussions with the
participating labs prior to the start of the transfer activities. Sometimes based
on feedback from the discussions,methods can be further optimized to address
special concerns or to accommodate well-established procedural practices at
the receiving labs. For example, the test method for assay can be changed to
permit the use of 20 instead of 10 sample composite for assay in order to rec-
oncile practices in AR&D with quality control (QC). In other cases, a stipu-
lated column oven temperature of 30°C can be changed to 35°C,and the initial
isocratic hold time in a gradient method can also be modified in order to
accommodate differences in instrument capabilities (dwell volumes) between
QC and AR&D.Additionally, this section stipulates who needs to approve the
protocol from both the participating and originator labs.
16.3 TYPES OF TECHNICAL TRANSFER
16.3.1 From Analytical Research and Development (AR&D) to Quality
Control (QC) Lab of the Commercial Organization
Technical transfer from AR&D to QC constitutes the majority of technology
transfers that are performed. It is the process by which a laboratory is
TYPES OF TECHNICAL TRANSFER 745
746 THE R
OLE OF HPLC IN TECHNICAL TRANSFER AND MANUFACTURING
TABLE 16-4. Role of HPLC in the Comparison of CU
Data Between Two Labs
Test Sample # Lab A Lab B
1 99.4 99.0
2 99.8 99.6
3 100.0 101.0
4 101.0 100.0
5 97.9 98.8
6 99.9 99.3
7 99.5 99.6
8 100.0 99.9
9 101.2 100.0
10 102.0 101.2
Average 100.1 99.8
Standard deviation 1.1 0.8
Mean difference 0.30
z-Test: Two Sample for Means
Lab A Lab B
Minimum value 99.4 99.0
Mean 100.1 99.9
Known variance 1.27 0.6
Observations 9 9
Hypothesized mean difference 0
z 0.46
P(Z ≤ z) one-tail 0.32
z Critical one-tail 1.64
P(Z ≤ z) two-tail 0.64
z Critical two-tail 1.96
F-Test Two-Sample for Variances
Mean 100.1 99.8
Variance 1.27 0.60
Observations 10 10
df 9 9
F 2.11
P(F ≤ f ) one-tail 0.14
F Critical one-tail 3.18
t-Test: Two-Sample Assuming Equal Variances
Lab A Lab B
Mean 100.1 99.8
Variance 1.27 0.60
Observations 10 10
Pooled variance 0.94
Hypothesized mean difference 0
df 18
t Stat 0.53
P(T ≤ t) one-tail 0.30
t Critical one-tail 1.73
P(T ≤ t) two-tail 0.60
t Critical two-tail
2.10
qualified to utilize analytical methods for the routine release of products
to the marketplace [20].
This type of transfer guarantees that commercial
organization can routinely perform the tests and obtained acceptable results.
From that perspective, the timely transfer of methods from AR&D to QC is
regarded as providing a competitive advantage in accelerating the commer-
cialization of the drug products. Transfer from AR&D to QC guarantees the
proper training of QC chemists in the use of the analytical methodologies and
avoids unnecessary delays due to analytical issues in the timely release of
products to the marketplace [20]. For this type of transfer to occur, it is usually
the originator of the method (AR&D) who undertakes the full validation of
the methods and also initiates the transfer of the methods. Though timing
of the transfer generally occurs prior to the regulatory submission of a New
Drug Application (NDA), the transfer can also take place earlier in the drug
development continuum around the time of filing an Investigational New
Drug Application (IND). Transfer during the IND filing phase can occur if a
project is transferred from one development center to another.A distinguish-
ing feature of this type of transfer is that fully validated Tier 2 or Tier 3/
registration method (Table 16-1) must be available before the transfer can
begin. The assessment of success or failure of the transfer under this type of
transfer is usually based on extensive interlaboratory cross-over testing and
comparison of results against predetermined acceptance criteria [26, 29].
16.3.2 Transfer from AR&D to Another AR&D Organization
Transfer from one AR&D organization to another AR&D unit occurs when
projects are transferred mid-stream during the drug development continuum.
There may be a number of reasons that could lead to this type of transfer.
Notable among these are;
(a) Realignment of project portfolios due to significant reorganization of
a company.
(b) Merger/acquisition situation requiring the divestiture of projects to
avoid creation of monopolies.
(c) Change in a company’s therapeutic area of focus or interest leading
to either out-licensing or in-licensing of new development activities to
bolster pipeline depreciation issues.
Unlike transfer from AR&D to QC, methods available at this time may not
have been fully validated and may either be Tier 1 or Tier 2 methods (Table
16-1). Depending on the status of the project at the time of the transfer, the
receiving lab may have to redevelop and revalidate the methods. Transfer
under this mode can be prompted by legally mandated timeline, especially in
a merger situation, to ensure the timely and complete transfer of technology
to the receiving lab. Assessment of success or failure of transfer may not be
TYPES OF TECHNICAL TRANSFER 747
based on extensive interlaboratory cross-over testing
. Instead,the timely trans-
fer of all available relevant documentation and the comprehension of the doc-
umentation by the receiving laboratory may be sufficient proof of the
successful transfer of the analytical methods.
16.3.3 Transfer from AR&D to Contract Research Organization (CRO)
Transfer from AR&D to CRO is becoming an increasing means by which com-
panies faced with severe capacity constraints find external partners to off-load
some of their routine activities to free-up capacity from performing routine
activities such as testing of stability samples and manufacture of compara-
tor/positive control batches. Additionally, companies may engage in this type
of transfer when they place greater emphasis on the performance of only
certain activities such as early proof concept screening of compound and dis-
covery support activities. Transfer under this category can be similar to the
transfer from AR&D to QC or the transfer from one AR&D unit to another.
When transfer is similar to the transfer from AR&D to QC, the originator of
the method (AR&D) undertakes the full validation of the methods and initi-
ates the transfer.A facet of this transfer is that methods at this stage can span
the whole gamut from Tier 1 methods to the fully validated Tier 3 methods.
When Tier 2 methods are involved, the CRO undertakes the task of complet-
ing the validation of the method with either full or partial participation in the
validation efforts by the originator lab. Successful transfer in this case is based
on the CRO completing the validation exercises in accordance with criteria
defined in a protocol. With regard to transferring fully validated Tier 3-type
methods, assessment of success or the transfer is similar to the transfer from
AR&D to QC in the sense that success or failure of the transfer is predicated
on the generation of results from extensive interlaboratory cross-over testing
and the agreement of the results with a set of predetermined acceptance
criteria.
16.4 DIFFERENT APPROACHES FOR TECHNICAL TRANSFER
AND MANUFACTURING
16.4.1 Comparative Testing
Comparative testing is the most common approach employed for ensuring
the transfer of analytical methods. Because this approach usually requires the
availability of fully validated Tier 3/registration-type methods, a prerequisite
for this approach is that the originator lab and participating laboratories agree
to use the same fully validated methods and preselected and mutually agreed-
upon products sourced from identical batches of the material. Considerations
that are paramount to the success or failure of this approach are the precau-
tionary measures that must be taken to either eliminate or at least minimize
748 THE ROLE OF HPLC IN TECHNICAL TRANSFER AND MANUFACTURING
the potential impact of any inherent batch-to-batch variability on the results.
T
o achieve this goal, material used for the interlaboratory cross-over testing is
sourced from the same batch/lot of drug product or drug substance. One of
the most popular means employed to ensure the elimination of potential influ-
ence of batch-to-batch variability on data interpretation is that the originator
lab prepares a composite sample of the material to be tested. The composite
sample is split into equal portions that are then supplied to the participating
labs. Results generated by the participating labs are compared to the origina-
tor lab’s results as the reference or gold standard lab [18–20]. Assessment of
agreement of results is done by using a variety of statistical approaches [20,
25]. The simplest statistical approach that is often used is to compare results
based on predetermined relative standard deviation (%RSD) and difference
between sample mean value (SMV). Selection of the %RSD and SMV crite-
ria can be based on accumulated historical data generated from analyzing
several batches at the originator lab. Table 16-5 shows data generated for the
transfer of an HPLC assay method from Lab A (the originator lab) to Lab B
(the receiving lab). In this case, a predetermined acceptance criteria of differ-
ence between the SMV as ≤2.0% for assay was established prior to the start
of the transfer activities.In addition, a %RSD criteria of ≤2.0% was also estab-
lished. For the three dosage strengths (250mg, 500mg, and 750mg tablet)
tested in the interlaboratory cross-over testing, data generated by both labs
agreed with the predetermined SMV and %RSD acceptance criteria, and so
the transfer is judged to have been successful.
In other cases of determining whether a transfer has been successful
involves the use of sophisticated statistical means (Table 16-4) such as the
Student t-test, testing of equality of means from two groups (two sample
DIFFERENT APPROACHES FOR TECHNICAL TRANSFER 749
TABLE 16-5. Comparison of Assay Results for Three Replicates of Three Dosage
Strengths
Drug Product Batch: A B C
Dosage strength: 250mg 500mg 750mg
Participating labs: Lab A Lab B Lab A Lab B Lab A Lab B
First value: 101.1 99.5 101.4 101.2 101.3 99.6
Second value: 100.4 98.9 101.3 100.7 100.6 100.5
Third value: 99.8 98.5 101.1 101.1 100.9 100.2
Mean value: 100.5 99.0 101.3 101.0 100.9 100.2
RSD: 0.7 0.5 0.1 0.3 0.4 0.7
Mean difference: 1.5 0.3 0.7
Note: Lab A is the reference or originator lab.Acceptance criteria based on three replicate deter-
mination are as follows:
Sample mean value (SMV) = 95–105%; Difference between the SMV (i.e., mean difference) is
≤2%; RSD (n = 3) ≤2.0%. In this example, the transfer was successfully completed because all
predetermined acceptance criteria were met.
t-test),
one-way analysis of variance (ANOVA), z-test, F-test, and use of control
charts [17, 25]. As previously discussed in Table 16-4, the sample mean values
obtained at the originator and participating labs are considered to be equiva-
lent because the calculated P-value for each lab is less than the z-critical or t-
critical value. This situation is interpreted to mean that the transfer has been
successful. Under this type of transfer, participating labs are certified as qual-
ified to perform the tests only after the results they generate unequivocally
agree with predetermined acceptance criteria and with the originator lab’s
data. Comparative testing is the conventional approach often used for the
transfer of analytical methods from AR&D to either QC or contract research
organizations (CRO).
16.4.2 Co-validation of Methods
Unlike in the case of comparative testing, which requires the existence of fully
validated methods, there is no requirement for the existence of a validated
method for transfer based on co-validation. In other words, availability of a
fully validated method is not a prerequisite for this mode of transfer.This type
of transfer is usually employed for transferring methods from one AR&D
organization to another ARD organization or from an AR&D unit to a QC
lab. Because the receiving labs in this type of transfer participate in all aspects
of the final validation of the methods, completion of the validation is gener-
ally considered proof of the successful transfer of the methods. In that regard
the receiving labs become immediately certified to perform the test and do
not require any formal certification.Although this mode of transfer is not often
used, it is gaining in popularity because of the benefits it offers in terms of
reducing the amount of time required to complete a transfer exercise. The
other benefits of this transfer is that the use of pre-selected batches is not
required because validation experiments are shared between the labs.
However, for this approach to work well, prior agreement is reached on the
analytical figures of merit (i.e., linearity, accuracy, intermediate precision, etc.)
that each lab will have to include or exclude from the validation (see Chapter
9 for more details on method validation). In some cases, acceptance criteria
may be based on the originator’s Method validation SOP for demonstrating
accuracy, linearity, precision, repeatability, range, LOD and LOQ (Table 16-6).
In the example shown in Table 16-6, independent achievement of the accep-
tance criteria by the participating labs is considered sufficient proof for declar-
ing that the transfer has been successful.
16.4.3 Revalidation of Methods
Revalidation of methods is the approach by which methods are be transferred
based on a complete revalidation of already existing fully validated methods.
With this mode of transfer no prior agreement is required in deciding what
analytical figures of merit require revalidation. Because use of preselected
750 THE ROLE OF HPLC IN TECHNICAL TRANSFER AND MANUFACTURING
well-characterized batches is also not required, the decision to revalidate is
based solely on the requirements of prevailing SOPs at the receiving lab which
do not require any tacit approval by the originator lab
.
The other aspect of this mode of transfer is that it does not normally require
comparison of data generated at the receiving lab with data previously
reported by the originator lab. The receiving labs are certified to perform the
tests once they complete revalidation of the methods.
This mode of transfer is sometimes employed for transferring methods from
one AR&D organization to another AR&D organization or from an AR&D
unit to a QC lab or CRO. Though this type of transfer can be the simplest
mode of transferring methods, it may also be the most time-consuming
approach because all aspects of an already existing method will have to revali-
dated. On the contrary, if timing of the revalidation is coordinated in a manner
that coincides with the validation of the methods by the originator lab, con-
siderable time savings can be achieved because the receiving or participating
labs will not have to wait for the originator lab to complete validation of the
method before they start their own revalidation exercises. Both activities can
occur in parallel and not in the usual sequential fashion that tends to charac-
terize all the other modes of transfer. However, a potential drawback for not
waiting before embarking on revalidation is that any time saving that may
have been gained by the receiving lab would be erased when the originator
lab decides to change the method in course of their validation exercise because
of last-minute discovery of unexpected analytical issues. Under those circum-
stances, both labs may now have to divert resources to perform additional
experiments in order to resolve the unexpected analytical issue. Though not a
necessary requirement for this mode of transfer, it may still be prudent for the
DIFFERENT APPROACHES FOR TECHNICAL TRANSFER 751
TABLE 16-6. Validation of Analytical Figures of Merit; Example of Acceptance
Criteria
Analytical Figures of Merit Acceptance Criteria
Assay
Recovery (3 × 3 levels of concentration) 95–105%
%RSD ≤2.0%
Completeness of extraction ≤1%
Linearity (n ≥ 6)
Correlation coefficient (r) ≥0.999
Y-intercept ≤2.0%
Residual standard deviation ≤2.0%
Range 70–130% of label claim
Precision/repeatability n ≥ 6, %RSD ≤ 2.0%
Intermediate n ≥ 6, %RSD ≤ 2.0%
LOD S/N ≥ 3:1
LOQ S/N ≥ 10 :1 and
%RSD(n ≥ 5) = 10–20%
participating labs to show that by using their versions of the methods, com-
parable data with the originator is obtained for the assay of similar or identi-
cal batches of the same pharmaceutical dosage form.
The importance of
showing comparability is borne out by the fact that subtle differences in the
acceptance criterion applied for accuracy—for example, 95–105% versus
95.0–105.0% stipulated in the different local SOPs—could potentially con-
tribute to instances of nonagreement of results between the originator and
receiving labs. This fact is illustrated by the example of an assay criterion set
to 95.0%, in which case a value of 95.1% would fail this criterion but would
pass a criterion of 95% simply because values obtained must first be rounded
to the same number of decimal places as in the acceptance criteria before com-
parison against the acceptance criterion can be performed.
16.4.4 Waiver of Transfer
Waiver is the mode of transfer in which no interlaboratory cross-over testing
is performed. This is the least used mode of transfer, and it is evoked only
under certain special circumstances. An example of such a circumstance is
when the method to be transferred can universally be acknowledged and
accepted as relying on technologies that are considered standard and routine
analytical techniques that have been in use at the receiving lab for a consid-
erable period of time. Identification by visual examination and uniformity of
dosage unit by a weighing operation are two examples that merit considera-
tion for waiver transfer. Another circumstance under which a waiver may be
justified is when it can be proven that an earlier version of a method has rou-
tinely been used to test products at the receiving lab facility. A strong case for
waiver consideration is when it can be demonstrated that differences between
the earlier and newer version of the method are attributable mainly to minor
editorial revisions to the method and changes involving a switch from a shorter
to a longer column of the same column chemistry or a change in the sample
preparation procedure by changing the sequence of addition of extraction
solvent or an increase in shake or sonication time to account for a more robust
extraction of analytes.
A poignant argument that can be made for waiver of transfer is when per-
sonnel from the lab where the methods were originally developed and vali-
dated are transferred to a brand new lab in a completely different facility. In
this case the granting of waiver is justified because the expertise required for
performing the methods already exists among the personnel at this new site
assuming that any new personnel performing testing in the different facility
of the same company have been adequately trained using the intended ana-
lytical modalities.
In spite of such arguments, it must be noted that even when a waiver trans-
fer is judged to be justified and acceptable, it may still be prudent to expect a
minimum interlaboratory cross-over testing to provide continued assurance
that the receiving lab can reliably and competently perform the tests.
752 THE ROLE OF HPLC IN TECHNICAL TRANSFER AND MANUFACTURING
16.5 POTENTIAL PITFALLS DURING TECHNICAL TRANSFER
AND MANUF
ACTURING
Because the success or failure of any technical transfer is judged primarily on
the merits of the agreement data between the originator and participating labs
generated using HPLC, a number of factors must be taken into consideration
to ensure the mitigation of differences in results.
16.5.1 Sample Handling
The impact of sample handling as innocuous as it may appear can have a sig-
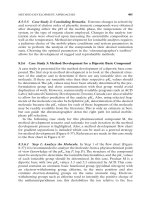
nificant impact on the interpretation of results. Figure 16-4 shows the presence
of an unknown peak (i.e., leachable peak B) that appeared in the chro-
matogram of a sample that was prepared by a chemist in a receiving lab but
was absent in the chromatogram from the originator lab. Follow-up investi-
gation confirmed that the source of the unknown peak initially reported by
POTENTIAL PITFALLS DURING TECHNICAL TRANSFER 753
Figure 16-4. Leachable peaks from nitrile gloves found in the sample. HPLC condi-
tions: Column temperature 35°C, column:YMC ODS-AQ,S-3, 120A, 3.0 mm × 150 mm,
wavelength, 267nm. Gradient Mobile phase A: Water/acetonitrile/TFA (950/50/1,
v/v/v). Mobile phase B: Water/acetonitrile/TFA (50/950/1, v/v/v). Injection volume,
15mL; flow rate, 0.8mL/min.
the receiving lab as degradation peaks was indeed a leachable peak from the
nitrile gloves that the chemist wore during the preparation of the samples
. Inci-
dents such as this goes to highlight the need to exercise caution in the choice
of gloves that can be worn during sample preparation procedures [26, 29].
During the execution of sample preparation procedures, care should be taken
to avoid spillage of solvents onto gloves, and steps should be taken to replace
soiled gloves with new ones.
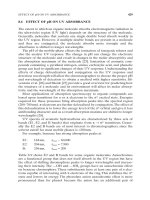
Sonication is a popular sample preparation procedure that is widely used
for sample preparation of solid dosage forms such as tablets and capsules.
However, due to the intense sound waves that sonicators produce, different
models of sonicators occasionally produce different degrees of local hot spots
[26, 27]. Also, sonication may also be dependent on where the solution is
placed in the bath, and the water level in the bath. The chromatograms in
Figure 16-5 show increased formation of two degradation product peaks A
and B that occurred in a sample as the sonication time was extended from 20
to 30 minutes. Due to the potential formation of degradation peaks that could
contribute to nonagreement between results from different labs, explicit
instructions about the duration of the sonication time that should be applied
to the samples, power output of the sonicator, level of water in the sonicator,
and where samples should be placed within the sonicator should always be
provided [26–29].
Another source that contributes to frequent differences in results during
technical transfers is inefficient extraction. This is often attributed to the
754 THE ROLE OF HPLC IN TECHNICAL TRANSFER AND MANUFACTURING
Figure 16-5. Degradation product peaks
A and B formed from prolonged sonication
of samples.
procedures employed in the preparation of the sample. For example, in a pro-
cedure that requires an initial sonication step followed by shaking
, it was
observed that different results were obtained when samples were sonicated
for about 30 minutes with an accompanying occasional shaking of the flasks
versus a combination of sonication followed by vigorous swirling of the flasks.
As much as 3% difference between results was obtained from various studies
in the literature [26, 28–30]. The type of extraction solvent and the manner or
order in which the solvent is added to the sample has also been implicated in
differences observed between results from different laboratories.For example,
in the extraction of β-estradiol from tablets, results obtained varied based on
how the extraction solvent was added. When the tablets were pre-wetted by
the addition of water followed by the addition of the methanol, higher results
were obtained than when a premixed extraction solvent of water/methanol
was used [29]. Adsorption of analytes on the surfaces extraction vessel (i.e.,
glass or plastic) is another classical source that contributes to differences in
results.
The order of addition of solvents in the preparation of mobile phase has
been reported as causing significant differences in retention factors (k) of ana-
lytes, resulting in critical degradation peaks being missed and incorrect assign-
ment of peaks [29, 30]. In the following example, it was noted that the
preparation of the mobile phase required addition of 600mL of methanol to
a graduated flask, and then adding water to a target volume of 1L gave a k
value of 2.32 for a pivotal degradation peak. However, a k value of 3.05 for
the same peak was obtained when the order of addition was reversed by
making the mobile phase a 1-L volume by the addition of 400mL of water first
to the graduated flask and then adding methanol to the 1-L mark [10, 29, 30].
In this example, differences in the ensuring exothermic reaction due to the
sequence of mixing water and methanol that caused volume expansion was
attributed to be the cause for the observed k value differences. In another
reported example, it was noted that chloroform containing no preservative
versus chloroform containing 0.5% ethanol as preservative was responsible
for the same types of compounds to elute differently [29–31] using normal-
phase chromatography.Additionally, slight changes in pH of the mobile phase
is also a well-known source of difference that results in resolution difference
of a critical pair of components that arise from lab to lab. In some instances,
slight changes in mobile-phase pH have been reported to even cause peak
retention reversals [10, 26, 29]. Therefore, precise instructions for the prepa-
ration of mobile phases including pH adjustment must be provided to ensure
that uniform procedures for mobile-phase preparation are followed.
16.5.2 Sample Type and Number of Replicate Determination
One of the challenges faced during the transfer of HPLC methods is to ensure
that samples used in the transfer are from identical batches of materials.Asso-
ciated with this challenge is the determination of the appropriate number of
POTENTIAL PITFALLS DURING TECHNICAL TRANSFER 755
replicate tests that would be required to demonstrate comparability between
results from different labs
.This issue becomes even more important especially
in situations when either out-of-specification (OOS) or out-of-trend (OOT)
results are obtained.An OOT or OOS result triggers a thorough investigation
of the reliability of the analytical methods as well as the manufacturing process
in an attempt to identify an assignable cause [22]. In some cases an assignable
cause is found, whereas in many other cases the investigation may not yield
any assignable cause and thus leads to the performance of additional testing.
An approach that has been proposed to aid in the selection of the appropri-
ate number of tests to be performed is the determination of a K criterion for
successive repeat testing [18].Although the primary focus of the original appli-
cation of the K criterion discusses the number of retests that will have to be
performed in order to nullify an initial suspect result, the concept can be
adopted in deciding the number of replicate tests that will have to be per-
formed to assure batch-to-batch variability in the dosage form does not unduly
influence interpretation of results during the transfer of methods. In the origi-
nal concept, of the K criterion, it was used primarily to assign the number of
additional tests that will have to be performed to assure a 95% chance of
achieving agreement between results from different analysts. As shown in
Table 16-7,the probability of performing additional tests to achieve agreement
between results decreases as the number of repeat testing is increased. In other
words, the likelihood of meeting the acceptance criterion becomes greater
as more tests are performed. For this very reason, indeterminate testing till
compliance is achieved is precisely the rationale behind predetermining
the appropriate number of replicates tests to be performed becomes para-
mount in avoiding situations in which testing continues until agreement is
achieved [22].
16.5.3 Time of Testing
As trivial as the time of testing may be, the time interval between when testing
is performed has been identified as a potential source of difference between
756 THE ROLE OF HPLC IN TECHNICAL TRANSFER AND MANUFACTURING
TABLE 16-7. Number of Retests Required to Achieve Agreement Between Results
True % of Suspect Results with 95% Chance of
Number of Retest, K Meeting Acceptance Criteria
3 1.70
4 1.27
5 1.02
6 0.85
7 0.73
8 0.64
Source:
Adapted from J. D. Hofer, Pharm. Technol. 27(11) (2003), 62.
results obtained for testing of identical materials [19]. To minimize the con-
tribution of testing time differences
, it is recommended that all participating
labs perform testing at about the same time and usually a 1 to 2-week time
difference may be considered acceptable. But when the time interval that had
elapsed between when one lab completed testing versus other participating
labs is more than 2–3 months apart, then it is advisable for all labs to repeat
the test at about the same time.
16.5.4 Instrumental Issues
Tubing and fitting differences between HPLC instruments may contribute to
instances of nonconvergence of results between labs.Depending on the instru-
mental setup and the length and diameter of the tubings used, performance
of the HPLC system can be adversely impacted because of the creation of
additional extra-column volumes [10, 31, 32]. Extra-column volumes dilute the
chromatographic zone, leading to differences in retention behavior and peak
efficiency and hence may lead to the potential for wrong peak assignments
and subpar resolution between critical pairs. An additional factor to consider
is fitting connections, since poor connection can led to a mixing chamber from
between the end fitting and the column and lead to poorer chromatographic
performance. This is especially true if methods are transferred between a
Waters
®
instrument and a non-Waters instrument because Waters
®
end fittings
tend to have a much deeper bore depth [10, 32].
Also, sometimes, interlaboratory differences in results have been traced to
dwell volume differences between the different models of HPLC equipment
[26, 30, 32]. This is particularly true of gradient HPLC methods in which the
failure to make the appropriate adjustments to the gradient program due to
the dwell volume differences results in differences in the retention behavior
of the same analytes between labs [10]. In gradient methods, dwell volume can
have a deleterious effect on the gradient program if care is not taken to ensure
that appropriate adjustments are made to the gradient program to account for
differences in dwell volume of instruments.
16.5.5 Column and Instrumental Issues
16.5.5.1 Column Oven Temperature. Though HPLC is regarded as mature
and an established technique, problems are frequently encountered when
methods are transferred between laboratories. One major uncontrollable vari-
able that has been identified is the temperature of the chromatographic
method [33]. Smith et al. reported that different methods of heating the
column, the design of the column oven, and the lengths of connecting tubes
and the nature of the tubing connecting the injector to the column had a
marked effect on the effective internal temperature in the column and on both
the retention and efficiency measurements. They found that the worst case of
nonagreement of data between labs came from metal block ovens without a
POTENTIAL PITFALLS DURING TECHNICAL TRANSFER 757
fan drive circulating air supply. The most efficient ovens are the ones that use
circulating air ovens probably because these do not create local hot spots by
being able to more efficiently dissipate the heat.
Temperature-induced reten-
tion shifts have been reported to have caused serious issues leading to the
wrong identification of critical peaks [34]. In LC-GC Application Notebook
(February 2004, p. 60), shifts in retention times were observed as temperature
was increased from ambient to 40°C. In that article, it was reported that the
retention time of pyrene decreased from 13.1 to 10.0min and that similar but
much less pronounced shifts were noted for fluorene (7.40min < 6.5min < 6.1
min) and naphthalene (4.7min < 4.2min < 4.0min). In order to circumvent
minor shifts in retention with respect to temperature, Smith et al. recom-
mended (a) specifying the length of tubing connecting the injector to the
column and (b) the use of a calibrated thermometer to adjust column oven
temperatures as an approach to minimize temperature-induced retention time
shifts.
16.5.5.2 Columns Robustness. One of the significant hurdles to be
addressed is specification of the column type to use. Currently, the USP clas-
sifies all C18 columns as type L1. Unfortunately, this classification does not
provide any rational system to differentiate among the myriad differences that
exist among C18 columns with respect to selectivity and retention character-
istics [35–37].Variability in selectivity and retention may exist even in the same
silica-based columns sold by the same vendor or packed by different vendors
[36]. The difference could potentially be attributed to variations in the base
silica and/or the different packing procedures (i.e., solvents used) by the dif-
ferent vendors.The absence of a standardized column characterization system
that can help to determine that a specified C18 column is equivalent to another
coupled with the reluctance of column vendors to reveal the functionality of
their stationary phases poses the greatest challenge in ensuring that equiva-
lent results are obtained during transfer of HPLC methods if different L1-type
columns are used. In addition, peak reversals from one C18-type column to
another as well as the change in resolution as columns age are also issues that
can lead to different labs obtaining different or similar results [26, 30, 36].
Column age can have multiple meanings:
1. Columns are brand new but have not been used (sitting in a box for mul-
tiple years).
2. Columns have been exposed to multiple volumes of mobile phase.
For point 1, the vendor may have changed the manufacturing or packing pro-
cedure for a particular bonded phase or column, respectively. The column
vendor may have performed internal tests according to approved change
control and other compliance procedures and have ensured with the probes
they are using that the columns manufactured with the new process have not
changed their inherent nature with respect to selectivity and retention of the
758 THE ROLE OF HPLC IN TECHNICAL TRANSFER AND MANUFACTURING
probes compared to columns produced with prior manufacturing procedure.
However
, these manufacturing changes can inadvertently affect the selectiv-
ity for the separation performed in the pharmaceutical company, since the
manufacturing test probes are inept in discriminating between the selectivity
differences. It is recommended to discuss with the vendor if any manufactur-
ing changes have been implemented for a particular stationary phase. If so,
columns should be obtained from lots after the manufacturing change was
implemented.
For point 2, column performance can be adversely affected by pumping
multiple volumes of mobile phase through the column due to (a) changes in
the bonded-phase stability at various temperatures, pH values, and pressures
and (b) accumulation of retained analyte components on the stationary phase.
The maximum pH, temperature, and backpressure for which the column can
operate versus the maximum number of column volumes should be known in
order to avoid discrepancy in the data generated between laboratories (new
versus aged column). For method transfer it is suggested that brand new
unused columns (manufactured less than one year) should be used.
Therefore, it is imperative to make sure column lot-to-lot reproducibility is
demonstrated in the validation phase and are packed by the same vendor, and
the vendor should be asked if any manufacturing changes have occurred for
a particular column in order to minimize column robustness issues.
16.5.5.3 Column Frits. Buildup of particulate matter on the column inlet
frit leads to plugging that causes peak splitting and hence difficulty in the
correct assignment of peaks [32, 36, 37]. Plugging due to particulate matter
could be due to poorly filtered samples or the natural wear and tear of pump
seals due to age-releasing materials into the flow path which eventually col-
lects on column inlet frit. Similarly, particulate matter emanating from the
normal wear and tear of injector values into the flow path accumulates on the
column inlet frit.To reduce column plugging, solvent reservoirs should be kept
clean and covered; preferably, samples should be filtered before injection and
pump seals and autoinjector seals should routinely be replaced [29, 32, 37].
16.5.6 Differences in Chromatographic Data Acquisition Systems
Modern HPLC systems equipped with analog-to-digital converters (ADCs)
and initial data acquisition and signal analysis are performed by either built-
in microprocessor or attached computer [38, 39]. Depending on the data acqui-
sition rate and initial analysis criterion (peak height, peak area, or sensitivity
thresholds, etc.), the integration limits or area calculation could be erroneous,
and in some cases the whole peaks could be missed.
Though most modern data acquisition systems can either sense or adjust
integration parameters to accommodate baseline drift or permit manual
setting of parameters to overcome drift-induced problems, it is still easy to
mistake a system peak arising from the mobile phase as an impurity if the
POTENTIAL PITFALLS DURING TECHNICAL TRANSFER 759