Tài liệu HPLC for Pharmaceutical Scientists 2007 (Part 19) pptx
Bạn đang xem bản rút gọn của tài liệu. Xem và tải ngay bản đầy đủ của tài liệu tại đây (1.75 MB, 63 trang )
19
LC/MS
ANALYSIS OF PROTEINS
AND PEPTIDES IN DRUG
DISCOVERY
Guodong Chen, Yan-Hui Liu, and Birendra N. Pramanik
19.1 INTRODUCTION
The modern drug discovery process, in general, involves the identification of
a biochemical target (usually protein target), screening of synthetic com-
pounds or compound libraries from combinatorial chemistry/natural sources
for a lead compound, and optimization of the lead compound (activity, selec-
tivity, pharmacokinetics, etc.) for recommending a potential clinical candidate.
The ultimate goal is to develop highly potent compounds (small molecules)
that bind noncovalently with target proteins and produce the desired thera-
peutic response with minimal side effects [1].
In addition, the discovery of DNA structures by Francis Crick and James
Watson laid a foundation for the $30 billion-a-year biotechnology industry that
has produced some 160 drugs and vaccines, treating everything from breast
cancer to diabetes. Recent advances in recombinant DNA technology have
provided means to produce and develop protein products as novel drugs, vac-
cines, and diagnostic agents. For example, INTRON A (interferon α-2b) is one
of the first recombinant protein drugs introduced on the market.This synthetic
E. coli recombinant DNA-derived protein functions as a natural interferon
produced by the human body as part of the immune system in response to the
presence of enemy cells. It not only interferes with foreign invaders that may
cause infections, but also prevents the growth and spread of other diseased
837
HPLC for Pharmaceutical Scientists, Edited by Yuri Kazakevich and Rosario LoBrutto
Copyright © 2007 by John Wiley & Sons, Inc.
cells in the body. This protein drug is effective in treating hepatitis C virus and
a variety of tumors
. ENBREL (etanercept) is another protein drug used for
treatment of rheumatoid arthritis.It is produced from a Chinese hamster ovary
mammalian cell expression system. This protein drug is a dimeric fusion
protein consisting of the extracellular ligand-binding portion of the human
75-kilodalton (kDa) tumor necrosis factor receptor (TNF). TNF is one of the
chemical messengers that are involved in the inflammatory process.Too much
TNF produced in the human body overwhelms the human immune system’s
ability to control inflammation in the joints. ENBREL binds to and inactivates
some TNF molecules before they can trigger inflammation, thus reducing
inflammatory symptoms [2, 3].
One of difficulties encountered in producing large quantities of biologically
active proteins is the elimination of microheterogeneity related to these pro-
teins. The therapeutic proteins and the drug target proteins are usually asso-
ciated with post-translational modifications, such as phosphorylation [4],
glycosylation [5], aggregation, and disulfide bond formation [6], with all
contributing to the heterogeneity of the proteins. These post-translational
modifications control many biological activities/processes. Therefore, charac-
terization of proteins with respect to assessment of purity and structure is an
integral part of the overall efforts toward drug development, including sub-
mission of the analytical data to the regulatory agencies. Furthermore,
progress in genomics and proteomics research has generated new proteins that
require rapid characterization by analytical methods [7].
19.2 GENERAL STRATEGIES FOR ANALYSIS
OF PROTEINS/PEPTIDES
The analytical strategies for protein characterization rely heavily on high-
performance liquid chromatography (HPLC) and/or electrophoretic separa-
tion of proteins/peptides, followed by other detection methods [e.g., mass
spectrometry (MS)].
19.2.1 HPLC Methods in Proteins/Peptides
Achieving good separation of proteins/peptides is always one of many
challenges in chromatographic separations. Proteins are highly complex mole-
cules with enormous amount of structural diversity, including hydrophobic/
hydrophilic and anionic/cationic interactions. The differences in physical,
chemical, and functional properties of proteins/peptides provide the molecu-
lar basis for their separations.There are five basic chromatographic separation
methods, including size-exclusion chromatography, ion-exchange chromatog-
raphy, reversed-phase chromatography, hydrophobic interaction chromatog-
raphy (HIC), and affinity chromatography (detailed discussions on the first
three techniques are provided in Part I of this book) [8, 9].
838 LC/MS ANALYSIS OF PROTEINS AND PEPTIDES IN DRUG DISCOVERY
Size-exclusion chromatography (often referred to as gel filtration or gel per-
meation chromatography) is a chromatographic process involving separation
of proteins on the basis of their differential apparent molecular sizes [10].
The
column packing materials usually consist of particles with well-controlled pore
size. When mobile-phase liquid flows through these particles, the proteins
(solutes) with different size can get into and out of the pores with different
accessibility. For a specific size-exclusion column with a specific pore size, pro-
teins with molecular weights above the exclusion limit (in daltons) of the
column are too large to enter the pores and are excluded from the column.
Proteins with molecular weights less than the exclusion limit can have differ-
ent access to pores of particles and elute after the void volume, depending on
their size and shape. In theory, there is a linear relationship between the log-
arithm of protein molecular size (molecular weight) and the elution volume
of the protein.A calibration curve based on this linear relationship can be used
to determine the molecular weight of proteins, assuming that the protein is
globular and symmetrical in shape, and there is no other interaction between
the protein and column. In practice, denaturants (e.g., 0.1% SDS) are some-
times used in the mobile phase to disrupt possible formation of undesired
protein aggregates in solution and promote uniformity in conformations of
proteins. Thus, the separation can be performed in near-ideal situations to
obtain more accurate molecular weight determination of proteins using this
approach.
Several parameters should be given special consideration in method devel-
opment of size-exclusion chromatography. Although its nature of separation
requires no interactions between the proteins and stationary phase, the
column packing material often exhibits anionic and hydrophobic characters.
The addition of salts to the mobile phase can suppress these column effects.
However, a higher concentration of salts (>0.5 M) might promote hydropho-
bic interactions between proteins and the column. Amount of salts added to
the mobile phase should be carefully adjusted. Another factor is pH value.
The formation of silanolate anions from column can be minimized by carrying
out experiments at pH values less than 7. Typical experimental conditions
include mobile phases with low ionic strength buffers (<0.1M) in near-
physiological pH ranges—that is, 50mM phosphate buffer with 100mM KCl
(pH 6.8). Flow rates can vary from 0.5mL/min to 1.0mL/min,although a better
resolution can be achieved with slower flow rates.The sample injection volume
and analyte concentration is also critical for optimum performance. The
loading capacity is very low for size-exclusion chromatography. Generally, the
sample injection volume should not exceed 5% of the column bed volume in
order to maintain good resolution. Protein samples should be concentrated
without causing precipitation prior to analysis. Once an appropriate method
is developed, size-exclusion chromatography can be an excellent method for
separation of protein complexes. It is also suitable for buffer exchange as a
desalting procedure in protein purifications (salts can be easily separated from
proteins by size-exclusion chromatography) and estimation of the molecular
GENERAL STRATEGIES FOR ANALYSIS OF PROTEINS/PEPTIDES 839
weight of proteins. A key advantage of this technique is that the biological
activity of proteins is maintained during the separation.
Ion-exchange chromatography relies on reversible
, electrostatic (or ionic)
interactions between charged proteins/peptides in the mobile phase and
charged ion-exchange group on the stationary phase [11]. Proteins/peptides
normally possess either net positive or negative charges depending on pH.
They are positively charged at pH values below their pI (isoelectric point) and
negatively charged at pH values above their pI. For acidic proteins and pep-
tides (pI < 6), they are normally separated using anion-exchange columns
because they are negatively charged. Basic proteins and peptides (pI > 8) are
usually chromatographed on cation-exchange column because they are posi-
tively charged. The choice of pH is important for optimum separation results.
The pH of the mobile phase is typically set at least one pH unit away from
the pK
a
of its ion-exchange resin in order to keep 90% of the full charge
on the column. For anion-exchange column, the pH is chosen to be lower than
the pK
a
. For cation exchangers, the pH is set to be higher than the pK
a
. Other
key parameters include the ionic strength of the mobile phase. The salts used
in the buffer solution are the counterions that might bind to the ion-exchange
column in competition with proteins/peptides. Thus, if a protein/peptide is
strongly bound to the ion-exchange column, a stronger counterion can be used
to improve the elution. Some common counterions with their relative strength
include Cs
+
> K
+
> NH
+
4
> Na
+
and PO
4
3−
> CN
−
> HCOO
−
> CH
3
COO
−
.The
unique feature of ion-exchange chromatography is that the biological activity
of proteins is almost always preserved, and this separation method can also be
used to concentrate dilute protein samples.
More recently, another related technique — chromatofocusing — has
emerged as a chromatographic technique complementary to electrophoretic
methods for pI determination. Chromatofocusing is an ion-exchange tech-
nique in which a pH gradient is established across the column, allowing for
the eventual separation of amphoteric substances (i.e.,proteins) based on their
pI. The main advantages of chromatofocusing are high loadability of the
column, high resolution power allowing separation of two proteins (i.e.,
protein and a degradation product variant) differing less than 0.05pI units, and
the high efficiency due to both gradient elution mode and special focusing
effect of the polyampholytes. Furthermore, peptides and proteins are less
likely to precipitate in chromatofocusing than in isoelectrical focusing.
Reversed-phase (RP) chromatography is a hydrophobic separation tech-
nique based on the interaction between the nonpolar regions of proteins/
peptides and the stationary phase [12]. It typically utilizes volatile organic sol-
vents (acetonitrile, etc.) as mobile phases under acidic pH conditions. It pro-
vides high speed and high efficiency and is compatible with MS detection.This
technique is the most widely used HPLC method in the separation of peptides
and proteins.
There are a number of factors to be considered in method development of
RPLC for separation of proteins and peptides. Appropriate pore size is one
840 LC/MS ANALYSIS OF PROTEINS AND PEPTIDES IN DRUG DISCOVERY
of primary considerations in selecting a column. For proteins greater than
10
kDa, large pore size (300Å) is necessary to reduce restriction of the protein
into the stationary phase and avoid poor recoveries and decreased efficien-
cies. Polypeptides (<10 kDa) can be effectively separated using a column with
a small pore size (<150Å). The hydrophobicity of the protein is also impor-
tant when choosing a column. In general, C18 column is used for hydrophilic
proteins/small peptides, and C4 or C5 bonded phase is used for hydrophobic
proteins/large polypeptides. The use of C4/C5 column for hydrophobic pro-
teins may reduce undesired protein absorption on the column because more
retentive C18 column for hydrophobic proteins can lead to irreversible
binding of the protein to the column.The most commonly used mobile phase
in RPLC involves acetonitrile solution with 0.1% trifluoroacetic acid (TFA).
In addition, alcohols such as isopropanol are sometimes used for large and
more hydrophobic proteins to enhance the elution and improve recovery. Note
that all mobile phase reagents should be of the highest quality to avoid the
appearance of ghost peaks from solvent impurities. Some ion-pairing reagents
are often used to optimize resolution and retention. For example, hydropho-
bic, anionic ion-pairing reagents (i.e.,TFA and pentafluoropropionic acid) can
complex with positively charged basic residues and influence the chromatog-
raphy. On the other hand, hydrophobic, cationic ion-pairing reagents (i.e., tri-
ethylamine acetate) interact with negatively charged groups (i.e., carboxylic
acid, free carboxyl terminus at pH > pK
a
) and effect their retention. Thus,
manipulation of ion-pairing reagent and pH value provides alternative
approaches in optimizing RPLC. Variation of flow rate and gradient rate can
have an impact on the chromatography as well. An increase in flow rate or a
decrease in gradient rate improves resolution, although it may result in a loss
of sensitivity.Typically, a shallower gradient is employed to maintain good res-
olution—that is, 0.25% to 4% per minute. Column temperature also affects
the separation. Higher column temperature usually improves column effi-
ciency, peak shape, and resolution. However, it may lead to the loss of bio-
logical activity of the protein.
Hydrophobic interaction chromatography involves weak interactions of
hydrophobic patches on the surface of the intact protein and nonpolar groups
on the stationary phase [13]. This technique uses aqueous mobile phases of
high ionic strength and neutral pH. It does not denature or unfold proteins
and can be used to detect protein conformational changes. Key factors affect-
ing protein separations include column, salt, mobile-phase pH, and tempera-
ture. Most columns used in HIC are made of silica-based stationary phases
with modified aryl groups, diol derivatives, and short alkyl chains. The overall
hydrophobicity of the stationary phase is determined by both the nonpolar
character of the bonded ligands and their density. Strong column-solute inter-
actions should be avoided to reduce denaturation.The type and concentration
of salt are critical in HIC. One of considerations in choosing a salt is its surface
tension. Salts with higher surface tension values may lead to the increase in
solute retention. The amount of proteins bound to the column also increases
GENERAL STRATEGIES FOR ANALYSIS OF PROTEINS/PEPTIDES 841
with increasing of salt concentration. More hydrophobic proteins should be
separated using salts with higher surface tensions
. Commonly used salts with
relative surface tension include KCl < NaCl < Na
2
HPO
4
< (NH
4
)
2
SO
4
<
Na
3
PO
4
, with typical concentrations ranging from 1M to 3M in order to max-
imize selectivity or column capacity. The pH value in HIC is usually main-
tained in the neutral range (pH 5–8). Appropriate pH for the optimization
of resolution/selectivity in HIC can only be made empirically since proteins
differ significantly in their susceptibility to denaturation with changing of pH.
Another important parameter in developing HIC method is temperature. In
general, proteins tend to be more stable at lower temperatures. To maintain
the conformations of proteins,the lowest temperature sufficient for separation
should be used in the HIC technique.
As an illustration of HIC technique, the recombinant human growth
hormone (hGH) and methionyl hGH (met-hGH) were well-separated by
the HIC technique [14]. The optimized conditions were found to be 1M
ammonium phosphate dibasic, pH 8.0/propanol (99.5:0.5) and 0.1M sodium
phosphate dibasic, pH 8.0/propanol (97.5:2.5) for mobile phase A and B,
respectively, with a descending gradient from 100% A to 100% B in 30 minutes
at a column (TSK-phenyl 5PW, 75 × 7.5mm) temperature of 30°C. Note that
the addition of a small amount of propanol as organic modifiers significantly
decreases elution time while maintaining resolution and efficiency. This HIC
method allowed separation of several hGH variants from the main hGH peak
while retaining their native structures.
Affinity chromatography is based on reversible, specific binding of one
biomolecule to another [15]. The analyte to be purified is specifically and
reversibly adsorbed to a ligand (binding substance) that is immobilized by a
covalent bond to a chromatographic bed material (matrix). The choice of
ligand is a critical factor in affinity chromatography, because it determines the
interaction mode between the solute and the ligand. There are two types of
ligands: specific ones and multifunctional ones. Specific ligands include potent
binders of single classes of peptides or proteins, such as enzyme substrates/
inhibitors and antigens/antibodies. Examples of multifunctional ligands
include (a) concanavalin A that binds to some specific carbohydrate residues
and (b) nucleotides that bind to enzymes. The chromatography steps involve
sample loading in which samples are applied under favorable conditions for
their specific binding to the ligand. Analytes of interest are consequently
bound to the ligand while unbound substances are washed away. Recovery of
molecules of interest can be achieved by changing experimental conditions to
favor desorption (elution). Various elution techniques used include changes
in mobile-phase composition (e.g., ionic strength, pH) and disruption of
ligand/solute complex using competitive ligands in the mobile phase. The sep-
aration of analytes depends on their native conformations (for proteins) and
relative binding affinities for the immobilized ligand on the column.The affin-
ity interactions can be extremely specific, an antibody binding to its antigen,
and so on. This technique is a powerful tool in investigating protein–protein,
842 LC/MS ANALYSIS OF PROTEINS AND PEPTIDES IN DRUG DISCOVERY
protein–peptide, and drug–protein interactions. Its applications in inhibitor
screening using affinity chromatography–MS methods in drug discovery will
be discussed later in this chapter
.
19.2.2 MS Methods for Protein Characterization
MS is another powerful analytical technique for protein characterization.This
technique measures mass-to-charge ratios of ions in the gas phase, providing
both molecular weight (MW) information and structural information [16].
The introduction of electrospray ionization (ESI) [17, 18] and matrix-assisted
laser desorption/ionization (MALDI) [19] or soft ionization [20] has revolu-
tionized applications of MS in protein characterization, making it quite
straightforward to analyze proteins with molecular weight of over 1 million
daltons (Da). ESI forms multiple-charged ions for proteins/peptides by spray-
ing the sample solution through a nozzle under a strong electrical field. The
molecular weight of a protein can be calculated from a group of [M + nH]
n+
ions in the ESI spectrum with a better precision. Also, multiple-charge ions
appear at m/z values which are only fractions of the actual molecular weight
of the analyte. This allows one to observe high-molecular-weight proteins
beyond the normal mass range of a mass spectrometer. In addition, ESI oper-
ates at atmospheric pressure, which allows the direct on-line analysis by inter-
facing HPLC with MS.The MALDI technique has high ionization efficiencies
for proteins and can achieve a mass range of over 500kDa when coupled with
a time-of-flight (TOF) mass analyzer. In this technique, proteins are mixed
with an IR or UV absorbing matrix in large excess and the mixed sample is
deposited on a sample target, dried, and inserted into the mass spectrometer
for laser irradiation. In contrast to multiple-charge ions in ESI, the singly
charged ions are the most abundant species in the MALDI-MS spectrum.
Higher sensitivity (lower femtomole) can be achieved with MALDI-MS
analysis.
The very first step in protein characterization is the molecular weight deter-
mination.With multiple-charge ions formed in ESI, a deconvoluted mass spec-
trum can be generated to give an average molecular weight of the protein by
calculating from successive multiple-charged ions. For example, Figure 19-1
shows an ESI mass spectrum of a recombinant interferon α-2b (antiviral
protein drug) with a charge distribution of +9 to +13. The deconvoluted spec-
trum (Figure 19-1, insert) gives a molecular weight of 19,266.3Da for this
protein. The mass measurement precision and accuracy are enhanced by the
use of all the observed multiple-charged ions (typically better than 0.01% for
masses up to 100kDa) [21]. The MALDI-MS technique can also be employed
to analyze intact proteins with high tolerance of impurities (salts, etc.). Figure
19-2 illustrates a MALDI-TOF mass spectrum of 1pmol of anti-IL-5 MAB
protein with an average molecular weight of 146.5kDa [1]. The singly charged
molecular ion [M + H]
+
is observed at m/z 146,485, along with a doubly charged
molecular ion.
GENERAL STRATEGIES FOR ANALYSIS OF PROTEINS/PEPTIDES 843
The protein identification or sequence determination of a protein can be
achieved using two different approaches:
“top-down” [22, 23] and “bottom-
up” [24].A top-down experiment involves high-resolution measurement of an
intact molecular weight and direct fragmentation of protein ions by tandem
mass spectrometry (MS/MS) [25]. This approach surveys an entire protein
sequence with 100% coverage. Post-translational modifications such as glyco-
844 LC/MS ANALYSIS OF PROTEINS AND PEPTIDES IN DRUG DISCOVERY
Figure 19-1. Positive ion ESI mass spectrum of rh-IFN-α-2b.The insert shows a decon-
voluted spectrum.
Figure 19-2. MALDI-TOF mass spectrum of 1pmol of anti-IL-5 MAB protein.
(Reprinted from reference 1, with permission of the Thomson Corporation.)
sylation and phosphorylation tend to remain intact during MS/MS fragmen-
tation at the protein level.
The fragment ions obtained allow the protein iden-
tification by database retrieval, quick positioning of the N- and C-termini,
confirmation of large sections of sequences, and partial or exact localization
of modifications. This is a preferred method for protein identifications.
However, there are some obstacles that need to be overcome before this
approach can be widely accepted as a standard in protein identifications.These
challenges include accessibility of expensive MS instrumentation for accurate
mass measurements of large proteins, development of suitable MS instru-
mentation for efficient MS/MS data acquisition in automatic fashion, and
appropriate database search algorithm. In contrast to the top-down method-
ology, the bottom-up experiment refers to the process in which proteins are
digested into smaller peptides under enzymatic cleavages without measuring
the accurate mass value of the intact protein. These enzymatic digested pep-
tides (tryptic peptides, etc.) often can be unique in terms of their mass, amino
acid composition/sequence, and separation characteristics. They can be sepa-
rated/detected and either (a) directly searched against a genome or protein
database for protein identification (peptide mass mapping) or (b) further dis-
sociated in a tandem mass spectrometric experiment to generate fragment ions
for database search (sequence tagging) [26, 27]. The principal fragment ions
in polypeptide ions are b ions (N-terminus) and y ions (C-terminus) resulted
from cleavages of amide bonds under collision-induced dissociations [28].
These are amino acid-specific fragment ions and can be used to derive
sequences of polypeptides. Further database search based on the MS/MS
information can lead to identification of proteins. The general sequence cov-
erage from this approach (5–70%) is far less than 100% from top-down
approach. Post-translational modifications are likely to be lost during MS/MS
fragmentation at the peptide level. In spite of these limitations, the bottom-up
approach has become a current standard method in protein identifications
because of its high-throughput format and well-refined methodology—for
example, mature instrumentation and excellent software development [29].
Some specific examples using this approach will be described in the following
sections.
19.3 APPLICATIONS FOR BIOTECHNOLOGY PRODUCTS AND
DRUG TARGETS
19.3.1 Biotechnology Products Development
The production of biologically important proteins by recombinant DNA tech-
niques and development of modified counterparts is a very challenging field.
Certain criteria of safety, quality, and efficacy are required for the develop-
ment and approval of these protein products as therapeutic agents. The
presence of structural variations during the different steps in the protein
APPLICATIONS FOR BIOTECHNOLOGY PRODUCTS AND DRUG TARGETS 845
production process could affect the protein’s biological properties and alter
the safety
, potency, and stability of the protein product. The development of
sensitive analytical techniques for the analysis of therapeutic proteins is essen-
tial for the quality control and structural characterization of recombinant
protein products. Two examples are illustrated below, including recombinant
human granulocyte-macrophage colony stimulating factor (rh-GM-CSF) and
interferon alpha-2b (rh-IFN-α-2b).
19.3.1.1 rh-GM-CSF. GM-CSF belongs to a group of interacting glycopro-
teins that regulate the differentiation, activation, and proliferation of multiple
blood-cell types from progenitor stem cells. This particular glycoprotein is
essential for the proliferation and differentiation of progenitor cells into
mature granulocytes and macrophages [30]. It enhances the production and
function of white blood cells with its potential clinical applications for follow-
up treatment for patients who have gone through chemo or radiation therapy
for tumors, as well as bone marrow transplantation. GM-CSF has been cloned
and expressed in various cell lines that include yeast, Chinese hamster ovary,
and E. coli.The E. coli derived GM-CSF used in this study contains 127 amino
acid and has a molecular weight of ∼14,477.6Da.
One of the first measurements performed to characterize a protein is deter-
mination of the molecular weight. It is an important physical parameter that
can be used to confirm primary structure and identity of the protein, charac-
terize post-translational modifications, and determine batch-to-batch repro-
ducibility in the production of recombinant proteins. The mature protein
sequence for human GM-CSF with four cysteine residues is shown in Table
19-1 [31]. Figure 19-3A displays the ESI-MS spectrum of rh-GM-CSF, con-
taining a series of multiply-charged ions ranging from the 7+ to the 16+ charge
state that correspond to molecular ions of the protein. The measured average
molecular weight (14,472Da, as shown in the insert) suggests the presence of
two disulfide bonds in the rh-GM-CSF because the calculated averaged
molecular weight of rh-GM-CSF derived from the sequence is 14,477.6Da
846 LC/MS ANALYSIS OF PROTEINS AND PEPTIDES IN DRUG DISCOVERY
TABLE 19-1. Amino Acid Sequence of rh-GM-CSF from E. Coli
APARSPSPSTQPWEHVNAIQEARRLLNLSRDTAAEMNETVEVI
-T
1
-→ T
2
→ T
3
→
V
1
→ V
2
→ V
3
→-V
4
->-V
5
->
SEMFDLQEPTC
54
LQTRLELYKQGLRGSLTKLKGPLTMMASHYK
T
4
→ T
5
→ T
6-
→ T
7
→T
8
> T
9
→
V
6
> V
7
→ V
8
→ V
9
QHC
88
PPTPETSC
96
ATQIITFESFKENLKDFLLVIPFDC
121
WEPVQE
T
10
→-T
11
-> T
12
→
→ V
10
→-V
11
-> V
12
→-V
13
→
a
T
he T
n
and V
n
indicate expected tryptic and S. aureus V8 protease peptides,
respectively.
(without accounting for existing disulfide bonds). This was further supported
by ESI-MS analysis of rh-GM-CSF after reduction with β-mercaptoethanol,
as shown in F
igure 19-3B. The 4-Da mass shift of the measured molecular
weight of reduced rh-GM-CSF (14,476Da) from nonreduced rh-GM-CSF con-
firms the presence of two disulfide bonds in the protein molecule. In addition,
the charge state distribution is also shifted to higher charge states (17+,18+,
19+,20+) for the reduced form, indicating a more open form of protein struc-
ture for protonations upon disulfide-bonds reduction. Furthermore, the mol-
ecular weight information obtained from ESI-MS spectrum has a higher
accuracy of mass measurement (generally better than 0.01%).
The primary structural information of the protein can be obtained by enzy-
matic cleavage of the protein into smaller peptide fragments, followed by MS
determination of the molecular weights of the resulting mixture peptides
(peptide mass mapping). In this case, peptide mass mapping involved enzy-
matic digestion of the rh-GM-CSF with either trypsin or Staphylococcus
aureus V8 protease, followed by MS analysis of digestion mixtures. Trypsin
APPLICATIONS FOR BIOTECHNOLOGY PRODUCTS AND DRUG TARGETS 847
Figure 19-3. Positive ion ESI mass spectra of rh-GM-CSF. (A) In 1% HCOOH and
(B) after treatment with β-mercaptoethanol. The deconvoluted spectra are shown in
the inserts. (Reprinted from reference 31, with permission of the Protein Society.)
selectively cleaves rh-GM-CSF at the C-terminal side of argine (R) and lysine
(K),
while V8 protease specifically cleaves the peptide bond on the C-
terminal side of glutamic acid (E) residues.It is important to note that an enzy-
matic digest of a large protein can yield fragments of incomplete digestion.
For example, trypsin does not cleave at a lysine-proline (K-P) bond, and R-P
bonds are marginally more susceptible.Also, peptide fragments that contained
two contiguous basic sites (K-K, K-R, R-R, etc.) are observed with R or K on
the N-terminal. This results from the poor exoprotease activity of typsin. Sim-
ilarly,V8 protease can produce incomplete digestion products;Asp (D) is occa-
sionally cleaved.The expected peptide fragments from enzymatic cleavages of
rh-GM-CSF with trypsin or V8 are shown in Table 19-1. For tryptic digest of
unmodified rh-GM-CSF (V0), the mass values of the majority of the observed
signals could be matched with the molecular ions of the tryptic peptides
predicted from amino acid sequence (Table 19-2), with the exception of the
cysteine-containing fragments T
4
(DTAAEMNETEVISEMFDLQEPTC
54
LQTR), T
10
(QHC
88
PPTPETSC
96
ATQIITFESFK), and T
12
(DFLLVIPFDC
121
WEPVQE).These peptide fragments (T
4
,T
10
,T
12
) are interconnected by disul-
fide bonds with an isotopically averaged mass of 7614.6Da, as illustrated in
Figure 19-4. This disulfide-linked core peptide was detected at m/z 7613.3 by
Cs
+
liquid secondary-ion MS, indicating the presence of this core peptide and
two disulfide bonds in rh-GM-CSF. Furthermore, these peptide fragments
were released after treatment of the tryptic digests with dithiothreitol (reduc-
ing reagent), and subsequent MS analysis of the mixture yielded signals at m/z
3202.3, 2466.8, and 1951.8 corresponding to their free sulfhydryl forms as T
4
,
T
10
, and T
12
, respectively, thus confirming the presence of two disulfide bonds
in rh-GM-CSF. The assignment of the cysteine-containing peptides was also
confirmed by MS analysis of a tryptic digest of rh-GM-CSF in which the
cystine residue were S-alkylated with 4-vinylpyridine in the presence of tri-N-
848 LC/MS ANALYSIS OF PROTEINS AND PEPTIDES IN DRUG DISCOVERY
TABLE 19-2. Tryptic Digest of rh-GM-CSF (V0) and Its Variants (V1 and V2)
Expected Ions Ions Ions
Mass Observed Observed Observed
Code Sequence Value (V0) (V1) (V2)
T
1
APAR 413 +++
T
2
SPSPSTQPWEHVNAIQEAR 2134 +++
T
3
(R)LLNLSR 715 +
a
++
T
4
DTAAEMNETVEVISEM
46
FDLQEPTC
54
LQTR 3202 ++3218
T
5
LELYK 665 +++
T
6
QGLR 473 +++
T
7
GSLTK 505 +++
T
8
LK 259
b
T
9
GPLTM
79
M
80
ASHYK 1236 + 1252 1252
T
10
QHC
88
PPTPETSC
96
ATQIITFESFK 2466 ++
T
11
ENLK 502 +++
T
12
DFLLVIPFDC
121
WEPVQE 1950 ++
a
Also as RLLNLSR.
b
Observed as
T
8-9
at m/z 1477.
butylphosphine [32]. The resulting pyridylethyl cysteine tryptic peptides were
observed as strong ions with masses 106
Da higher than the unmodified pep-
tides (data not shown).
Although tryptic peptide mass mapping of rh-GM-CSF demonstrated the
presence of two disulfide bonds and suggested two possible combinations of
disulfide pairing (i.e., exact modification site) as C54-C88/C96-C121 or C54-
C96/C88-C121, the assignment of the disulfide pairing was not possible due to
absence of a tryptic site between C88 and C96 residues of T
10
. Thus, V8 pro-
tease was employed to digest rh-GM-CSF and cleave the protein between each
half-cystine residue at the C-terminal side of glutamic acid. The MS analysis
of the V8 protease digest of rh-GM-CSF confirmed the presence of most
of the predicted peptides (Table 19-3). The ions at m/z 2272 and 3036
corresponded to the disulfide-linked peptides V
8
-SS-V
10
(PTC
54
LQTRLE-
SS-TSC
96
ATQIITFE) and V
7,8
-SS-V
10
(MFDLQE PTC
54
LQTRLE-SS-
TSC
96
ATQIITFE), arising from incomplete cleavage at Glu(51). These MS
signals disappeared upon dithiothreitol (DTT) reduction reaction, thus sug-
gesting a Cys(54)–Cys(96) disulfide bond.The absence of digested peptides V
1
and V
7
was likely due to the incomplete cleavages, as indicated by the pres-
ence of V
1-2
and V
7-8
peptides. Interestingly, V
9
and V
12
peptides were not
observed in the spectra despite their hydrophobic character based on primary
structures. This signal suppression may arise from contributions of peptide’s
secondary or tertiary structure affecting its hydrophobic character [31]. To
overcome the difficulty in detecting absent peptides, the mixture of digested
V8 peptides was separated by HPLC and isolated fractions were analyzed by
MS. All 13 V8 peptide fragments were revealed. V
1
peptide was observed as
V
1-2
at m/z 2302, while V
7
peptide was shown as part of V
7-8
at m/z 1824 due
to incomplete cleavages.V
9
peptide was not only seen at m/z 3712 as expected,
but was identified as V
9
-SS-V
12-13
(LYKQGLRGSLTKLKGPLTMMASHYK
QHC
88
PPTPE-SS- NLKDFLLVIPFDC
121
WEPVQE, m/z 6017.6) and V
9
-
SS-V
11-13
(LYKQGLRGSLTKLKGPLTMMASHYKQHC
88
PPTPE-SS-
APPLICATIONS FOR BIOTECHNOLOGY PRODUCTS AND DRUG TARGETS 849
Figure 19-4. Amino acid sequence and calculated average mass values of the tryptic
peptides comprising the disulfide-linked core peptide in rh-GM-CSF.
SFKENLKDFLLVIPFDC
121
WEPVQE, m/z 6508.7) [31].
These data clearly
established another pairing of disulfide bond between Cys(88) and Cys(121).
For a recombinant protein, post-translational modifications such as phos-
phorylation, oxidation, deamidation, and sulfation are known to occur. The
GM-CSF variants were first observed after SDS polyacrylamide gel elec-
trophoresis (SDS-PAGE) of an E. coli derived GM-CSF preparation as a hazy
band located slightly above the band corresponding to unmodified GM-CSF
(V0). The haze was further separated and purified by preparative reversed-
phase HPLC. Typically, a Rainin Dynamax C4 column (300Å, 4.1 × 250mm)
was run at a flow rate of 30mL/min on a Rainin autoprep preparative HPLC
system. Samples were eluted using a linear gradient of 27% to 72% acetoni-
trile in 0.1% trifluoroacetic acid (TFA) over a 30-min period.A Knauer vari-
able wavelength detector set at 280-nm absorbance was used to monitor peaks.
Fractions were taken manually based on UV absorption and retention time.
Isolated fractions containing two GM-CSF variants V1 and V2 were diluted
threefold and re-chromatographed separately on a Rainin Dynamax C4
column (300Å, 2.1 × 250mm) at a flow rate of 10mL/min on a Rainin auto-
prep HPLC system using a linear gradient of 27% to 72% acetonitrile in 0.1%
TFA. These two variants, V1 and V2, were found to have comparable biolog-
ical activity to the parent GM-CSF (V0). Further structural identification work
was carried out on isolated fractions using MS methods.
The peptide mass mapping strategy using trypsin and V8 protease was
applied to solve structural identification problems of the variants. The com-
parison of the trypsin and V8 protease digest of the native GM-CSF (V0) and
850 LC/MS ANALYSIS OF PROTEINS AND PEPTIDES IN DRUG DISCOVERY
TABLE 19-3. V8 Protease Digest of rh-GM-CSF (V0) and Its Variant (V2)
Expected
Mass Ions Ions
Code Sequence Value (V0) (V2)
V
1
APARSPSPSTQPWE 1511
V
2
HVNAIQE 810 ++
V
3
ARRLLNLSRDTAAE 1586 ++
V
4
MNE 393 ++
V
5
TVE 347 ++
V
6
VISE 447 ++
V
7
MFDLQE 782
V
8
PTC
54
LQTRLE 1060 ++
V
9
LYKQGLRGSLTKLKGPLTMMASHYKQHC
88
PPTPE 3713
V
10
TSC
96
ATQIITFE 1214 ++
V
11
SFKE 510 ++
V
12
NLKDFLLVIPFDC
121
WE 1852
V
13
PVQE 472 ++
V
7-8
M
46
FDLQEPTC
54
LQTRLE 1824 + 1840
LQE-V
8
LQEPTC
54
LQTRLE 1431 ++
V
7-8
-SS-V
10
M
46
FDLQEPTC
54
LQTRLE-SS-TSC
96
ATQIITFE 3036 + 3052
LQE-V
8
-SS-V
10
LQEPTC
54
LQTRLE-SS-TSC
96
ATQIITFE 2641 +
V
8
-SS-V
10
PTC
54
LQTRLE-SS-TSC
96
ATQIITFE 2272 +
V
12
NLKD 488 +
its variant V1 and V2 demonstrated that one or two methionine residues in
V0 have been converted to methionine sulfoxides (T
ables 19-2 and 19-3). In
the case of V1, tryptic peptide T
9
had a mass increase of 16Da (m/z 1252,Table
19-2), suggesting oxidation of Met(79) or Met(80). In the case of V2, however,
both the tryptic peptide T
4
(m/z 3218) and T
9
(m/z 1252) had a mass shift of
16Da with respect to T
4
and T
9
in V0 (Table 19-2).Therefore,V2 contains two
methionine sulfoxides: one at Met(46), the other at Met(79) or Met(80). The
assignment of Met(46) oxidation was further confirmed by a mass increase of
16Da for V8 protease peptides V
7-8
and V
7-8
-SS-V
10
. No tandem MS experi-
ments were attempted to differentiate oxidation sites between Met(79) and
Met(80) at that time because of instrumentation limitations, although these
experiments would have provided detailed information on the exact modifi-
cation sites. An example on this approach using modern instrumentation is
illustrated in the case of rh-IFN-α-2b. The structural assignments of V1 and
V2 were further supported by MS studies of chemically modified proteins
VS-1,VS-2,VS-3, and VS-4 that have different degrees of oxidation of the four
methionine residues in rh-GM-CSF amino acid sequence (data not shown). In
these experiments, GM-CSF was treated with H
2
O
2
under optimized condi-
tions to produce oxidized proteins.The preferential oxidation of Met(79) was
observed in the mapping experiments of permethylated GM-CSF, where an
unusual cleavage at Met(79)-Met(80) yielded a signal at m/z 1306 and a weak
signal 16Da higher.
It is evident from the discussions above that mass spectrometric method in
combination with enzymatic digestion offers a convenient approach to the
characterization of GM-CSF and its variants. ESI-MS method demonstrated
a mass accuracy of better than 0.01% for a recombinant protein. The mass
spectral data of the enzymatic digest of GM-CSF and its variants allow the
precise determination of the molecular weights of the peptides, leading to the
identification of sites of covalent modifications, the disulfide bonding pattern,
and confirmation of the cDNA-derived sequence of the protein.
19.3.1.2 rh-IFN-a-2b. Interferon α-2b (IFN-α-2b) is an E. coli recombi-
nant DNA-derived therapeutic protein that is used as an anticancer agent and
in the treatment of chronic hepatitis B and C [33]. It is a 165-amino acid
protein, containing four cysteines at positions 1, 29, 98, and 138. These four
cysteines form two disulfide bonds. Cysteine 1, the N-terminal amino acid, is
linked to cysteine 98; cysteine 29 is linked to cysteine 138 (Figure 19-5). The
molecular weight of IFN-α-2b is calculated to be 19,265Da from its cDNA
amino acid sequence [34]. The sequence and disulfide mapping of IFN-α-2b
has been successfully carried out using the same peptide mass mapping
method as described in the case of rh-GM-CSF—for example, enzymatic
digestion with trypsin on purified protein and mass analysis of digested peptide
mixtures [35].
It is not unusual that the E. coli expression of IFN-α-2b produces several
isoforms in addition to the target protein, as shown in its reversed-phase
APPLICATIONS FOR BIOTECHNOLOGY PRODUCTS AND DRUG TARGETS 851
HPLC chromatogram (Figure 19-6). Two of the three isoforms, Iso-2 and Iso-
3,
were predicted to be incorrectly folded forms of the target protein with
scrambled disulfides.The third isoform, Iso-4, was thought to be reduced IFN-
α-2b containing four free cysteine sulfhydryls (SH). The level of Iso-4 was
observed to decrease during the purification process,suggesting that Iso-4 may
refold back to IFN-α-2b. Earlier RP-HPLC data provided experimental evi-
dence that IFN-α-2b could be reduced with DTT to Iso-4, and Iso-4 might be
re-oxidized to IFN-α-2b. In addition to these isoforms, a fourth component, a
variant of IFN-α-2b, was detected either co-eluting with or as a small shoul-
der eluting in front of the target protein peak (peak 1). The separation of this
shoulder peak from IFN-α-2b depended on the HPLC column load; for
example,better separation was obtained with lower column loads as illustrated
in Figure 19-7. The exact structures of these isoforms and the variant of
IFN-α-2b can only be obtained using mass spectrometry in conjunction with
RP-HPLC.
The initial studies was carried out using on-line RP-HPLC coupled with a
single quadrupole ESI-MS to measure the molecular weights of IFN-α-2b
components. The mass spectrum showed that other than IFN-α-2b, peak 1 in
Figure 19-7c contained a protein with a MW of 19,281Da that was 16Da
higher than the predicted MW of 19,265Da for IFN-α-2b. This higher mass
component corresponds to oxidation of one of the five methionine amino acids
present in IFN-α-2b. The oxidation of a methionine is also indicated by the
fact that this component elutes earlier than the parent protein. It is well known
852 LC/MS ANALYSIS OF PROTEINS AND PEPTIDES IN DRUG DISCOVERY
Figure 19-5. Amino acid sequence of rh-IFN-α-2b.
that proteins containing an oxidized methionine are more hydrophilic and
they tend to elute earlier on RP-HPLC than the parent protein [36,
37]. This
oxidized variant is present at approximately <2% by HPLC peak area nor-
malization. The dynamic range of the mass spectrometer was large enough to
detect the presence of this variant as well as the more abundant IFN-α-2b,
even at more diluted column loads as shown in Figure 19-7.
HPLC peaks 2 and 3 in Figure 19-6 corresponded to the predicted scram-
bled disulfides of IFN-α-2b, Iso-2 and Iso-3. They were expected to have the
same MW of 19,265Da as that of IFN-α-2b (peak 1). However, the measured
MWs were found to be different from those predicted for an incorrectly folded
form of IFN-α-2b. The determined MW of Iso-2 (M
r
= 19,310Da) was 45Da
APPLICATIONS FOR BIOTECHNOLOGY PRODUCTS AND DRUG TARGETS 853
Figure 19-6. RP-HPLC chromatographic profile of an “in-process” sample from E. coli
recombinant DNA derived IFN-α-2b. Peak 1 is IFN-α-2b. Isoform peak 2 and 3 are
putative scrambled disulfides. Isoform peak 4 is a putative open disulfide. The HPLC
was run under a linear gradient of 49–65% B (10: 90 H
2
O:CH
3
CN/0.1% TFA) over 24
minutes with the UV set at 214nm. The mobile phase A was water with 0.1% TFA and
the flow rate was set at 0.2mL/min. The column used was Vydac C8 column at 30°C
(2.1mm × 50mm, 5 µm, 300Å).
higher than that of IFN-α-2b
. This increased mass suggests the possibility of
acetylation of the N-terminus of the reduced target protein since the acetyl
group, CH
3
CO—, corresponds to a mass addition of 42Da. The MW of Iso-3
(M
r
= 19,643) was 378Da higher than that of IFN-α-2b.The protein MW infor-
mation obtained from MS studies indicated that neither peak 2 nor peak 3
corresponded to the postulated scrambled disulfides of IFN-α-2b. They are
most likely to be post-translationally modified IFN-α-2b.
HPLC peak 4, Iso-4, in Figure 19-6 corresponded to the putative reduced
IFN-α-2b containing four free cysteine sulfhydryls (M
r
= 19,269Da). It was
expected to have an MW that was 4Da higher than that of the target protein.
The mass spectrum of peak 4 revealed that this symmetrical HPLC peak actu-
ally consisted of two co-eluting components. The MW of one of the compo-
854 LC/MS ANALYSIS OF PROTEINS AND PEPTIDES IN DRUG DISCOVERY
Figure 19-7. RP-HPLC chromatograms showing dependence of the early eluting
variant, peak A, on column load. (a) Peak A and peak 1 resolved with a column load
of 3µg of proteins. (b) Peak A and peak 1 partially resolved with a column load of
∼6µg of proteins.(c) Peak A and peak 1 co-eluting with a column load of ∼15µg of protein.
nents, at 19,269 Da, corresponded to the reduced IFN-α-2b
, that is, the pre-
dicted Iso-4. However, the MW of the second component, at 19,336Da, is
71Da higher than that of the target protein. No obvious post-translational
modification could be proposed.
The above approach using RP-HPLC/ESI-MS to determine the MW of the
isoforms is a powerful tool in monitoring the production process of IFN-α-2b.
It provided insight into the potential structures of two of the four isoforms
and the variant that were present at various stages in the production of the
target protein. However, the structure and the identification of the post-
translational modifications in Iso-2, Iso-3, and Iso-4 could not be determined
solely based on this approach. To fully characterize the post-translational
modifications, individual isoforms were isolated from an early step in the
purification of IFN-α-2b, followed by extensive MS characterization.This was
demonstrated in the case of Iso-4.
The first step was to verify the MW of the isolated protein Iso-4 using triple
quadrupole ESI-MS. The MW of isolated Iso-4 was found to be 72Da higher
than that expected for IFN-α-2b. The next step involved RP-HPLC/ESI-MS
analysis of tryptic digests of the control IFN α-2b and IFN Iso-4 in order to
identify the nature of the modification. The peptide mass mapping results are
displayed in Figure 19-8 and Table 19-4. Comparison of the ESI-MS peptide
maps of the two proteins shows differences in the N-terminal peptide frag-
ments. The N-terminal peptide fragment of IFN-α-2b, T
1
(
1
CDLPQTH
SLGSR
12
), is linked with peptide T
10
(or T
9,10
and T
9,10,11
) through the disulfide
bond formed between Cys-1 and Cys-98. These disulfide-linked peptide frag-
ments—for example, T
1
-ss-T
10
(m/z 4617)—were largely absent in the Iso-4
digest shown in Figure 19-8b. Instead, the Iso-4 tryptic peptide map revealed
two new peptide fragments at m/z 1314 and 1384, respectively. These peptide
fragments corresponded to the N-terminal peptide fragment T
1
and T
1
+
70Da. The mass difference of 70Da in these peptide fragments is in agreement
with the mass difference (70Da) between Iso-4 and IFN-α-2b when the mass
increase of 2Da resulted from reduction of the disulfide bond is considered.
The amino acid sequence of the modified peptide and the site of the mod-
ification in Iso-4 was further determined by RP-HPLC/ESI-MS/MS studies of
the doubly charged molecular ions of the T
1
(m/z 658) and the T
1
+ 70Da (m/z
693) peptides (Figure 19-9).Tandem MS data of the doubly charged ion for T
1
+ 70 demonstrated that the peptide fragment was indeed the N-terminal
tryptic peptide fragment, T
1
, of IFN-α-2b with a 70-Da modification group
residing on the N-terminal cysteine. The observation of the more prominent
N-terminal fragment ions of the modified T
1
peptide, which were shifted by
26Da compared with those of the T
1
peptide of IFN-α-2b, implied a rapid loss
of 44Da (CO
2
). This suggested that a labile carboxyl group could be a part of
the 70-Da modification moiety. This assumption was further confirmed by
observation of the loss of 44Da from T
1
+ 70 using a higher orifice potential
(80V) for peptide mass mapping of Iso 4 using MS. No such loss was detected
for T
1
peptide under the same orifice condition. Product ion spectrum of the
APPLICATIONS FOR BIOTECHNOLOGY PRODUCTS AND DRUG TARGETS 855
doubly charged ion of T
1
+ 26,
generated from the high orifice ESI-MS exper-
iment, exhibited the N-terminal fragment ions of b
2
+ 26, b
3
+ 26, and a
2
+ 26.
As expected, the second series of fragment ions—that is, b
2
+ 70, b
3
+ 70, and
a
2
+ 70—were absent.
The elemental composition of the 70-Da post-translational modification
group was determined by accurate mass measurement using high-resolution
856 LC/MS ANALYSIS OF PROTEINS AND PEPTIDES IN DRUG DISCOVERY
Figure 19-8. Peptide mass mapping by RP-HPLC/ESI-MS.(a) Total ion chromatogram
(TIC) of the trypsin digested IFN-α-2b showing the intact N-terminal peptide disul-
fide fragments,T
1
-ss-T
10
and T
1
-ss-T
9,10
. (b) TIC of the trypsin digested Iso-4 displaying
the absence of the intact N-terminal peptide disulfide fragments, T
1
-ss-T
10
and T
1
-ss-
T
9,10
, and the appearance of a T
1
+ 70 Da peptide fragment. The tryptic peptides was
first desalted with 5% mobile phase B (CH
3
CN/0.08% TFA), followed by a gradient
run on a Supelcosil LC-18-DB column (1mm × 300 mm, 100 Å) with a 5–95% B in 150
minutes (40µL/min with a mobile phase A: water with 0.1% TFA).
MALDI-TOF-MS. Clearly, the 70-Da modification group was a pyruvate
(C
3
H
2
O
2
).
Pyruvic acid (CH
3
COCOOH), like acetic acid (CH
3
COOH) and
other common acids, forms a strong amide bond through the carboxyl group
(C-1) with the N-terminal amine group in proteins [38, 39]. This amide bond
is generally stable to mild acidic and base conditions. However, the pyruvate
bond in Iso-4 appeared to be labile under mild acidic conditions. In addition,
the modification of the protein through C-1 of pyruvic acid is not likely to gen-
erate a labile carboxyl group in the modification moiety as observed in the
MS/MS studies. This information led to the hypothesis that the puruvation of
IFN Iso-4 involved a unique chemistry in which a ketimine link was likely
formed between C-2 of pyruvic acid and the N-terminal cysteine amino group.
This ketimine bond is reversible under mild acidic conditions as illustrated in
Figure 19-10. The absence of the disulfide bond between Cys-1 and Cys-98 in
Iso-4 favors formation of the cyclic pyruvate intermediate (B) rather than for-
mation of the ketimine (imine) intermediate (A). This hypothesis was con-
firmed by comparing the product ion spectrum of the T
1
peptide fragment of
the Iso-4 with that of a synthetically prepared T
1
peptide fragment that was
derivatized with pyruvic acid. The MS/MS analysis of this pyruvated synthetic
peptide generated the same fragmentation pattern as that of the N-terminal
tryptic peptide of Iso-4. The N-terminal fragment ion of b
2
+ 26 (m/z 245),
APPLICATIONS FOR BIOTECHNOLOGY PRODUCTS AND DRUG TARGETS 857
TABLE 19-4. Tryptic Peptide Fragments of IFN-a-2b
Cys-Asp-Leu-Pro-Gln-Thr-His-Ser-Leu-Gly-Ser-Arg-Arg-
T
1
→-T
2
-→
-Thr-Leu-Met-Leu-Leu-Ala-Gln-Met-Arg-Arg-
T
3
→-T
4
-→
-Ile-Ser-Leu-Phe-Ser-Cys-Leu-Lys-Asp-Arg-
T
5
→ T
6
→
-His-Asp-Phe-Gly-Phe-Pro-Gln-Glu-Glu-Phe-Gly-Asn-Gln-Phe-Gln-Lys-
T
7
→
Ala-Glu-Thr-Ile-Pro-Val-Leu-His-Glu-Met-Ile-Gln-Gln-Ile-Phe-Asn-Leu-Phe-Ser-
Thr-Lys-
T
8
-Asp-Ser-Ser-Ala-Ala-Trp-Asp-Glu-Thr-Leu-Leu-Asp-Lys-
T
9
-Phe-Tyr-Thr-Glu-Leu-Tyr-Gln-Gln-Leu-Asn-Asp-Leu-Glu-Ala-Cys-Val-Ile-Gln-Gly-
Val-Gly-Val-Thr-Glu-Thr-Pro-Leu-Met-Lys-
T
10
-Glu-Asp-Ser-Ile-Leu-Ala-Val-Arg-Lys- -Tyr-Phe-Gln-Arg- -Ile-Thr-Leu-Tyr-Leu-
Lys-
T
11
→T
12
T
13
T
14
-Glu-Lys-Lys- -Tyr-Ser-Pro-Cys-Ala-Trp-Glu-Val-Val-Arg- -Ala-Glu-Ile-Met-Arg-Ser
T
15
>-T
16
- T
17
-T
18
→
Phe-Ser-Leu-Ser-Thr-Asn-Leu-Gln-Glu-Ser-Leu-Arg- -Ser-Lys- -Glu
T
19
T
20
→ T
21
generated by MS/MS of T
1
+ 70 from Iso-4 and the synthetic peptide
, was
further dissociated in the ion trap mass spectrometer, producing fragment ions
at m/z 102 and 130 resulted from cleavage of CO—CH and the amide bond
of Cys-1, respectively.This multiple-stage MS analysis (MS
n
) further supported
the original hypothesis.
In addition, the DNPH (2,4-dinitrophenylhydrazine) [38] and NADH
(dihydronicotinamide adenine dinucleotide) [36] studies with purified
Iso-4 provided the evidence that the 70Da moiety was a pyruvate deri-
vative (C
3
H
2
O
2
). In the DNPH study, treatment of Iso-4 with acid and 2,4-
dinitrophenylhydrazine produced the 2,4-dinitrophenylhydrazone of the
pyruvic acid liberated from Iso-4. In the NADH study, the amount of NAD
+
858 LC/MS ANALYSIS OF PROTEINS AND PEPTIDES IN DRUG DISCOVERY
Figure 19-9. LC/ESI-MS/MS product ion mass spectra of the doubly charged ions of
the N-terminal tryptic peptide T
1
of (a) IFN-α-2b (m/z 658) and (b) Iso-4 (m/z 693).
N-terminal Cys-Asp was identified as the modified fragment.
produced is proportional to the amount of pyruvic acid liberated from the mild
acid hydrolysis of Iso-4.
These procedures were also applied to purified IFN-
α-2b as a control. The control experiments demonstrated that the pyruvate
derivative was the active component measured in the Iso-4 experiments.
To verify that Iso-4 was interconvertible with IFN-α-2b, a sample of puri-
fied Iso-4 was treated under mild acidic conditions in an attempt to convert
it to IFN-α-2b. The MW measurement of the converted protein by RP-
HPLC/ESI-MS confirmed that Iso-4 could be converted to IFN-α-2b under
mild acidic conditions. Furthermore, the IFN-α-2b obtained from the conver-
sion of Iso-4 was enzymatically digested with trypsin and studied by RP-
HPLC/ESI-MS to assess the status of disulfide bonds.The presence of the two
disulfide-bonded peptide fragments, T
1
-ss-T
10
and T
5
-ss-T
17
, revealed the
correctly folded IFN-α-2b.
The other isoforms, Iso-2 and Iso-3, expressed in the E. coli fermentation
of IFN-α-2b, were characterized using a similar approach. The isolated Iso-2
and Iso-3 were enzymatically digested with trypsin, and the resulted peptide
mixtures were mass-mapped using RP-HPLC/ESI-MS. The results indicated
that Iso-2 was a correctly folded IFN-α-2b acetylated on the amino group of
the N-terminal cysteine. Iso-3 was similarly determined to be a glutathionated
form (Cys-98) of the partially reduced IFN-α-2b that was pyruvated on the
N-terminal cysteine. The complete structures for IFN-α-2b, Iso-2, Iso-3, and
Iso-4 are shown in Figure 19-11.
APPLICATIONS FOR BIOTECHNOLOGY PRODUCTS AND DRUG TARGETS 859
Figure 19-10. The pyruvate formation with the N-terminal cysteine. The C-2 carbonyl
in pyruvic acid initially forms a ketimine intermediate (A). The sulfhydryl (SH) group
of Cys-1 generated from the reduced cysteine 1–98 disulfide bond in Iso-4 tends to
favor the formation of the more thermodynamically stable cyclic thiazolidine pyruvate
intermediate (B).
The pyruvic modification of the N-terminal cysteine of E.
coli derived
recombinant IFN-α-2b via a ketimine linkage has not been reported previ-
ously. There were only two cases in the literature that involved the ketimine
formation of the pyruvic acid C-2 carbonyl group and the amino group of the
N-terminal cysteine amino acid, including the post-translational modification
of the Ner protein of the bacteriophage Mu [38] and the β-chain of hemoglo-
bin A
1b
[39] with pyruvic acid. The chemistry of pyruvic acid attachment to
Iso-4 from this study has a significant impact on the production of IFN-α-2b.
It led to the development of a reproducible conversion procedure from Iso-4
to IFN-α-2b in the production process,resulting in a five- to sevenfold increase
in the production yield.
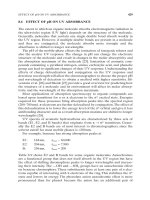
19.3.2 Protein Glycosylation and Phosphorylation
19.3.2.1 Glycosylation. Carbohydrate modifications of proteins (glycosyla-
tion) are key factors in modulating protein structures and functions within
cells. Glycosylation affects probably more than half of all proteins in a eukary-
otic cell [40]. In the extracellular environment, the oligosaccharide moieties of
860 LC/MS ANALYSIS OF PROTEINS AND PEPTIDES IN DRUG DISCOVERY
Figure 19-11. The structures of IFN-α-2b and its three isoforms, Iso-2, Iso-3, and Iso-4.
The solid line indicates the disulfide bond formation, while the dashed line indicates
the reduced disulfide bond or partial disulfide bond formation.
glycoproteins are implicated in a wide range of cell–cell and cell–matrix recog-
nition events which exert effects on cellular recognition in infection,
cancer,
and immune response.There are many instances where glycan structures have
been shown to have significant importance in the biological function of a
protein. For example, glycosylation of Asn-319 on rabies virus glycoprotein is
essential for the secretion of soluble rabies virus glycoprotein [41]. Changes
in levels and types of glycosylation can be associated with disease. It has been
illustrated that detecting changes in glycan structure may be used as a diag-
nostic for aggressive breast cancer [42]. Glycan profiling of normal and dis-
eased forms of a glycoprotein has provided new insights for future research
in rheumatoid arthritis, prion disease, and congenital disorders of glycosyla-
tion [43–47]. In all these diseases, differences in glycosylation indicate that
there are cellular or genetic changes that affect the activity of specific glyco-
transferases. Glycosylation also represents the most common modification for
recombinant protein products expressed in mammalian and insect cell lines.
Carbohydrate modifications of recombinant proteins have significant impacts
on their solubility, immunogenicity, resistance to proteolysis, circulatory half-
life, and thermal stability, all of which will affect the use of the recombinant
proteins as therapeutic entities or as drug targets.The important roles that gly-
coproteins play in biology and medicine have stimulated a rapid expansion of
the field of glycobiology and brought up the need to develop rapid and accu-
rate analytical methods to characterize the glycoproteins.
Glycosylation occurs in the endoplasmic reticulum (ER) and Golgi
compartments of the cell and the reactions are catalyzed by membrane-bound
glycotransferases and glycosidases [48, 49].All mammalian N-linked oligosac-
charides share a common trimannosyl core Man
3
GlcNAc
2
derived from a
biosynthetic precursor Glc
3
Man
9
GlcNAc
2
that is added cotranslationally to
polypeptides in the ER. There are three types of N-linked oligosaccharides:
high mannose-type, complex-type, and hybrid-type. For N-linked glycopro-
tein, the attachment of glycan structures to proteins usually occurs at an
Asn-Xaa-Ser/Thr consensus. Xaa may be any amino acid except proline.
O-oligosaccharide biosynthesis is initiated in the Golgi by the addition of a
single sugar to serine or threonine.There are at least seven O-linked oligosac-
charide core structures, four of which are particularly widespread in mam-
malian glycoproteins [49].
Carbohydrates are polymers with a wide diversity of glycan structures
which comes from the variation in the type, number, and position of individ-
ual sugar residues,the degree of branching,and the level of acetylation,methy-
lation, sialylation, phosphorylation, and sulfation. The populations of sugars
attached to an individual protein will depend on the cell type in which the gly-
coprotein is expressed and on the physiological status of the cell, and they may
be developmentally and disease-regulated. A glycoprotein usually exists as
complex mixtures of glycosylated variants (glycoforms) due to (a) the diver-
sity of oligosaccharides attached to the glycoprotein and (b) the occupancy of
each glycosylation site. Complete structural characterization of a glycoprotein
APPLICATIONS FOR BIOTECHNOLOGY PRODUCTS AND DRUG TARGETS 861