Tài liệu 44 Speech Production Models and Their Digital Implementations ppt
Bạn đang xem bản rút gọn của tài liệu. Xem và tải ngay bản đầy đủ của tài liệu tại đây (410.33 KB, 22 trang )
Sondhi, M.M. & Schroeter, J. “Speech Production Models and Their Digital Implementations”
Digital Signal Processing Handbook
Ed. Vijay K. Madisetti and Douglas B. Williams
Boca Raton: CRC Press LLC, 1999
c
1999byCRCPressLLC
44
Speech Production Models and
Their Digital Implementations
M. Mohan Sondhi
Bell Laboratories
Lucent Technologies
Juergen Schroeter
AT&T Labs — Research
44.1 Introduction
Speech Sounds
•
Speech Displays
44.2 Geometry of theVocal andNasal Tracts
44.3 Acoustical Properties of theVocal andNasal Tracts
Simplifying Assumptions
•
Wave Propagation in the Vocal
Tract
•
The Lossless Case
•
Inclusion of Losses
•
Chain Ma-
trices
•
Nasal Coupling
44.4 Sources of Excitation
Periodic Excitation
•
Turbulent Excitation
•
Transient Excita-
tion
44.5 Digital Implementations
Specification of Parameters
•
Synthesis
References
44.1 Introduction
The characteristics of a speech signal that are exploited for various applications of speech signal
processing to be discussed later in this section on speech processing (e.g., coding, recognition, etc.)
arise from the properties and constraints of the human vocal apparatus. It is, therefore, useful in
the design of such applications to have some familiarity with the process of speech generation by
humans. In this chapterwewillintroducethereader to(1)thebasicphysical phenomenainvolvedin
speech production, (2) the simplified models used to quantify these phenomena, and (3) the digital
implementations of these models.
44.1.1 Speech Sounds
Speech is produced by acoustically exciting a time-varying cavity — the vocal tract, which is the
region of the mouth cavity bounded by the vocal cords and the lips. The various speech sounds are
produced by adjusting both the ty pe of excitation as well as the shape of the vocal tract.
There are several ways of classifying speech sounds [1]. Onewayis to classify them on the basis of
the type of excitation used in producing them:
• Voiced soundsare producedby exciting the tract byquasi-periodic puffs of air produced
by the vibration of the vocal cords in the larynx. The vibrating cords modulate the air
stream from the lungs at a rate which may be as low as 60 times per second for some
c
1999 by CRC Press LLC
males to as high as 400 or 500 times per second for children. All vowels are produced in
this manner. So are laterals, of which l is the only exemplar in English.
• Nasal sounds such as m, n,ng, and nasalized vowels(as in the French wordbon) are also
voiced. However, part or all of the airflow is diverted into the nasal t ract by opening the
velum.
• Plosive sounds are produced by exciting the tract by a sudden release of pressure. The
plosivesp,t,karevoiceless, whileb,d,garevoiced. Thevocal cordsstartvibratingbefore
the release for the voiced plosives.
• Fricativesareproducedbyexcitingthetractbyturbulentflowcreatedbyairflowthrough
a narrow constriction. The sounds f,s,sh belong to this category.
• Voicedfricativesareproduced by excitingthetract simultaneously by turbulenceand by
vocal cord vibration. Examples are v, z, and zh (as in pleasure).
• Affricates are sounds that begin as a stop and are released as a fricative. In English, ch as
in check is a voiceless affricate and j as in John is a voiced affricate.
In addition to controlling the type of excitation, the shape of the vocal tract is also adjusted by
manipulating the tongue, lips, and lower jaw. The shape determines the frequency response of the
vocal tract. The frequency response at any g iven frequency is defined to be the amplitude and phase
at the lips in response to a sinusoidal excitation of unit amplitude and zero phase at the source.
The frequency response, in general, shows concentration of energy in the neighborhood of certain
frequencies, called formantfrequencies.
For vowel sounds, three or four resonances can usually be distinguished clearly in the frequency
range 0 to 4 kHz. (On average, over 99% of the energy in a speech signal is in this frequency range.)
The configuration of these resonance frequencies is what distinguishes different vowels from each
other.
Forfricatives and plosives, the resonances are not as prominent. However, there are characteristic
broad frequency regions where the energy is concentrated.
For nasal sounds, besides formants there are anti-resonances, or zeros in the frequency response.
These zeros are the result of the coupling of the wave motion in the vocal and nasal tracts. We will
discuss how they arise in a later section.
44.1.2 Speech Displays
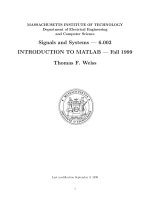
Weclosethissectionwithadescriptionofthevariouswaysofdisplayingpropertiesofaspeechsignal.
The three common displays are (1) the pressurewaveform, (2) the spectrogram, and (3) the power
spectrum. These are illustrated for a typical speech signal in Figs. 44.1a–c.
Figure 44.1a shows about half a second of a speech signal produced by a male speaker. What is
shown is the pressure waveform (i.e., pressure as a function of time) as picked up by a microphone
placedafewcentimetersfromthelips. Thesharpclickproducedataplosive, thenoise-likecharacter
of a fricative, and the quasi-per iodic waveform of a vowel are all clearly discernible.
Figure 44.1b shows another useful display of the same speech signal. Such a display is known as a
spectrogram [2]. Here the x-axis is time. But the y-axis is frequency and the darkness indicates the
intensity at a given frequency at a given time. [The intensit y at a time t and frequency f is just the
power in the signal averaged over a small region of the time-frequency plane centered at the point
(t, f )]. The dark bands seen in the vowel region are the formants. Note how the energy is much
more diffusely spread out in frequency during a plosive or fricative.
Finally, Fig. 44.1c showsathirdrepresentationofthesamesignal. Itiscalledthepowerspectrum.
Here the power is plotted as a function of frequency, for a short segment of speech surrounding a
specified time instant. A logarithmic scale is used for power and a linear scale for frequency. In
c
1999 by CRC Press LLC
FIGURE 44.1: Display of speech signal: (a)waveform, (b) spectrogram, and (c) frequency response.
this particular plot, the power is computed as the average over a window of duration 20 msec. As
indicated in the figure, this spectrum was computed in a voiced portion of the speech signal. The
regularlyspacedpeaks—thefinestructure—inthespectrumaretheharmonicsofthefundamental
frequency. The spacing is seen to be about 100 Hz, which checks with the time period of the wave
seen in the pressure waveformin Fig. 44.1a. Thepeaksin the envelope of the harmonic peaks are the
formants. These occur at about 650, 1100, 1900, and 3200 Hz, which checks with the positions of
the formants seen in the spectrogram of the same signal displayed in Fig. 44.1b.
44.2 Geometry of the Vocal and Nasal Tracts
Much of our knowledge of the dimensions and shapes of the vocal tract is derived from a study of
x-ray photographs and x-ray movies of the vocal tract taken while subjects utter various specific
speech sounds or connected speech [3]. In order to keep x-ray dosage to a minimum, only one view
is photographed, and this is invariably the side view (a view of the mid-sagittal plane). Information
aboutthecross-dimensionsisinferredfromstaticvocaltractsusingfrontalXrays,dentalmolds, etc.
More recently, Magnetic Resonance Imaging (MRI) [4] has also been used to image the vocal and
nasal tracts. The images obtained by this technique are excellent and provide three-dimensional
c
1999 by CRC Press LLC
reconstructions of the vocal tract. However, at present MRI is not capable of providing images at a
rate fast enough for studying vocal tracts in motion.
Other techniques have also been used to study vocal tract shapes. These include:
(1) ultrasound imaging [5]. This provides information concerning the shape of the tongue but
not about the shape of the vocal cavity.
(2)Acousticalprobingofthevocaltract[6]. Inthistechnique,aknownacousticwaveisappliedat
thelips. Theshapeofthetime-varyingvocalcavitycanbeinferredfromtheshapeofthetime-varying
reflectedwave. However,thistechniquehasthusfarnotachievedsufficientaccuracy. Also,itrequires
the vocal tract to be somewhat constrained while the measurements are made.
(3) Electropalatography [7]. In this technique, an artificial palate with an array of electrodes is
placedagainstthehardpalateofasubject. Asthetonguemakescontactwiththispalateduringspeech
production,it closes an electrical connectiontosome of the electrodes. Thepattern of closuresgives
an estimate of the shape of the contact between tongue and palate. This technique cannot provide
details of the shape of the vocal cavity, although it yields important information on the production
of consonants.
(4) Finally, the movementofthe tongueand lips has also been studied bytracking the positions of
tiny coils attached to them [8]. The motion of the coils is tracked by the currents induced in them
as they move in externally applied electromagnetic fields. Again, this technique cannot provide a
detailed shape of the vocal tract.
Figure 44.2 shows an x-ray photograph of a female vocal tract uttering the vowel sound /u/. It is
seen that the vocal tract has a very complicated shape, and without some simplifications it would be
very difficult to just specify the shape, let alone compute its acoustical properties. Several models
have been proposed to specify the main features of the vocal tract shape. These models are based
on studies of x-ray photographs of the type shown in Fig. 44.2, as well as on x-ray movies taken of
subjects uttering various speechmaterials. Suchmodelsarecalled articulatorymodelsbecausethey
specify the shape in terms of the positions of the articulators (i.e., thetongue,lips, jaw, and velum).
Figure 44.3 shows such an idealization, similar to one proposed by Coker [9], of the shape of the
vocaltract in the mid-sagittal plane. In this model, a fixed shape is used for the palate, and the shape
of the vocal cavity is adjusted by specifying the positions of the articulators. Thecoordinatesused to
describe the shape are labeled in the figure. They are the position of the tongue center, the radius of
the tongue body, the position of the tongue tip, the jawopening, the lip opening and protrusion, the
position of the hyoid, and the opening of the velum. The cross-dimensions (i.e., perpendicular to
the sagittal plane) are estimated from static vocaltracts. Thesedimensions are assumed fixed during
speech production. In this manner, the three-dimensional shape of the vocal tract is modeled.
Wheneverthevelum is open,thenasalcavity iscoupledtothevocal tract,anditsdimensionsmust
also be specified. The nasal cavity is assumed to have a fixed shape which is estimated from static
measurements.
44.3 Acoustical Proper ties of the Vocal and Nasal Tracts
Exact computation of the acoustical properties of the vocal (and nasal) tract is difficult even for the
idealized models described in the previous section. Fortunately, considerable further simplification
can be made without affecting most of the salient properties of speech signals generated by such a
model. Almostwithoutexception,threeassumptionsaremadetokeep the problem tractable. These
assumptions are justifiable for frequencies below about 4 kHz [10, 11].
c
1999 by CRC Press LLC
FIGURE 44.2: X-ray side view of a female vocal tract. The tongue, lips, and palate have been
outlined to improve visibility. (Source: Modified from a single frame from “Laval Film 55,” Side 2
of Munhall, K.G., Vatikiotis-Bateson, E., Tohkura, Y., X-r ay film data-base for speech research, ATR
Technical Report Tr-H-116, 12/28/94, ATR Human Information Processing Research Laboratories,
Kyoto, Japan. With permission from Dr. Claude Rochette, Departement de Radiolog ie de l’Hotel-
Dieu de Quebec, Quebec, Canada.)
44.3.1 Simplifying Assumptions
1. It is assumed that the vocal tract can be “straightened out” insuchawaythatacenter
line drawn through the tract (shown dotted in Fig. 44.3) becomes a straight line. In this
way, the tract is converted to a straight tube with a variable cross-section.
2. Wavepropagationinthestraightenedtractisassumedtobeplanar. Thismeansthatifwe
consider any plane perpendicular to the axis of the tract, then ever y quantity associated
with the acoustic wave (e.g., pressure, density, etc.) is independent of position in the
plane.
3. Thethirdassumptionthatis invariablymadeisthat wavepropagationinthevocal tract is
linear. Nonlinear effects appear when the ratio of particle velocity tosound velocity (the
Machnumber)becomeslarge. ForwavepropagationinthevocaltracttheMachnumber
is usually less than .02, so that nonlinearity of the waveis negligible. There are, however,
two exceptions to this. The flow in the glottis (i.e., the space between the vocal folds),
and that in the narrow constrictions used to produce fricative sounds, is nonlinear. We
will showlaterhowthese special cases arehandled in currentspeechproductionmodels.
c
1999 by CRC Press LLC
FIGURE 44.3: An idealized articulatory model similar to that of Coker [9].
Weoughttopointoutthat somecomputationshavebeenmadewithoutthefirsttwo assumptions,
andwave phenomena studiedintwoorthree dimensions[12]. Recentlytherehasbeensomeinterest
in removing the third assumption as well [13]. This involves the solution of the so called Navier-
Stokes equation in the complicated three-dimensional geometry of the vocal tract. Such analyses
require very large amounts of high speed computations making it difficult to use them in speech
production models. Computational cost and speed, however, are not the only limiting factors. An
even more basic barrier is that it is difficult to specify accuratelythe complicated time-varying shape
of the vocal tract. It is, therefore, unlikely that such computations can be used directly in a speech
productionmodel. Thesecomputationsshould,however,provideaccuratedataonthebasisofwhich
simpler, more tractable, approximations may b e abstracted.
44.3.2 Wave Propagation in the Vocal Tract
In view of the assumptions discussed above, the propagation of waves in the vocal tract can be
consideredinthesimplifiedsettingdepictedinFig.44.4. Asshownthere,thevocalt ractisrepresented
as a variable areatube of length L with its axis takentobe the x−axis. Theglottis is located at x = 0
andthelipsatx = L,andthetubehasacross-sectionalarea A(x) whichisafunctionofthedistance
x from the glottis. Strictly speaking, of course, the area is time-varying. However, in normal speech
FIGURE 44.4: The vocal tract as a variable area tube.
the temporal variation in the area is very slow in comparison with the propagation phenomena that
we are considering. So, the cross-sectional area may be represented by a succession of stationary
shapes.
c
1999 by CRC Press LLC
Weareinterestedinthespatialandtemporalvariationoftwointerrelatedquantitiesintheacoustic
wave: the pressure p(x, t) and the volume velocity u(x, t). The latter is A(x)v(x, t),wherev is the
particle velocity. For the assumption of linearity to be valid, the pressure p in the acoustic wave is
assumed to be small comparedtothe equilibrium pressure P
0
, and the particle velocity v isassumed
to be small compared to the velocity of sound, c. Two equations can be written down that relate
p(x, t) and u(x, t): the equation of motion and the equation of continuity [14]. A combination of
these equations will give us the basic equation of wave propagation in the variable area tube. Let us
derive these equations first for the case when the walls of the tube are rigid and there are no losses
due to viscous friction, thermal conduction, etc.
44.3.3 The Lossless Case
The equation of motion is just a statement of Newton’s second law. Consider the thin slice of air
between the planes at x and x + dx shown in Fig. 44.4. By equating the net force acting on it due to
the pressure gradient to the rate of change of momentum one gets
∂p
∂x
=−
ρ
A
∂u
∂t
(44.1)
(To simplify notation, we will not always explicitly show the dependence of quantities on x andt.)
The equation of continuity expresses conserv ation of mass. Consider the slice of tube between x
andx +dx showninFig.44.4. Bybalancingthenetflowofairoutofthisregionwithacorresponding
decrease in the density of air we get
∂u
∂x
=−
A
ρ
∂δ
∂t
.
(44.2)
where δ(x,t) is the fluctuation in density superposed on the equilibrium density ρ. The density is
related to pressure by the gas law. It can be shown that pressure fluctuations in an acoustic wave
follow the adiabatic law, so that p = (γ P /ρ)δ,whereγ is the ratio of specific heats at constant
pressure and constant volume. Also, (γ P /ρ) = c
2
,wherec is the velocity of sound. Substituting
this into Eq. (44.2)gives
∂u
∂x
=−
A
ρc
2
∂p
∂t
(44.3)
Equations (44.1) and (44.3) are the two relations between p and u that we set out to derive. From
these equations it is possible to eliminate u by subtracting
∂
∂t
of Eq. (44.3)from
∂
∂x
of Eq. (44.1).
This gives
∂
∂x
A
∂p
∂x
=
A
c
2
∂
2
p
∂t
2
. (44.4)
Equation (44.4) is know n in the literature as Webster’s horn equation [15]. It was first derived for
computations of wave propagation in horns, hence the name. By eliminating p from Eqs. (44.1)
and (44.3), one can also derive a single equation in u.
Itisusefulto writeEqs.(44.1),(44.3),and(44.4)inthefrequency domainbytakingLaplace trans-
forms. Defining P(x,s) and U(x,s) as the Laplace transforms of p(x, t) and u(x, t), respectively,
and remembering that
∂
∂t
→ s,weget:
dP
dx
=−
ρs
A
U
(44.1a)
c
1999 by CRC Press LLC
dU
dx
=−
sA
ρc
2
Pψ (44.3a)
and
d
dx
A
dP
dx
=
s
2
c
2
APψ (44.4a)
Itisimportanttonotethatinderivingtheseequationswehaveretainedonlyfirstordertermsinthe
fluctuatingquantitiespandu.Inclusionofhigherordertermsgivesrisetononlinearequationsof
propagation.Byandlargethesetermsarequitenegligibleforwavepropagationinthevocaltract.
However,thereisonesecondorderterm,neglectedinEq.(44.1),whichbecomesimportantinthe
descriptionofflowthroughthenarrowconstrictionoftheglottis.InderivingEq.(44.1)weneglected
thefactthatthesliceofairtowhichtheforceisappliedismovingawaywiththevelocityv.When
thiseffectiscorrectlytakenintoaccount,itturnsoutthatthereisanadditionaltermρv
∂v
∂x
appearing
onthelefthandsideofthatequation.ThecorrectedformofEq.(44.1)is
∂
∂x
p+
ρ
2
(
u/A
)
2
=−ρ
d
dt
u
A
.ψ
(44.5)
Thequantity
ρ
2
(u/A)
2
hasthedimensionsofpressure,andisknownastheBernoullipressure.We
willhaveoccasiontouseEq.(44.5)whenwediscussthemotionofthevocalcordsinthesectionon
sourcesofexcitation.
44.3.4 InclusionofLosses
Theequationsderivedintheprevioussectioncanbeusedtoapproximatelyderivetheacoustical
propertiesofthevocaltract.However,theiraccuracycanbeconsiderablyincreasedbyincluding
termsthatapproximatelytakeaccountoftheeffectofviscousfriction,thermalconduction,and
yieldingwalls[16].Itismostconvenienttointroducetheseeffectsinthefrequencydomain.
Theeffectofviscousfrictioncanbeapproximatedbymodifyingtheequationofmotion,Eq.(44.1a)
asfollows:
dP
dx
=−
ρs
A
U−R(x,s)U.ψ
(44.6)
RecallthatEq.(44.1a)statesthattheforceappliedperunitareaequalstherateofchangeofmo-
mentumperunitarea.TheaddedterminEq.(44.6)representstheviscousdragwhichreducesthe
forceavailabletoacceleratetheair.Theassumptionthatthedragisproportionaltovelocitycanbe
approximatelyvalidated.ThedependenceofRonxandscanbemodeledinvariousways[16].
Theeffectofthermalconductionandyieldingwallscanbeapproximatedbymodifyingtheequation
ofcontinuityasfollows:
ρ
dU
dx
=−
A
c
2
sP−Y(x,s)Pψ (44.7)
RecallthatthelefthandsideofEq.(44.3a)representsnetoutflowofairinthelongitudinaldirection,
whichisbalancedbyanappropriatedecreaseinthedensityofair.ThetermaddedinEq.(44.7)
representsnetoutwardvolumevelocityintothewallsofthevocaltract.Thisvelocityarisesfrom
(1)atemperaturegradientperpendiculartothewallswhichisduetothethermalconductionbythe
walls,and(2)duetotheyieldingofthewalls.Boththeseeffectscanbeaccountedforbyappropriate
choiceofthefunctionY(x,s),providedthewallscanbeassumedtobelocallyreacting.Bythatwe
meanthatthemotionofthewallatanypointdependsonthepressureatthatpointalone.Models
forthefunctionY(x,s)maybefoundin[16].
c
1999byCRCPressLLC
Finally,thelossyequivalentofEq.(44.4a)is
d
dx
A
ρs+AR
dP
dx
=
As
ρc
2
+Y
P.ψ (44.8)
44.3.5 ChainMatrices
AllpropertiesoflinearwavepropagationinthevocaltractcanbederivedfromEqs.(44.1a),(44.3a),
(44.4a)orthecorrespondingEqs.(44.6),(44.7),and(44.8)forthelossytract.Themostconvenient
waytoderivethesepropertiesisintermsofchainmatrices,whichwenowintroduce.
SinceEq.(44.8)isasecondorderlinearordinarydifferentialequation,itsgeneralsolutioncanbe
writtenasalinearcombinationoftwoindependentsolutions,sayφ(x,s)and(x,s).Thus
P(x,s)=aφ(x,s)+b(x,s)ψ
(44.9)
whereaandbare,ingeneral,functionsofs.Hence,thepressureattheinputofthetube(x=0)
andattheoutput(x=L)arelinearcombinationsofaandb.Thevolumevelocitycorresponding
tothepressuregiveninEq.(44.9)isobtainedfromEq.(44.6)tobe
U(x,s)=−
A
ρs+AR
[adφ/dx+bd/dx].ψ
(44.10)
Thus,theinputandoutputvolumevelocitiesareseentobelinearcombinationsofaandb.Eliminat-
ingtheparametersaandbfromtheserelationshipsshowsthattheinputpressureandvolumevelocity
arelinearcombinationsofthecorrespondingoutputquantities.Thus,therelationshipbetweenthe
inputandoutputquantitiesmayberepresentedintermsofa2×2matrixasfollows:
P
in
U
in
=
k
11
k
12
k
21
k
22
P
out
U
out
(44.11)
= K
P
out
U
out
.
ThematrixKiscalledachainmatrixorABCDmatrix[17].Itsentriesdependonthevaluesofφ
andatx=0andx=L.ForanarbitrarilyspecifiedareafunctionA(x)thefunctionsφand
ψ arehardtofind.However,forauniformtube,i.e.,atubeforwhichtheareaandthelossesare
independentofx,thesolutionsareveryeasy.Forauniformtube,Eq.(44.8)becomes
d
2
P
dx
2
=σ
2
Pψ (44.12)
whereσisafunctionofsgivenby
σ
2
=(ρs+AR)
s
ρc
2
+
Y
A
.
TwoindependentsolutionsofEq.(44.12)arewellknowntobecosh(σx)andsinh(σx),andabitof
algebrashowsthatthechainmatrixforthiscaseis
K=
cosh(σL)ψ (1/β)sinh(σL)
βsinh(σL)ψ cosh(σL)
(44.13)
where
β=
Y+
As
ρc
2
/
R+
ρs
A
.
c
1999byCRCPressLLC
Foranarbitrarytract,onecanutilizethesimplicityofthechainmatrixofauniformtubebyapprox-
imatingthetractasaconcatenationofNuniformsectionsoflength=L/N.Nowtheoutput
quantitiesoftheithsectionbecometheinputquantitiesforthei+1stsection.Therefore,ifK
i
isthe
chainmatrixfortheithsection,thenthechainmatrixforthevariable-areatractisapproximatedby
K=K
1
K
2
···K
N
.ψ (44.14)
Thismethodcan,ofcourse,beusedtorelatetheinput-outputquantitiesforanyportionofthetract,
notjusttheentirevocaltract.Laterweshallneedtofindtheinput-outputrelationsforvarious
sectionsofthetract,forexample,thetractfromtheglottistothevelumfornasalsounds,fromthe
narrowestconstrictiontothelipsforfricativesounds,etc.
Asstatedabove,alllinearpropertiesofthevocaltractcanbederivedintermsoftheentriesofthe
chainmatrix.Letusgiveseveralexamples.
Letusassociatetheinputwiththeglottalend,andtheoutputwiththelipendofthetract.Suppose
thetractisterminatedbytheradiationimpedanceZ
R
atthelips.Then,bydefinition,P
out
=Z
R
U
out
.
SubstitutingthisinEq.(44.11)gives
P
in
/U
out
U
in
/U
out
=
k
11
k
12
k
21
k
22
Z
R
1
.ψ
(44.15)
FromEq.(44.15)itfollowsthat
U
out
U
in
=
1
k
21
Z
R
+k
22
.ψ (44.16a)
Equation(44.16a)givesthetransferfunctionrelatingtheoutputvolumevelocitytotheinput
volumevelocity.MultiplyingthisbyZ
R
givesthetransferfunctionrelatingoutputpressuretothe
inputvolumevelocity.Othertransferfunctionsrelatingoutputpressureorvolumevelocitytoinput
pressuremaybesimilarlyderived.
Relationshipsbetweenpressureandvolumevelocityatasinglepointmayalsobederived.For
example,
P
in
U
in
=
k
11
Z
R
+k
12
k
21
Z
R
+k
22
(44.16b)
givestheinputimpedanceofthevocaltractasseenattheglottis,whenthelipsareterminatedby
theradiationimpedance.
Also,formantfrequencies,whichwementionedintheIntroduction,canbecomputedfromthe
transferfunctionofEq.(44.16a).Theyarejustthevaluesofsatwhichthedenominatoronthe
right-handsidebecomeszero.Foralossyvocaltract,thezerosarecomplexandhavetheform
s
n
=−α
n
+jω
n
,n=1,2,···.Thenω
n
isthefrequency(inrad/s)ofthenthformant,andα
n
isits
halfbandwidth.
Finally,thechainmatrixformulationalsoleadstolinearpredictioncoefficients(LPC),whichare
themostcommonlyusedrepresentationofspeechsignalstoday.Strictlyspeaking,therepresentation
isvalidforspeechsignalsforwhichtheexcitationsourceisattheglottis(i.e.,voicedoraspirated
speechsounds).Modificationsarerequiredwhenthesourceofexcitationisataninteriorpoint.
ToderivetheLPCformulation,wewillassumethevocaltracttobelossless,andtheradiation
impedanceatthelipstobezero.FromEq.(44.16a)weseethattocomputetheoutputvolume
velocityfromtheinputvolumevelocity,weneedonlythek
22
elementofthechainmatrixforthe
entirevocaltract.ThischainmatrixisobtainedbyaconcatenationofmatricesasshowninEq.(44.14).
c
1999byCRCPressLLC
TheindividualmatricesK
i
arederivedfromEq.(44.13),withN=L/.Inthelosslesscase,Rand
Yarezero,soσ=s/candβ=A/ρc.Also,ifwedefinez=e
2s/c
,thenthematrixK
i
becomes
K
i
=z
N/2
1
2
1+z
−1
A
i
2ρc
1−z
−1
ρc
2A
i
1−z
−1
1
2
1+z
−1
.ψ
(44.17)
Clearly,therefore,k
22
isz
N/2
timesanNthdegreepolynomialinz
−1
.Hence,Eq.(44.16a)canbe
writtenas
N
k=0
a
k
z
−k
U
out
=z
−N/2
U
in
.ψ (44.18)
wherea
k
arethecoefficientsofthepolynomial.Thefrequencydomainfactorz=e
−2s/c
represents
adelayof2/cs.Thus,thetimedomainequivalentofEq.(44.18)is
N
k=0
a
k
u
out
(t−2k/c)=u
in
(t−N/c).ψ (44.19)
Nowu
out
(t)isthevolumevelocityinthespeechsignal,sowewillcallits(t)forbrevity.Similarly,
sinceu
in
(t)istheinputsignalattheglottis,wewillcallitg(t).Togetthetime-sampledversion
ofEq.(44.19)wesett=2n/canddefines(2n/c)=s
n
andg((2n−N)/c)=g
n
.Then
Eq.(44.19)becomes
N
k=0
a
k
s
n−k
=ε
n
.ψ (44.20)
Equation(44.20)istheLPCrepresentationofaspeechsignal.
44.3.6 NasalCoupling
Nasalsoundsareproducedbyopeningthevelumandtherebycouplingthenasalcavitytothevocal
tract.Innasalconsonants,thevocaltractitselfisclosedatsomepointbetweenthevelumandthe
lips,andalltheairflowisdivertedintothenostrils.Innasalvowelsthevocaltractremainsopen.
(NasalvowelsarecommoninFrenchandseveralotherlanguages.Theyarenotnominallyphonemes
ofEnglish.However,somenasalizationofvowelscommonlyoccursinEnglishspeech.)
Intermsofchainmatrices,thenasalcouplingcanbehandledwithouttoomuchadditionaleffort.
Asfarasitsacousticalpropertiesareconcerned,thenasalcavitycanbetreatedexactlylikethevocal
tract,withtheaddedsimplificationthatitsshapemayberegardedasfixed.Thecommonassumption
isthatthenostrilsaresymmetric,inwhichcasethecross-sectionalareasofthetwonostrilscanbe
addedandthenosereplacedbyasingle,fixed,variable-areatube.
Thedescriptionofthecomputationsiseasiertofollowwiththeaidoftheblockdiagramshown
inFig.44.5.Fromaknowledgeoftheareafunctionsandlossesforthevocalandnasaltractsthree
chainmatricesK
gv
,K
vt
,andK
vn
arefirstcomputed.Theserepresent,respectively,thematricesfrom
glottistovelum,velumtotractclosure(orvelumtolips,incaseofanasalvowel),andvelumto
nostrils.
FromK
vn
withsomeassumedimpedanceterminationatthenostrils,theinputimpedanceof
thenostrilsatthevelummaybecomputedasindicatedinEq.(44.16b).Similarly,K
vt
givesthe
inputimpedanceatthevelum,ofthevocaltractlookingtowardthelips.Atthevelum,thesetwo
impedancesarecombinedinparalleltogiveatotalimpedance,sayZ
v
.Withthisastermination,the
velocitytovelocitytransferfunction,T
gv
,fromglottistovelumcanbecomputedfromK
gv
asshown
c
1999byCRCPressLLC
FIGURE44.5:Chainmatricesforsynthesizingnasalsounds.
inEq.(44.16b).Foragivenvolumevelocityattheglottis,U
g
,thevolumevelocityatthevelumis
U
v
=T
gv
U
g
,andthepressureatthevelumisP
v
=Z
v
U
v
.OnceP
v
andU
v
areknown,thevolume
velocityand/orpressureatthenostrilsandlipscanbecomputedbyinvertingthematricesK
vn
and
K
vt
.
44.4 SourcesofExcitation
Asmentionedearlier,speechsoundsmaybeclassifiedbytypeofexcitation:periodic,turbulent,or
transient.Allofthesetypesofexcitationarecreatedbyconvertingthepotentialenergystoredinthe
lungsduetoexcesspressureintosoundenergyintheaudiblefrequencyrangeof20Hzto20kHz.
Thelungsofayoungadultmalemayhaveamaximumusablevolume(“vitalcapacity”)ofabout5
l.Whilereadingaloudthepressureinthelungsistypicallyintherangeof6to15cmofwater(6000
to15000Pa).Vocalcordvibrationscanbesustainedwithapressureaslowas.2cmofwater.Atthe
otherextreme,apressureashighas195cmofwaterhasbeenrecordedforatrumpetplayer.Typical
averageairflowfornormalspeechisabout0.1l/s.Itmaypeakashighas5l/sduringrapidinhalesin
singing.
Periodicexcitationoriginatesmainlyatthevibratingvocalfolds,turbulentexcitationoriginates
primarilydownstreamofthenarrowestconstrictioninthevocaltract,andtransientexcitations
occurwheneveracompleteclosureofthevocalpathwayissuddenlyreleased.Inthefollowing,we
willexplorethesethreetypesofexcitationinsomedetail.Theinterestedreaderisreferredto[18]
formoreinformation.
44.4.1 PeriodicExcitation
Manyoftheacousticandperceptualfeaturesofanindividual’svoicearebelievedtobeduetospecific
characteristicsofthequasi-periodicexcitationsignalprovidedbythevocalfolds.These,inturn,
dependonthemorphologyofthevoiceorgan,thelarynx.Theanatomyofthelarynxisquite
complicated,anddescriptionsofitmaybefoundintheliterature[19].Fromanengineeringpoint
ofview,however,itsufficestonotethatthelarynxisthestructurethathousesthevocalfoldswhose
vibrationprovidestheperiodicexcitation.Thespacebetweenthevocalfolds,calledtheglottis,
varieswiththemotionofthevocalfolds,andthusmodulatestheflowofairthroughthem.Aslate
as1950Hussonpostulatedthateachmovementofthefoldsisinfactinducedbyindividualnerve
signalssentfromthebrain(theNeurochronaxishypothesis)[20].Wenowknowthatthelarynx
isaself-oscillatingacousto-mechanicaloscillator.Thisoscillatoriscontrolledbyseveralgroupsof
tinymusclesalsohousedinthelarynx.Someofthesemusclescontroltherestpositionofthefolds,
otherscontroltheirtension,andstillotherscontroltheirshape.Duringbreathingandproduction
offricatives,forexample,thefoldsarepulledapart(abducted)toallowfreeflowofair.Toproduce
voicedspeech,thevocalfoldsarebroughtclosetogether(adducted).Whenbroughtcloseenough
together,theygointoaspontaneousperiodicoscillation.TheseoscillationsaredrivenbyBernoulli
pressure(thesamemechanismthatkeepsairplanesaloft)createdbytheairflowthroughtheglottis.
c
1999byCRCPressLLC
If the opening of the glottis is small enough, the Bernoulli pressure due to the rapid flow of air is
large enough to pull the folds toward each other, eventually closing the glottis. This, of course, stops
the flowandthelar yngeal musclespullthefolds apart. This sequencerepeatsitselfuntilthefoldsare
pulled far enough away, or if the lung pressure becomes too low. We will discuss this oscillation in
greater detail later in this section.
Besides the laryngeal muscles, the lung pressure and the acoustic load of the vocal tract also affect
the oscillation of the vocal folds.
The larynxalso houses manymechanoreceptorsthatsignaltothebrain the v ibrational stateofthe
vocal folds. These signals help control pitch, loudness, and voice timbre.
Figure 44.6 shows stylized snapshots taken from the side and above the vibrating folds. The view
from above can be obtained on live subjects with high speed (or stroboscopic) photography, using
a lar yngeal mirror or a fiber optic bundle for illumination and viewing. The view from the side is
FIGURE 44.6: One cycle of vocal fold oscillation seen from the front and from above. (After
Sch
¨
onh
¨
arl, E., 1960 [25]. With permission of Georg Thieme Verlag, Stuttgar t, Germany.)
the result of studies on excised (mostly animal) larynges. From studies such as these, we know that,
during glottal vibration, the folds carry a mechanical wave that starts at the tracheal (lower) end of
thefoldsandmoves upwardstothepharyngeal(upper)end. Consequently, the edge of the foldsthat
faces the vocal tract usually lags behind the edge of the folds that faces the lungs. This phenomenon
is called vertical phasing. Higher eigenmodes of these mechanical waves have been observed and
have been modeled.
Figure 44.7 shows typical acoustic flow waveforms, called flow glottograms, and their first time
derivatives. Inanormalglottogram,theclosedphaseoftheglottalcycleischaracterizedbyzeroflow.
Often,however, the closureisnotcomplete. Also,insomecases, although the folds close completely,
thereisaparallelpath—achink — which stays open all the time.
In the open phase the flow gradually builds up, reaches a peak, and then falls sharply. The asym-
metryisduetotheinertiaoftheairflowinthevocaltract and thesub-glottal cavities. Theamplitude
of the fundamental frequency is governed mainly by the peak of the flow while the amplitudes of the
higher harmonics isgoverned mainly by the (negative)peakrate of change of flow, whichoccursjust
before closure.
c
1999 by CRC Press LLC
FIGURE 44.7: Example of glottal volume velocity and its time derivative.
Voice Qualities
Depending on the adjustment of the various parameters mentioned above, the glottis can
producea variety of phonations (i.e., excitations for voiced speech), resulting in different perceptual
voicequalities. Someperceptualqualitiesvarycontinuouslywhereasothersareessentiallycategorical
(i.e., they change abr uptly when some parameters cross a threshold).
Voice timbre is an important continuously variable quality which may be given various labels
ranging from “mellow” to “pressed”. The spectral slope of the glottal waveform is the main physical
correlate of this perceptual quality. On the other hand, nasality and aspiration may be regarded as
categorical qualities.
The physical properties that distinguish a “male” voice from a “female” voice are still not well
understood, although many distinguishing features are known. Besides the obvious cue of fun-
damental frequency, the perceptual quality of “breathiness” seems to be important for producing
a female-sounding voice. It occurs when the glottis does not close completely during the glottal
cycle. This results in a more sinusoidal movement of the folds which makes the amplitude of the
fundamental frequency much larger compared to those of the higher harmonics. The presence of
leakageintheabductedglottisalsoincreasesthedampingofthelowerformants,thusincreasingtheir
bandwidths. Also, the continuous airflow through the leaking glottis gives rise to increased levels of
glottal noise (aspiration noise) that masks the higher harmonics of the glottal spectrum. Finally, in
c
1999 by CRC Press LLC
glottograms of female voices, the open phase is a larger proportion of the glottal cycle (about 80%)
than in glottograms of male voices (about 60%). The points of closure are also smoother for female
voices, which results in lower high frequency energy relative to the fundamental.
Finally, the individuality of a voice (which allows us to recognize the speaker) appears to be
dependent largely on the exact relationships between the amplitudes of the first few harmonics.
Models of the Glottis
Astudyofthemechanicalandacousticalpropertiesofthelarynxisstillanareaofactiveinterdis-
ciplinary research. Modeling in the mechanical and acoustical domains requires making simplifying
assumptions about the tissue movements and the fluid mechanics of the airflow. Depending on the
degreetowhichthemodelsincorporatephysiologicalknowledge,onecandistinguishthreecategories
of glottal models:
Parametrizationofglottalflow is the “black-box” approach to glottal modeling. The glottal flow
waveorits firsttimederivativeisparametrizedinsegmentsbyanalyticalfunctions. Itseemsdoubtful
that any simple model of this kind can match all kinds of speakers and speaking styles. Examples
of speech sounds that are difficult to parametrize in this way are nasal and mixed-excitation sounds
(i.e., sounds with an added fr icative component) and “simple” high-pitch female vowels.
Parametrization of glottal area is more realistic. In this model, the area of the glottal opening is
parametrizedinsegments,buttheairflowiscomputedfromthepropagationequations,andincludes
itsinteractionwiththeacousticloadsofthevocaltract and thesubglottal structures. Suchamodelis
capable of reproducing much more of the detail and individuality of the glottal wave than the black
box approach. Problems are still to be expected for mixed glottal/fricative sounds unless the tract
model includes an accurate mechanism for frication (see the section on turbulent excitation below).
In a complete, self-oscillating model of the glottis described below, the amplitude of the glottal
openingaswellastheinstantsofglottalclosureareautomaticallyderived,anddependinacomplicated
manner on the laryngeal parameters, lung pressure, and the past history of the flow. The area-
driven model has the disadvantage that amplitude and instants of closure must be specified as side
information. However, the ability to specify the points ofglottal closure can, in fact, be an advantage
in some applications; for example, when the model is used to mimic a given speech signal.
Self-oscillating physiological models of the glottis attempt to model the complete interaction of
theairflowandthevocalfoldswhichresultsinperiodicexcitation. Theinputtoamodelofthistypeis
slowly varying physical parameters such as lung pressure, tension of the folds, pre-phonatory glottal
shape, etc. Of the many models of this type that have been proposed, the one most often used is the
2-mass model of Ishizaka and Flanagan (I&F). In the following we will briefly review this model.
The I&F two-mass model is depicted in Fig. 44.8. As shown there, the thickness of the vocal
folds that separates the trachea from the vocal tract is divided into two parts of length d
1
and d
2
,
respectively, where the subscript 1 refers to the part closest to the trachea and 2 refers to the part
closest to the vocal tract. These portions of the vocal folds are represented by damped spring-mass
systems coupled to each other. The division into two portions is a refinement of an earlier version
that represented the folds by a single spring-mass system. By using two sections the model comes
closer to reality and exhibits the phenomenon of vertical phasing mentioned earlier.
Inordertosimulatetissue,allthespringsanddampersarechosentobenonlinear. Beforediscussing
the choice of these nonlinear elements, let us first consider the relationship between the airflow and
the pressure variations from the lungs to the vocal tract.
Airflow in the Glottis
Thedimensionsd
1
andd
2
arevery small —about1.5 mmeach. Thisisavery small fraction of
the wavelength even at the highest frequencies of interest. (The wavelength of a sound wave in air at
100kHzisabout3 mm!). Thereforewemayassumetheflowthroughtheglottistobeincompressible.
c
1999 by CRC Press LLC
FIGURE 44.8: The two-mass model of Ishizaka and Flanagan [21].
With this assumption the equation of continuity, Eq. (44.2), merely states that the volume velocity
is the same everywhere in the glottis. We will call this volume velocity u
g
. The relationship of this
velocity to the pressure is governed by the equation of motion. Since the particle velocity in the
glottis can be very large, we need to consider the nonlinear version given in Eq. (44.5). Also, since
the cross-section of the glottis is very small, viscous drag cannot be neglected. So we will include a
term representing viscous drag proportional to the velocity. With this addition, Eq. (44.5) becomes:
∂
∂x
p +
ρ
2
u
g
/A
2
=−ρ
∂
∂t
u
g
A
− R
v
u
g
/A
. (44.21)
The drag coefficient R
v
can be estimated for simple geometries. In the present application a rect-
angular aperture is appropriate. If the length of the aperture is l, its width (corresponding to the
openingbetweenthefolds)isw anditsdepthinthedirectionofflowisd, thenR
v
=
12µd
lw
3
,whereµ is
thecoefficientofshearviscosity. ThepressuredistributionisobtainedbyrepeateduseofEq.(44.21),
usingtheappropriatevalueofA (andhenceofR
v
)inthedifferentpartsoftheglottis. Inthismanner,
the pressure at any point in the glottis may be determined in terms of the volume ve locity, u
g
, the
lung pressure, P
s
, and the pressure at the input to the vocal tr act, p
1
.
The detailed derivation of the pressure distribution is given in [21]. The derivation shows that
the total pressure drop across the glottis, P
s
− p
1
, is related to the glottal volume velocity, u
g
,byan
equation of the form
P
s
− p
1
= Ru
g
+
d
dt
(Lu
g
) +
ρ
2
u
g
/α
2
. (44.22)
With the analogy of pressure to voltage and volume velocity to current, the quantity R is analogous
to resistance and L to inductance. Theterm in u
2
g
mayberegardedasu
g
times a current-dependent
resistance. Thequantity α has the dimensions of an area.
Models of Vocal Fold Tissue
When the pressure distribution derived above is coupled to the mechanical properties of the
vocalfolds,wegetaself-oscillatingsystemwith properties quite similar to those of a real larynx. The
mechanical properties of the vocal folds have been modeled in many ways with varying degrees of
complexityranging froma single spring-mass system to a distributed parameter flexible tube. Inthe
following, by way of example, we will summarize only the original 1972 I&F model.
Returning to Fig. 44.8, we observe that the mechanical properties of the folds are represented by
the masses m
1
and m
2
, the (nonlinear) springs s
1
and s
2
, the coupling spring k
c
, and the nonlinear
c
1999 by CRC Press LLC
dampers r
1
and r
2
. Theopening in each section of the glottis is assumed to have a rectangular shape
with length l
g
. Thewidths of the two sections are 2x
j
,j = 1, 2. Assuminga symmetrical glottis, the
cross-sectional areas of the two sections are
A
gj
= A
g0j
+ 2l
g
x
j
,j= 1, 2 , (44.23)
whereA
g01
and A
g02
arethe areas at rest. Fromthis equation, we compute the lateral displacements
x
j min
,j = 1, 2 at which the two folds touch each other in each section to be x
j min
=−A
g0j
/(2l
g
).
Displacements more negative than these indicate a collision of the folds. The springs s
1
and s
2
are
assumed to haverestoring forcesofthe form ax + bx
3
, where the constants a andb takeondifferent
values for the two sections and for the colliding and non-colliding conditions.
The dampers r
1
and r
2
are assumed to be linear, but with different values in the colliding and
non-colliding cases. The coupling spring k
c
is assumed to be linear. With these choices, the coupled
equations of motion for the two masses are:
m
1
d
2
x
1
dt
2
+ r
1
dx
1
dt
+ f
s1
(
x
1
)
+ k
c
(
x
1
− x
2
)
= F
1
, (44.24a)
and
m
2
d
2
x
2
dt
2
+ r
2
dx
2
dt
+ f
s2
(
x
2
)
+ k
c
(
x
2
− x
1
)
= F
2
. (44.24b)
Here f
s1
and f
s2
are the cubic nonlinear springs. The parameters of these springs as well as the
damping constants r
1
and r
2
change when the folds go from a colliding state to a non-colliding state
and vice versa. The driving forces F
1
and F
2
are proportional to the average acoustic pressures in
the two sections of the glottis. Whenever a section is closed (due to the collision of its sides) the
corresponding driving force is zero. Note that it is these forces that provide the feedback of the
acoustic pressures to the mechanical system. This feedback is ignored in the area-driven models of
the glottis.
Weclose thissectionwithanexampleofongoingresearchinglottalmodeling. In theintroduction
to this section we had stated that breathiness of a voice is considered important for producing a
natural-sounding synthetic female voice. Breathiness results from incomplete closures of the folds.
We had also stated that incomplete glottal closures due to abducted folds lead to a steep spectral
roll-off of the glottal excitationand a strong fundamental. However, practical experience shows that
many voices show clear evidence for breathiness but do not show a steep spectral roll-off, and have
relativelyweakfundamentalsinstead. Howcanthismystery be solved? It hasbeensuggestedthatthe
glottal“chink”mentionedinthediscussionofFig.44.7mightbetheanswer. Manyhigh-speedvideos
of the vocalfolds show evidence of a separate leakage path in the “posterior commissure” (where the
folds join) which stays open all the time. Analysis of such a permanently open path produces the
stated effect [22].
44.4.2 Turbulent Excitation
Turbulentairflowshowshighlyirregularfluctuationsofparticlevelocityandpressure. Thesefluctua-
tionsareaudibleasbroadbandnoise. Turbulentexcitationoccursmainlyattwolocationsinthevocal
tract: near the glottis and at constriction(s) between the glottis and the lips. Turbulent excitation at
a constriction downstream of the glottis producesfricativesounds or voiced fricatives depending on
whether or not voicing is simultaneously present. Also, stressedversionsof the voweli, and liquids l
andr areusuallyaccompaniedbyturbulentflow. Measurementsandmodelsforturbulentexcitation
c
1999 by CRC Press LLC
are even more difficult to establish than for the periodic excitation produced by the glottis because,
usually, no vibrating surfaces are involved. Because of the lack of a comprehensive model, much
confusion exists over the proper sub-classification of fricatives. The simplest model for turbulent
excitation is a “nozzle” (narrow orifice) releasing air into free space. Experimental work has shown
that half (or more) of the noise powergeneratedby a jet of air orig inates within the so-called mixing
region that starts at the nozzle outlet and extends as far as a distance four times the diameter of the
orifice. The noise source is therefore distributed. Several scaling relations hold between the acoustic
output and the nozzle geometry. One of these scaling properties is the so-called Reynolds number,
Re, that characterizes the amount of turbulence generated as the air from the jet mixes with the
ambient air downstream from the orifice:
Re =
u
A
x
ν
.
(44.25)
Here u is the volume velocity, A is the area of the orifice (hence, u/A is the particle velocity), x is
a characteristic dimension of the orifice (the width for a rectangular orifice), and ν = µ/ρ is the
kinematic viscosity of air. Beyond a critical value of the Reynolds number, Re
crit
(which is about
1200 for the case of a free jet), the flow becomes fully turbulent; below this value, the flow is partly
turbulent and becomes fully laminar at very low velocities. Another scaling equation defines the
so-called Strouhal number, S, that relates the frequency F
max
of the (usually broad) peak in the
power spectrum of the generated noise to the width of the orifice and the velocity:
S = F
max
x
u/A
.
(44.26)
For the case of a free jet, the Strouhal number S is 0.15. Within the jet, higher frequencies are
generated closer to the orifice and lower frequencies further away.
Distributed sourcesofturbulencecanbemodeledbyexpandingthemintermsofmonopoles(i.e.,
pulsating spheres), dipoles (two pulsating spheres in opposite phase), quadrupoles (two dipoles in
oppositephase),andhigher-orderrepresentations. Thetotal powergeneratedbyamonopolesource
in free space is proportional to the fourth power of the particle velocity of the flow, that of a dipole
sourceobeys a (u/A)
6
powerlaw, and that of a quadrupole source obeys a (u/A)
8
power law. Thus,
the low order sources are more important at low flow rates, while the reverse is the case at high flow
rates. In a duct, however, the exponents of the power laws decrease by 2, that is, a dipole source’s
noise power is proportional to (u/A)
4
,etc.
Thus far, we have summarized noise generation in a free jet or air. A much stronger noise source
is created when a jet of air hits an obstacle. Depending on the angle between the surface of the
obstacle and the direction of flow, the surface roughness, and the obstacle geometry, the noise
generated can be up to 20 dB hig her than that generated by the same jet in free space. Because of
the spatially concentrated source, modeling obstacle noise is easier than modeling the noise in a free
jet. Experiments reveal that obstacle noise can be approximated by a dipole source located at the
obstacle.
The above theoretical findings qualitatively explain the observed phenomenon that the fricatives
th and f (and the corresponding voiced dh and v) are weak compared to the fricatives s and sh.
The teeth (upper for s and lower for sh) provide the obstacle on which the jet impinges to produce
the higher noise levels. A fricative of intermediate strength results from a distributed obstacle (the
“wall” case) when the jet is forced along the roof of the mouth as for the sound y.
In a synthesizer, dipole noise sourcescan be implemented as series pressure sources. Onepossible
implementation is to make the source pressure proportional to Re
2
− Re
crit
2
for Re > Re
crit
and
zerootherwise[11]. Another option [23]istorelate thenoisesourcepowertotheBernoullipressure
B = .5ρ(u/A)
2
. Since the power of a dipole source located at the teeth (and radiating into free
space) is (u/A)
6
, it is also proportional to B
3
, and the noise source pressure p
n
∝ B
3/2
. On the
c
1999 by CRC Press LLC
otherhand,forwallsourceslocatedfurtherawayfromthelips,weneedmultiple(distributed)dipole
sourceswithsourcepressuresproportionaleithertoRe
2
−Re
crit
2
ortoB.Ineithercase,thesource
shouldhaveabroadbandspectrumwithapeakatafrequencygivenbyEq.(44.26).
Whenanoisesourceislocatedatsomepointinsidethetract,itseffectontheacousticoutput
atthelipsiscomputedintermsoftwochainmatrices—thematrixK
F
fromtheglottistothe
noisesource,andthematrixK
L
fromthenoisesourcetothelips.Forfricativesounds,theglottis
iswideopen,sotheterminationimpedanceattheglottisendmaybeassumedtobezero.Withthis
termination,theimpedanceatthenoisesourcelookingtowardtheglottisiscomputedfromK
F
as
explainedinthesectiononchainmatrices.CallthisimpedanceZ
1
.Similarly,aknowledgeofthe
radiationimpedanceatthelipsandthematrixK
L
allowsustocomputetheinputimpedanceZ
2
lookingtowardthelips.ThevolumevelocityatthesourceisthenjustP
n
/(Z
1
+Z
2
)whereP
n
isthe
pressuregeneratedbythenoisesource.ThetransferfunctionobtainedfromEq.(44.16a)forthe
matrixK
L
thengivesthevolumevelocityatthelips.
ItcanbeshownthattheseriesnoisesourceP
n
excitesallformantsoftheentiretract(i.e.,theones
wewouldseeifthesourcewereattheglottis).However,thespectrumoffricativenoiseusuallyhas
ahighpasscharacter.Thiscanbeunderstoodqualitativelybythefollowingconsiderations.
Whenthetracthasaverynarrowconstriction,thefrontandbackcavitiesareessentiallydecoupled,
andtheformantsofthetractaretheformantsofthebackcavityplusthoseofthefrontcavity.If
nowthenoisesourceisjustdownstreamoftheconstriction,theformantsofthebackcavityareonly
slightlyexcitedbecausetheimpedanceZ
1
alsohaspolesatthosefrequencies.Sincethebackcavityis
usuallymuchlongerthanthefrontcavityforfricatives,thelowerformantsaremissinginthevelocity
atthelips.Thisgivesitahighpasscharacter.
44.4.3 TransientExcitation
Transientexcitationofthevocaltractoccurswheneverpressureisbuiltupbehindatotalclosure
ofthetractandsuddenlyreleased.Thissuddenreleaseproducesastep-functionofinputpressure
atthepointofrelease.Theoutputvelocityisthereforeproportionaltotheintegraloftheimpulse
responseofthetractfromthepointofreleasetothelips.Inthefrequencydomain,thisisjustP
r
/s
timesthetransferfunction,whereP
r
isthestepchangeinpressure.Hence,thevelocityatthelips
maybecomputedinthesamewayasinthecaseofturbulentexcitation,withP
n
replacedbyP
r
/s.
Inpractice,thisstepexcitationisusuallyfollowedbythegenerationoffricativenoiseforashort
periodafterreleasewhentheconstrictionisstillnarrowenough.Sometimes,iftheglottisisalso
beingconstricted(e.g.,tostartvoicing)someaspirationmightalsoresult.
44.5 DigitalImplementations
Themodelsofthevariouspartsofthehumanspeechproductionapparatuswhichwehavedescribed
abovecanbeassembledtoproducefluentspeech.Herewewillconsiderhowadigitalimplementation
ofthisprocessmaybecarriedout.Basically,thestandardtheoryofsamplinginthetimeandfrequency
domainsisusedtoconvertthecontinuoussignalsconsideredabovetosampledsignals,andthe
samplesarerepresenteddigitallytothedesirednumberofbitspersample.
44.5.1 SpecificationofParameters
Theparametersthatdrivethesynthesizerneedtobespecifiedaboutevery20ms.(Theassumed
quasi-stationarityisvalidoverdurationsofthissize.)
Twosetsofparametersareneeded—theparametersthatspecifytheshapeofthevocaltractand
thosethatcontroltheglottis.Thevocaltractparametersimplicitlycontrolnasality(byspecifyingthe
openingareaofthevelum)andalsofrication(byspecifyingthesizeofthenarrowestconstriction).
c
1999byCRCPressLLC
44.5.2 Synthesis
Thevocaltractisapproximatedbyaconcatenationofabout20uniformsections.Thecross-sectional
areasofthesesectionsiseitherspecifieddirectly,orcomputedfromaspecificationofarticulatory
parametersasshowninFig.44.3.Thechainmatrixforeachsectioniscomputedatanadequate
samplingrateinthefrequencydomaintoavoidtime-aliasingofthecorrespondingtimefunctions.
(Computationofthechainmatricesrequiresaspecificationofthelossesalso.Severalmodelsexist
whichassignthelossesintermsofthecross-sectionalarea[11,16]).
Thechainmatricesfortheindividualsectionsarecombinedtoderivethematricesforvarious
portionsofthetract,asappropriatefortheparticularspeechsoundbeingsynthesized.Forvoiced
sounds,thematricesforthesectionsfromtheglottistothelipsaresequentiallymultipliedtogive
thematrixfromtheglottistothelips.Fromthek
11
,k
12
,k
21
,k
22
componentsofthismatrix,the
transferfunction
U
out
U
in
andtheinputimpedanceareobtainedasinEqs.(44.16a)and(44.16b).
KnowingtheradiationimpedanceZ
R
atthelipswecancomputethetransferfunctionforoutput
pressure,H=
U
out
U
in
Z
R
.TheinverseFFTofthetransferfunctionHandtheinputimpedanceZ
in
givethecorrespondingtimefunctionsh(n)andz
in
(n),respectively.Thesefunctionsarecomputed
every20ms,andtheintermediatevaluesareobtainedbylinearinterpolation.
Forthecurrenttimesamplinginstantn,thecurrentpressurep
1
(n)attheinputtothevocaltract
isthencomputedbyconvolvingz
in
withthepastvaluesoftheglottalvolumevelocityu
g
.Withp
1
known,thepressuredifferenceP
s
−p
1
onthelefthandsideofEq.(44.22)isknown.Equation(44.18)
isdiscretizedbyusingabackwarddifferenceforthetimederivative.Thus,anewvalueoftheglottal
volumevelocityisderived.This,togetherwiththecurrentvaluesofthedisplacementsofthevocal
folds,givesusnewvaluesforthedrivingforcesF
1
andF
2
forthecoupledoscillatorEqs.(44.24a)
and(44.24b).Thecoupledoscillatorequationsarealsodiscretizedbybackwarddifferencesfortime
derivatives.Thus,thenewvaluesofthedrivingforcesgivenewvaluesforthedisplacementsofthe
vocalfolds.Thenewvalueofvolumevelocityalsogivesanewvalueforp
1
,andthecomputational
cyclerepeats,togivesuccessivesamplesofp
1
,u
g
,andthevocalfolddisplacements.
Theglottalvolumevelocityobtainedinthisway,isconvolvedwiththeimpulseresponseh(n)to
producevoicedspeech.
Ifthespeechsoundcallsforfrication,thechainmatrixofthetractisderivedastheproductoftwo
matrices—fromtheglottistothenarrowestconstrictionandfromtheconstrictiontothelips,as
discussedinthesectiononturbulentexcitation.Thisenablesustocomputethevolumevelocityat
theconstriction,andthusintroduceanoisesourceonthebasisoftheReynoldsnumber.
Finally,toproducenasalsounds,thechainmatrixforthenasaltractisalsocomputed,andthe
outputatthenostrilscomputedasdiscussedinthesectiononchainmatrices.Ifthelipsareopen,
theoutputfromthelipsisalsocomputedandaddedtotheoutputfromthenostrilstogivethetotal
speechsignal.Detailsofthesynthesisproceduremaybefoundin[24].
References
[1]Edwards,H.T.,AppliedPhonetics:TheSoundsofAmericanEnglish,SingularPublishing
Group,SanDiego,1992,Chap.3.
[2]Olive,J.P.,Greenwood,A.,andColeman,J.,
AcousticsofAmericanEnglishSpeech,Springer
Verlag,NewYork,1993.
[3]Fant,G.,
AcousticTheoryofSpeechProduction,MoutonBookCo.,Gravenhage,1960,Chap.
2.1,93-95.
[4]Baer,T.,Gore,J.C.,Gracco,L.C.,andNye,P.W.,Analysisofvocaltractshapeanddimensions
usingmagneticresonanceimaging:Vowels,
J.Acoust.Soc.Am.,90(2),799-828,Aug1991.
c
1999byCRCPressLLC
[5] Stone, M., A three-dimensional model of tongue movement based on ultrasound and mi-
crobeam data,
J. Acoust. Soc. Am., 87 (5), 2207-2217, May 1990.
[6] Sondhi, M.M. and Resnick, J.R., The inverse problem for the vocal tract: Numerical methods,
acoustical experiments, and speech synthesis,
J. Acoust. Soc. Am., 73 (3), 985-1002, March
1983.
[7] Hardcastle, W.J., Jones, W., Knight, C., Trudgeon, A., and Calder, G., New developments in
electropalatography: A stateoftheartreport,
ClinicalLinguistics and Phonetics, 3,1-38,1989.
[8] Perkell, J.S., Cohen, M.H., Svirsky, M.A., Mathies, M.L., Garabieta, I., and Jackson, M.T.T.,
Electromagnetic midsagittal articulometer systems for transducing speech articulatory move-
ments,
J. Acoust. Soc. Am., 92 (6), 3078-3096, Dec 1992.
[9] Coker, C.H., A model of articulatory dynamics and control,
Proc. IEEE, 64 (4), 452-460, April
1976.
[10] Sondhi, M.M., Resonances of a bent vocal tract,
J. Acoust. Soc. Am., 79 (4), 1113-1116, April
1986.
[11] Flanagan, J.L.,
Speech Analysis, Synthesis and Perception, 2nd ed., Springer Verlag, New York,
1972, Chap. 3.
[12] Lu, C.,Nakai, T.,andSuzuki,H.,Three-dimensionalFEMsimulation of theeffectsofthevocal
tract shape on the transfer function,
Intl. Conf. on Spoken Lang. Processing, Banff, Alberta, 1,
771-774, 1992.
[13] Richard,G.,Liu,M.,Sinder,D.,Duncan,H.,Lin, O., Flanagan,J.L., Levinson, S.E.,Davis,D.W.
and Slimon, S., Numerical simulations of fluid flow in the vocal tract,
Proc. Eurospeech ’95,
European Speech Comm. Assoc.,
Madrid, Spain, 18-21, Sept. 1995.
[14] Morse, P.M.,
Vibration and Sound, McGraw Hill, New York, 1948, Chap. 6.
[15] Pierce, A.D.,
Acoustics, 2nd ed., McGraw-Hill, 360, 1981.
[16] Sondhi, M.M., Model for wave propagation in a lossy vocal tract,
J. Acoust. Soc. Am., 55 (5),
1070-1075, May 1974.
[17] Siebert, W. McC.,
Circuits, Signals and Systems, MIT Press/McGraw-Hill, pp. 97, 1986.
[18] Sundberg, J.,
The Science of the Singing Voice, Northern Illinois University Press, DeKalb, IL,
1987.
[19] Zemlin, W.R.,
Speech and Hearing Science, Anatomy, and Physiology, Prentice-Hall, Engle-
wood Cliffs, NJ, 1968.
[20] Husson, R., Etude des ph
´
enomenes physiologiques et acoustiques fondamentaux de la voix
cant
´
ee, Disp edit Rev Scientifique, 1-91, 1950. For a discussion see Diehl, C.F.,
Introduction
to the anatomy and physiology of the speech mechanisms,
Charles C Thomas, Spr ingfield, IL,
110-111, 1968.
[21] Ishizaka,K.andFlanagan,J.L., Synthesisofvoicedsoundsfromatwo-massmodelofthevocal
cords,
Bell System Tech. J., 51 (6), 1233-1268, July-Aug. 1972.
[22] Cranen, B. and Schroeter, J., Modeling a leaky glottis,
J. Phonetics, 23, 165-177, 1995.
[23] Stevens,K.N., Airflowand turbulence noise for fr icative and stop consonants: Staticconsider-
ations,
J. Acoust. Soc. Am., 50 (4), 1180-1192, 1971.
[24] Sondhi, M.M. and Schroeter, J., A hybrid time-frequency domain articulatory speech synthe-
sizer,
IEEE Trans. on Acous., Speech, and Sig. Proc., ASSP-35 (7), 955-967, July 1987.
[25] Sch
¨
onh
¨
arl, E.,
Die Stroboskopie in der praktischen Laryngologie, Georg Thieme Verlag,
Stuttgart, Germany, 1960.
c
1999 by CRC Press LLC