Tài liệu Cảm biến trong sản xuất P7 pdf
Bạn đang xem bản rút gọn của tài liệu. Xem và tải ngay bản đầy đủ của tài liệu tại đây (1.7 MB, 20 trang )
123
3.2.4
Further Reading
1 Dagnall, H., Exploring Surface Texture;
Leicester: Rank Taylor Hobson, 1986.
2 Hommelwerke GmbH, Rauheitsmessung
Theorie und Praxis; Schwenningen:
Schnurr Druck, 1993.
3 Sander, M., Oberflächenmesstechnik für den
Praktiker; Göttingen: Feinprüf Perthen,
1993.
4 Thomas, T.R., Rough Surfaces; London:
Imperial College Press, 1999.
5 Bodschwinna, H., Hillmann, W., Ober-
flächenmesstechnik mit Tastschnittgeräten in
der Industriellen Praxis; Cologne: Beuth,
1992.
6 Dresel, T., Häusler, G., Venzke, H.,
Appl. Opt. 31 (1992) 919–925.
7 Koch, A.W., Ruprecht, M.W., Toedter,
O., Häusler, G., Optische Messtechnik
an Technischen Oberflächen; Renningen-
Malmsheim: Expert-Verlag, 1998.
8 Pfeifer, T., Optoelektronische Verfahren zur
Messung Geometrischer Grössen in der Ferti-
gung; Ehningen bei Böblingen: Expert-Ver-
lag, 1993.
9 Wiesendanger, R., Güntherodt, H.J.,
Scanning Tunneling Microscope; Vols. I–III.
Heidelberg: Springer, 1992.
10 Fries, Th., Rastersondenmikroskopie: Nobel-
preistechnologie für die Anwendung; 10
Feinwerktechnik – Mikrotechnik – Mess-
technik (F+M) 101, 10, 1993.
11 A Practical Guide to Scanning Probe Micro-
scopy; Sunnyvale: ThermoMicroscopes,
1997.
3.3
Sensors for Physical Properties
B. Karpuschewski, Keio University, Yokohama, Japan
3.3.1
Introduction
In this section, the possibilities of monitoring the physical properties of machined
parts are discussed. Cutting processes with geometrically defined cutting edges
such as hard turning have to be distinguished from abrasive processes such as
grinding. In both cases workpiece material is removed in the form of chips due to
the mechanical effect of the tool on the workpiece. Not only the geometry but also
the number of cutting edges and their position relative to the workpiece are well
known for cutting operations, whereas the situation for grinding processes is
more complex. Here cutting edges are generated by single abrasives with irregular
shape and size variation, which are connected by sufficient bond material. Owing
to the large number of individual grains with changing micro-geometry, the condi-
tions in the zone of contact can only be described by means of statistics.
Although these major differences in the cutting conditions between grinding and
cutting occur, the elementary process of material removal is still identical.
In Figure 3.3-1 the chip formation for cutting and grinding is shown schemati-
cally. The chip formation occurs owing to the formation of a pressure zone in
front of the cutting edge rounding in the primary shear zone [1, 2]. This pressure
zone effects the separation of the workpiece material into one part flowing as a
chip over the rake face and another part, which is plastically and elastically de-
formed by the cutting edge rounding, the flank face, and the minor cutting edge
Sensors in Manufacturing. Edited by H.K. Tönshoff, I. Inasaki
Copyright © 2001 Wiley-VCH Verlag GmbH
ISBNs: 3-527-29558-5 (Hardcover); 3-527-60002-7 (Electronic)
and pressed in the remaining workpiece material. Both processes generate a ther-
mal and mechanical impact on the workpiece surface. These effects are the domi-
nating influences for the physical properties. The mechanical impact is character-
ized by the generation of the contact area between the workpiece and tool, and
abrasive grain and the resulting forces and stresses. The thermal load is deter-
mined by the heat distribution in the zone of contact, the temperatures that arise,
and their temporal course [3–5]. Of course, the initial properties of the workpiece
material also play an important role for the physical properties. These physical
properties are shown in Figure 3.3-2 for a hardened steel material.
3 Sensors for Workpieces124
Fig. 3.3-1 Cutting and grinding chip formation and mechanical and thermal impact. Source: Kö-
nig [3], Wobker [4]
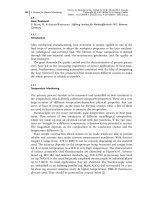
Fig. 3.3-2 Physical workpiece properties after turning or grinding
All the physical properties of machined surfaces shown can be described as
‘surface integrity’. This expression was introduced by Field and Kahles [6] more
than three decades ago and is now a world-wide accepted technical term. Fig-
ure 3.3-3 shows an overview of systems for registering these physical properties.
3.3.2
Laboratory Reference Techniques
In the laboratory, high-resolution techniques such as hardness testing with inden-
ters and metallographic inspection have proven their high standard. However, the
main disadvantage of these methods is the measuring time, which limits their
use to random sampling tests. In many cases the workpiece even has to be de-
stroyed followed by extensive preparations to obtain information about the sub-
surface states or to investigate the cut-out segment of a larger part. In industrial
applications, mainly methods are applied for detecting damage that has already
occurred. Pure visual tests are very inaccurate and crack inspection is only suit-
able for crack-sensitive materials. Etching is the most widespread method of sur-
face characterization, but still only a qualitative result can be obtained based on
the experience of the inspection operator. X-ray diffraction using sin
2
w evaluation
can be regarded as a standard technique to measure residual stresses [7].
3.3.3
Sensors for Process Quantities
During the interaction of tool and workpiece, material removal is initiated and a
zone of contact is generated. The quantities which are measured during this inter-
action are called process quantities. Forces, power, temperature, and acoustic
emission are the most common process quantities, which are discussed below.
3.3 Sensors for Physical Properties 125
Fig. 3.3-3 Surface integrity characterization for cutting or grinding operations
3.3.3.1 Force Sensors
In this section only force sensors based on piezoelectric quartz force transducers are
considered. Other possible sensor solutions for force measurements are discussed in
Chapter 4. In turning of hardened steels or hard turning, the insert is usually fixed
to a shank, which is mounted on a three-component piezoelectric force dynamom-
eter. The hard turning operation is performed with low feed speeds and depths of cut
and the use of tools with large cutting edge radii. In order to achieve low roughness
values, only the cutting edge radius of the tool is used for machining, leading to a
negative effective tool rake angle (see also Figure 3.3-1). The back force F
p
, which
is pushing the tool away from the workpiece, is the dominant force component with
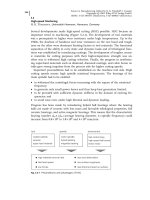
the steepest increase. The state of tool wear can thus be observed by measuring the
cutting forces. With increasing cutting time, the cutting forces increase linearly. The
development of surface integrity changes and back force increase due to hard turn-
ing performed with increasing tool wear is shown in Figure 3.3-4 [8]. Depending on
increasing width of flank wear land VB
c
, the back force and structural changes in-
crease. These results can be regarded as typical and have been stated in many differ-
ent investigations. Back force monitoring by piezoelectric dynamometers is thus a
very efficient technique to monitor tool condition and to avoid any damage to the
workpiece surface integrity. Wobker [4] and Schmidt [5] further improved this
approach by calculating the friction power at the flank face, P
a
, based on force mea-
surements. If this friction power is related to the contact length between tool and
workpiece, l
k
, the specific friction power, P'
a
, is calculated [5]. With this process quan-
tity it is possible to predict the thermal load on the workpiece also taking the cutting
edge micro-geometry into account.
In grinding there are different possibilities to integrate a piezoelectric dynamo-
meter in the machine tool, which are described in Section 4.4.3. The tangential
force is the most important component with regard to the surface integrity state,
3 Sensors for Workpieces126
Fig. 3.3-4 Surface integrity state and back force as a function of tool wear. Source: Brandt [8]
because the multiplication of tangential force and cutting speed results in the
grinding power, P
c
. If this grinding power is referred to the zone of contact, the
specific grinding power, P
c
'', can be calculated. This quantity is used to estimate
the heat generation during grinding [eg, 1, 9]. Figure 3.3-5 shows representative
structure surveys and Vickers micro-hardness depths of different plunge-cut
ground workpieces made of case hardened steel. The specific grinding power as
the main characteristic was varied by increasing the specific material removal
rate, Q'
w
. In addition to the graphical results, the X-ray measured residual stresses
are also presented. The results reveal no thermal damage at the lowest related
grinding power, followed by an increase in tensile residual stresses and an ex-
tended annealing zone for the second state.
The highest P
c
'' causes structural deformations in the form of rehardening
zones with sub-surface annealing and the previously explained reduction of ten-
sile stresses. Brinksmeier has analyzed a wide variety of different grinding pro-
cesses to establish an empirical model for the correlation between the specific
grinding power based on force measurement and the X-ray calculated residual
stress states [1]. The results show that it is not possible to predict the residual
stress state only based on the specific grinding power without knowing the corre-
sponding transfer function. The variations in the heat distribution due to different
grinding wheel characteristics, process kinematics, and parameters are too wide-
spread. Nevertheless, it can be clearly stated that a force measurement especially
of the tangential force is a well suited method to control the surface integrity state
of ground workpieces.
To summarize the examples presented, it can be said that a force measurement
of only one decisive component is a very efficient method to avoid any kind of
thermal damage on the machined surface either for turning or grinding. The only
3.3 Sensors for Physical Properties 127
Fig. 3.3-5 Influence of the specific grinding power on the surface integrity state of steel
major disadvantage and the limiting factor for wide industrial use is the high in-
vestment required for this technique. Other solutions beside piezoelectric-based
sensors will be introduced in Chapter 4.
3.3.3.2 Power Sensors
In cutting and especially in milling and drilling, power or torque sensors are of-
ten applied to the main spindle to monitor the process. It is the aim to avoid any
overload of the spindle due to tool failure, eg, breakage of one cutting edge or of
the whole tool (see Section 4.3.3). A direct correlation of the signals of these sen-
sors with the surface integrity of machined surfaces is not the main purpose of
their application. In turning of hardened steel, attempts were made to use the
spindle power measured with a Hallsensor to find a correlation with the surface
integrity state [5]. However, investigations revealed that the sensitivity of this sen-
sor is not high enough to register changes of the workpiece physical properties.
In grinding, power monitoring is most often used. The main reason is the easy
installation without influencing the working space of the machine tool and the
relatively low costs. However, different investigations have clearly shown that the
dynamic response of a power sensor at the main spindle is limited [eg, 10]. The
power portion used for material removal is only a fraction of the total power con-
sumption. However, still the mentioned advantages have promoted this sensor
type for grinding applications. In [10] a result of power monitoring to detect
grinding burn during internal grinding was published. Conventional abrasives
were used to grind mild steel, and the detected high peak in the power signal
over the grinding time must be attributed to a severe grinding burn. In most
cases the signal increase is not spectacular, but is rather a steady increase over the
grinding time due to continuing wear of the grinding wheel, especially when
using superabrasives. A typical result is shown in Figure 3.3-6 for a grinding pro-
3 Sensors for Workpieces128
Fig. 3.3-6 Power monitoring in spiral bevel
gear grinding to avoid grinding burn
cess on spiral bevel ring gears, introducing a vitreous bond CBN grinding wheel
[11]. Monitoring of the grinding power revealed a constant moderate increase in
the material removal V'
w
. At a specific material removal of 8100 mm
3
/mm grind-
ing burn was detected for the first time by nital etching. The macro- and micro-
geometry of the 28th workpiece was still within the tolerances, so the tool life cri-
terion was the surface integrity state. For this type of medium- or even large-scale
production in the automotive industry using grinding wheels with a long lifetime,
power monitoring is a very effective way to avoid thermal damage of the work-
piece and also to remove the environmentally harmful etching process. A similar
system is monitoring the power consumption of the grinding spindle and also of
the indexing head in a gear grinding machine. In addition, the rotation of the
grinding spindle is also supervised by very sensitive inductive sensors to detect de-
viations especially in the entrance and exit of the grinding wheel in the tooth
space, eg, due to distortions after heat treatment [12]. These results reveal that
power monitoring can be a suitable sensor technique to avoid surface integrity
changes during grinding. The most promising application is seen for superabra-
sives, because the slow increase in wear of the grinding wheel can be clearly de-
termined with this dynamic limited method.
3.3.3.3 Temperature Sensors
In addition to forces and power, another important process quantity is the result-
ing temperature in the zone of contact. The mechanisms of chip formation as
shown in Figure 3.3-1 lead to an almost total transformation of mechanical energy
into heat. Thus all participating components in the zone of contact such as the
workpiece, tool, chips, and, if used, coolant are thermally loaded. The resultant
heat distribution is thus of major importance for the generated surface integrity
state of the machined workpiece. The experimental effort to measure tempera-
tures in the zone of contact is very high. Often the workpiece or the tool has to be
destroyed to install the chosen sensor system in the zone of contact. All tech-
niques for cutting and grinding can be distinguished in measurements based on
heat conduction and heat radiation [2]. A detailed description of the most popular
setups is given in Chapter 4. In the following, an example of heat radiation mea-
surement in hard turning and heat conduction measurements in grinding is dis-
cussed.
Schmidt chose a heat radiation technique with an infrared camera, which mea-
sures the temperature on the workpiece directly underneath the insert (Figure 3.3-
7, left) [5]. The measured temperatures on the workpiece are then used to calcu-
late the maximum surface temperatures in the zone of contact through extrapola-
tion by applying a differential approximation to the heat conductivity equation. In
Figure 3.3-7 (right) the resulting maximum workpiece surface temperatures are
shown for different cutting edge geometries and cutting parameters together with
the contact length-related specific friction power at the flank face, P '
a
, deduced
from force measurements (see Section 3.3.3.1). High feeds and negative rake an-
gles lead to an increase in the maximum workpiece surface temperature, whereas
3.3 Sensors for Physical Properties 129
the cutting speed has no significant influence. The contact length-related specific
friction power at the flank face, P '
a
, shows a good correlation with the measured
and calculated temperatures, because the geometric conditions in the contact zone
have been taken into account. The new defined quantity P '
a
is in good agreement
with the X-ray measured residual stress state on the workpiece surface after hard
turning. The heat radiation-based temperature measurement was successfully
used to verify and establish a new process quantity, P'
a
, for surface integrity char-
acterization based on the easier to apply force measurement.
In grinding, the same problems concerning temperature values and large gradi-
ents with respect to time and space are present, further intensified by the large
number of geometrically undefined cutting edges and the almost general neces-
sity for coolants. The possible sensor techniques based on heat conduction and
heat radiation are explained in Section 4.4.3.5. An example of a successful tem-
perature measurement with different types of thermocouples during surface
grinding is shown in Figure 3.3-8 [13].
In these investigations a brazed thermal wire in a closed-circuit application and
also thin-film thermocouples evaporated to the split workpiece were tested. The
results reveal a systematic difference between the two sensor types. The tempera-
tures determined with the thin-film thermocouples are 30% lower on average
compared with the closed-circuit application, which was explained by imperfect in-
sulation and a too large brazing point for the evaporated sensor [13]. Regardless
of these differences, one major finding was the superior behavior of the vitreous
bond CBN grinding wheel compared with a conventional corundum abrasive un-
der the same grinding conditions.
The results have shown that temperature measurement in cutting or grinding
is only possible with high technical effort. The modifications of workpiece or tool
together with the financial and time investments restrict these measurements to
fundamental research and industrial use is not possible.
3 Sensors for Workpieces130
Fig. 3.3-7 Temperature measurement in hard turning based on heat radiation. Source: Schmidt [5]
3.3.3.4 Acoustic Emission Sensors
The application of acoustic emission (AE) sensors has become very popular in
many kinds of machining processes over the last two decades. AE sensors com-
bine some of the most important requirements for sensor systems such as rela-
tively low costs, no negative influence on the stiffness of the machine tool, easy to
mount and even capable of transmitting signals from rotating parts. First results
on acoustic emissions were published in the 1950s for tensile tests. Since then,
decades passed until this approach was first used to monitor cutting processes.
The mechanisms leading to acoustic emission can be deformations through dis-
locations and distorted lattice planes, twin formation of polycrystalline structures,
phase transitions, friction, crack formation, and propagation [eg, 14]. Owing to
these different types, acoustic emission appears as a burst-type signal or as contin-
uous emission. In cutting, the most important sources of acoustic emission are
friction at the rake face, friction between workpiece and tool, plastic deformation
in the shear zone, chip breakage, contact of the chip with either workpiece or cut-
ting edge, and crack formation, as shown in Figure 3.3-9 [15]. The grinding pro-
cess is characterized by the simultaneous contact of many different cutting edges,
randomly shaped, with the workpiece surface. Every single contact of a grain is as-
sumed to generate a stress pulse in the workpiece. During operation, the proper-
ties of the single grain and their overall distribution on the circumference of the
grinding wheel will change owing to the occurrence of wear. Hence many differ-
ent sources of acoustic emission have to be considered in the grinding process, as
also shown in Figure 3.3-9. A change from austenite to martensite structures in
ferrous materials also generates acoustic emission, although the energy content is
significantly lower compared with the other sources. Hence every single effect has
to be regarded as the origin of a wave front which is propagating through solid-
state bodies.
Different types of signal evaluation can be applied to the AE sensor output. The
most important quantities are root mean square value, raw acoustic emission sig-
3.3 Sensors for Physical Properties 131
Fig. 3.3-8 Temperature profiles in surface grinding with different abrasives. Source: Choi [13]
nals and frequency analysis. AE sensors were often applied to cutting, especially
turning operations [eg, 16]. In turning of hardened steel, one of the major con-
cerns is to avoid any kind of surface integrity damage such as high residual
stresses or white etching areas (see Figure 3.3-4). An AE sensor for monitoring
purposes can be applied without any problems; usually it is mounted on the
shank. Schmidt chose a position underneath the shank as close as possible to the
zone of contact (Figure 3.3-10, left). The root mean square signal of the installed
sensor was filtered in a very close frequency range between 150 and 250 kHz and
transmitted to a digital oscilloscope for further analysis. The reason for this re-
striction is the aim to separate the effect of tool wear from the influence of other
cutting parameters. By analyzing the frequency spectrum it was possible to identi-
fy the appropriate range [5]. Figure 3.3-10 (right) shows an example of the results
achievable with this strategy.
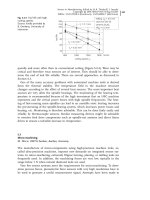
The increase in tool wear leads to an almost linear decrease in the root mean
square value, U
AE, RMS
, in the chosen frequency range. The corresponding surface
residual stress state, which was measured using the X-ray diffraction method,
shows the opposite tendency. Hence it seems to be possible to monitor the sur-
face integrity state of hard turned workpieces by analyzing the AE signal in a very
close frequency range. Further investigations are needed to evaluate the influence
of different system quantities such as machine tool, cutting insert, or workpiece
on this frequency range.
In grinding, the application of an AE sensor is more complicated than in turn-
ing. Owing to the fast rotation of the grinding wheel and most often coolant sup-
ply, there are additional sources of noise, which have a significant influence on
the measured signal. Possible positions of AE sensors in grinding are shown in
Section 4.4.3. From the first beginnings of AE applications in grinding, attempts
were made to correlate the signal with the occurrence of grinding burn. Whereas
3 Sensors for Workpieces132
Fig. 3.3-9 Sources of acoustic emission in cutting and grinding
in early investigations only extreme damage was generated for detection [17], in-
vestigations on specially prepared workpieces [18] and real parts such as cams [19]
have since been published. The studies of Klumpen [20] and Saxler [21] are direct-
ly related to the possibility of grinding burn detection with AE sensors. One fun-
damental result is that all process variations, which finally generate grinding
burn, such as increasing material removal or infeed or reduced coolant supply,
lead to an increase in the AE activity in grinding. Klumpen [20] could only identi-
fy grinding burn by applying a frequency analysis of the AE signal to determine
the inclination of the integral differences. This must be regarded as a major disad-
vantage, because a frequency analysis is usually performed after grinding. The de-
sired in-process solution would demand extremely high investment in analyzing
hardware. For this reason, Saxler [21] concentrated on the AE signal in the time
domain. In Figure 3.3-11 the major result of his work is shown.
Based on his investigations and theoretical considerations, he concluded that
the AE sensor must be mounted to the workpiece to be most sensitive to the de-
sired grinding burn detection. This is, of course, a major drawback for practical
applications. An industrial test was conducted during gear grinding of planetary
gears with an electroplated CBN-grinding wheel. With the aid of artificial neural
networks he was able to achieve a dimensionless grinding burn characteristic val-
ue from the AE values of different frequency ranges in the time domain. The
high efforts for training of the artificial neural network and the problems related
to the sensor mounting on the workpiece side must be seen as limiting factors
for wider industrial application. However, the results have clearly shown that AE
systems can be regarded as suitable process quantity sensors in both cutting and
grinding to monitor surface integrity changes.
3.3 Sensors for Physical Properties 133
Fig. 3.3-10 AE analysis for surface integrity monitoring in hard turning. Source: Schmidt [5]
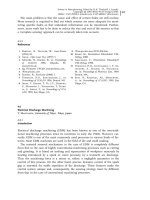
3.3.4
Sensors for Tools
The number of sensor systems which are available to be used on tools to acquire
information about the surface integrity state is very limited. In cutting, no specific
sensors are known which can be used on the tool to predict the achievable physi-
cal properties. In grinding, an appropriate sensor system must be able to measure
the micro-geometry of the tool, which is of essential importance for the genera-
tion of surface integrity characteristics. The most promising system is based on la-
ser triangulation.
Figure 3.3-12 shows the basic elements which are a laser diode with 40 mW
continuous wave (c.w.) power and a position-sensitive detector (PSD) with ampli-
fier and two lenses [22, 23]. The sensor is mounted on a two-axis stepper-drive
unit to be moved in the direction normal to the grinding wheel surface and in an
axial direction to make measurements on different traces on the grinding wheel
circumference. For the determination of macro-geometric quantities such as radial
runout, no practical limitations exist and the maximum surface speed may even
exceed 300 m/s [22]. For micro-geometric measurements the investigations have re-
vealed that the maximum speed of the grinding wheel should not exceed 20 m/s,
based on hardware and software limitations. This means that for most applications
the grinding wheel has to be decelerated for the measurement. This major draw-
back limits the practical field of application. The most interesting application for
this sensor is seen in the supervision of superabrasives, especially CBN-grinding
wheels. Their deterioration of the topography often leads to thermal damage of
the workpiece. In [24] this sensor system was intensively tested during profile
grinding of gears with an electroplated CBN-grinding wheel.
The measurement was done on the involute profile of the grinding wheel on 10
traces. A straight line approximated the measurement width, and additional tilting
3 Sensors for Workpieces134
Fig. 3.3-11 Grinding burn detection with acoustic emission. Source: Saxler [21]
of the sensor was not necessary. The measurement was done during the work-
piece changing time. Figure 3.3-13 (left) shows the setup of the investigation. On
the right a result of this sensor application is presented. The measured quantity is
the reduced peak height, R
pk
, deduced from the bearing ratio curve (see Section
4.4.4), which can be used to describe the change in the grinding wheel topogra-
phy at the grains tips. As shown, the change in trace 3 can be clearly correlated
with the occurrence of grinding burn, which was stated by nital etching and sub-
sequent metallographic and X-ray inspection. Although this result is very promis-
ing, some problems have to be taken into consideration. Measurements and simu-
lations have revealed that it is not possible to correlate the sensor roughness results
3.3 Sensors for Physical Properties 135
Fig. 3.3-12 Measurement principle of a laser triangulation system. Source: Werner [22]
Fig. 3.3-13 Grinding burn identification using a laser triangulation sensor. Source: Regent [24]
definitely with a specific wear pattern. It is essential to identify the critical point
where the unstable condition of the CBN-grinding wheel will start. Beyond this
point, significant changes in the sensor quantities in different directions are
found. Scanning of a larger area by shifting the sensor to different traces is always
necessary to register this change definitely. This is possible with the installed posi-
tioning unit, but will increase the measurement time. The protection of the sensor
against any kind of coolant or swarf is also essential. However, this sensor system is
still the only serious method to correlate quantities measured in the working space
of the machine tool on the grinding wheel with the occurrence of surface integrity
changes. It is fast; even the repeated measurements of 10 traces at reduced speed
will only take a maximum of 2 min, which is near the workpiece changing time
of five gears in a special clamping unit. For expensive CBN-grinding wheels and
high-value workpieces, this strategy offers high potential.
3.3.5
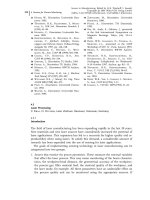
Sensors for Workpieces
The best way to investigate the influence of any cutting or grinding process on
the physical properties of the machined workpiece would be to measure directly
on the generated surface. However, so far only very few sensors are available to
meet this demand. In the following, two techniques will be described which have
the highest potential for this purpose, an eddy-current and a micro-magnetic
method. Ultrasonic techniques, which are also used for crack detection, do not
have a potential to monitor machined surfaces, because they are not able to re-
solve material changes in the first 100 lm from the surface owing to frequency
limitations [1]. This is the most important area for surface integrity properties in-
fluenced by either cutting or grinding.
3.3.5.1 Eddy-current Sensors
The principle of eddy-current measurement for crack detection is based on the
fact that cracks at the workpiece surface will disturb the eddy-current lines, which
are in the measuring area of a coil with AC excitation [25]. All kinds of conductive
materials can be tested. The penetration depth is determined by the excitation fre-
quency. Both the conductivity and permeability of the workpiece can be investi-
gated. The main application of this method is the monitoring of important mate-
rial properties such as heat treatment to insure the proper hardness and hardness
depth before succeeding operations [26]. In cutting, no application of this method
for surface integrity characterization is known.
In grinding, an eddy-current sensor was introduced to monitor the occurrence
of cracks. Figure 3.3-14 (left) shows the setup for this eddy-current-based measure-
ment used for the determination of cracks generated during profile surface grind-
ing of turbine blade roots.
Cracks generation is a special problem for the hard-to-machine materials of air-
craft engine components such as nickel-, cobalt-, and titanium-based alloys. The
3 Sensors for Workpieces136
purpose of the application was to determine cracks in the workspace of the ma-
chine tool immediately after grinding by moving a bridge with the sensor over the
ground surface [27]. Figure 3.3-14 (right) shows the result of such a measurement.
The crack was subsequently investigated with the aid of a scanning electron mi-
croscope and had a width of 2 lm. The eddy-current sensor could clearly deter-
mine this crack with a contact measurement. This size has to be regarded as the
minimum resolution of the sensor. The sensor must be positioned in a perpendic-
ular direction to the surface, because any tilting reduces the sensitivity. Thus an
additional shift option was implemented in the moving bridge. Although the mea-
surement speed was smaller than the grinding table speed, a check in the grind-
ing machine may still be acceptable because of the high security demand on
these workpieces. However, the limiting factor is the fact that only cracks in the
surface of a ground workpiece can be identified, which is of interest only for a
very limited range of materials.
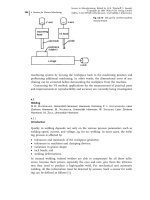
3.3.5.2 Micro-magnetic Sensors
Changes in the physical properties on machined surfaces of ferrous materials can
be determined with the aid of micro-magnetic techniques. The measuring princi-
ple is based on the fact that residual stresses, hardness values, and the structure
in sub-surface layers influence the magnetic domains of ferromagnetic materials.
Bloch walls separate adjacent ferromagnetic domains with different local magneti-
zation directions. An exciting magnetic field causes Bloch-wall motions. As a re-
sult, the total magnetization of the workpiece changes. With a small coil of con-
ductive wire at the surface of the workpiece, the change in the magnetization due
to the Bloch-wall movements can be registered as an electrical pulse. The magne-
3.3 Sensors for Physical Properties 137
Fig. 3.3-14 Eddy-current crack detection after surface grinding of turbine blades. Source: West-
kämper
tization process is characterized by the well-known hysteresis loop (Figure 3.3-15).
The presence and the distribution of elastic stresses in the material influence the
Bloch walls to find the direction of easiest orientation to the lines of magnetic
flux. Subsequently the existence of compressive stress in ferromagnetic materials
reduces the intensity of the Barkhausen noise, whereas tensile stresses will in-
crease the signal [9]. The most important quantities deduced from this signal are
the maximum amplitude of the Barkhausen noise, M
max
, and the coercivity, H
cM
.
The application of micro-magnetic technology to machined workpieces depends
on the flexibility of the sensors.
In principle, a magnetization device and a signal receiver have to be adapted to
the shape of the workpiece. The Barkhausen noise amplitude is detected with an
air coil and the coercive strength with a Hall probe. The depth of penetration can
be varied by different analyzing frequencies. Taking the magnetic properties of
hardened steel into account, the minimum achievable penetration depth is ap-
proximately 15 lm. In any case the measurement time is very short and amounts
to only a few seconds, which is one of the major advantages of this technique.
This so-called two-parameter micro-magnetic setup was further improved by add-
ing modules for the measurement of the incremental permeability, the harmonics
of the exciting field, and eddy currents [24]. The major aim of this multi-parame-
ter system was to separate further the influence of the initial material properties
from the changes due to machining operations. This improved technique was
tested on hard turned steel surfaces and on ground surfaces. In Figure 3.3-16, re-
sults from measurements on case hardened workpieces with varying tool wear of
the PCBN insert are shown [5]. A total of 50 workpieces were tested. The micro-
magnetic investigation was done in a few minutes, including workpiece handling,
whereas the X-ray investigation was performed with 20 h of pure measuring time.
The results reveal a very good correlation of the two methods, especially taking
into account that for the X-ray investigation only one measuring point at the sur-
3 Sensors for Workpieces138
Fig. 3.3-15 Micro-magnetic structure and quantities deduced from the hysteresis loop
face could be measured, whereas the micro-magnetic value represents an average
result on the circumference.
In grinding, the number of applications of this technique is higher than in
hard turning [eg, 28, 29]. In [9], a detailed investigation of the potential of the two
parameter micro-magnetic approach to characterize surface integrity states of
workpieces also with different heat treatment was given. Subsequently this tech-
nique was transferred to practical application. Figure 3.3-17 shows the results of a
large industrial test on planetary gears ground with electroplated CBN-grinding
3.3 Sensors for Physical Properties 139
Fig. 3.3-16 X-ray and micro-magnetic determined residual stresses after hard turning. Source:
Schmidt [5]
Fig. 3.3-17 Micro-magnetic surface integrity characterization of ground planetary gears. Source:
Regent [24]
wheels [23, 24]. The geometric fitting of the micro-magnetic sensor and excitation
is shown at the left in top and side views. In this case the excitation is separated
from the measuring coil and Hall element. Pneumatic cylinders are used for gear
approach and excitation clamping. On the right the results obtained over the life-
time of an electroplated wheel are shown. The Barkhausen noise amplitude is cor-
rected to consider slight changes in the excitation field. It can be seen that all
gears with identified grinding burn by nital etching are also recognized with the
micro-magnetic setup. However, in addition, gears with high M
max, corr.
values ap-
pear, which do not show up as damage when nital etching is used. A possible ex-
planation for this difference is the different penetration depths of the methods.
Nital etching gives information only about the very top layer of the workpiece and
sub-surface damage cannot be registered.
Micro-magnetic measurements can also reveal damage depending on the fre-
quency range. It should be mentioned further that the measuring time required
to scan all flanks of one gear is significantly longer than the grinding time. With
intelligent strategies or an increased number of sensors in parallel use, this time
can be shortened for suitable random testing. Totally automated measurement is
possible. In addition to successful applications of the two-parameter method, tests
with the improved multi-parameter system have also been performed for surface
grinding [24]. Furthermore, in the laboratory the first tests on in-process measure-
ments of surface integrity changes based on this micro-magnetic sensing have
been conducted for outer diameter and surface grinding [24, 30]. In Figure 3.3-18
the first results of this approach during surface grinding of steel are presented.
The sensor with integrated excitation moves on the surface behind the grinding
wheel at the chosen table speed of 8 m/min. A conventional corundum grinding
wheel was used on case hardened steel and cooling was provided by a 5% emul-
sion. Permanent contact is assured by spring loading. The X-ray measurement is
3 Sensors for Workpieces140
Fig. 3.3-18 Micro-magnetic in-process measurement of surface integrity during grinding. Source
Regent [24]
made on one point of the ground surface and the micro-magnetic result repre-
sents the average over the whole workpiece length. The deviations in the area of
compressive residual stresses and low tensile residual stresses are less than
100 MPa, and only in areas of significant damage with tensile stresses higher
than 200 MPa do the deviations increase. This can be explained by the occurrence
of cracks after grinding due to the high thermal load on the workpiece.
These cracks result from the high generated tensile stresses, which are mea-
sured inprocess, and lead to a significant release of the residual stress state for
the later performed X-ray investigation. Although further investigations on the
wear resistance of the sensor head, long-term influence of the coolant, maximum
workpiece speed, geometric restrictions, and other parameters have to be con-
ducted, this sensor offers the possibility of in-process workpiece surface integrity
measurement for the first time.
3.3 Sensors for Physical Properties 141
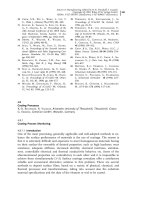
3.3.6
Reference
1 Brinksmeier, E., Habilitationsschrift; Uni-
versität Hannover, 1991.
2 Tönshoff, H.K., Spanen – Grundlagen;
Berlin: Springer, 1995.
3 König, W., Berktold, A., Koch, K. F.,
Ann. CIRP 42 (1993) 39–43.
4 Wobker, H G., Habilitationsschrift; Uni-
versität Hannover, 1997.
5 Schmidt, J., Dissertation; Universität
Hannover, 1999.
6 Field, M., Kahles, J. F., The Surface Integ-
rity of Machined and Ground High Strength
Steels, Defense Metals Information Center
Report 210; 1964, pp. 65–77.
7 Macherauch, E., Wohlfahrt, H., HTM
28 (1973) 201–211.
8 Brandt, D., Dissertation; Universität
Hannover, 1995.
9 Karpuschewski, B., Dissertation; Universi-
tät Hannover, 1995.
10 Inasaki, I., CIRP 40 (1991) 359–362.
11 Haupt, F., Seidel, T., Karpuschewski,
B., Zahnflankenschleifen Bogenverzahnter
Kegelradsätze mit CBN-Schleifscheiben,
VDI-Z 139, No. 9 (1997) 62–65.
12 ZF Friedrichshafen, Reilhofer K.G.,
Patent-Offenlegungsschrift DE 4318102,
1994.
13 Choi, H.Z., Dissertation; Universität Han-
nover, 1986.
14 Cremer, L., Heckl, M., Körperschall – Phy-
sikalische Grundlagen und Technische An-
wendungen; Berlin: Springer, 1967.
15 Dornfeld, D. A., König, W., Ketteler,
G., VDI-Ber. 988 (1993) 363–376.
16 Blum, T., Inasaki, I., J. Eng Ind. 112
(1990) 203–211.
17 Eda, H., Kishi, K., et al., Bull. Jpn. Soc.
Prec. Eng. 18 (1984) 299–304.
18 Webster, J., Marinescu, I., et al., Ann.
CIRP 43 (1994) 299–304.
19 Roberts, D. A., Leete, D.L., Sens. Rev.
(1983) 72–75.
20 Klumpen, T., Dissertation; RWTH Aachen,
1994.
21 Saxler, W., Dissertation; RWTH Aachen,
1997.
22 Werner, F., Dissertation; Universität
Hannover, 1994.
23 Tönshoff, H. K., Karpuschewski, B., Re-
gent, C., in: 30th International Symposium
on Automotive Technology and Automation
(ISATA), Florence, 16.–19. 6. 1997, Vol. 30
Mec1, pp. 373–380.
24 Regent, C., Dissertation; Universität
Hannover, 1999.
25 Cahn, R. W., Haasen, P., Kramer, E. J.
(eds.), Materials Science and Technology,
Vol. 3 A and 3 B: Electronic and Magnetic
Properties of Metals and Ceramics; Wein-
heim: VCH, 1994.
26 Förster, F., in: Höller, P., et al. (eds.),
Nondestructive Characterization of Materi-
als; Berlin: Springer, 1989, pp. 505–515.
3 Sensors for Workpieces142
27 Lange, D., in: 8. Internationales Braun-
schweiger Feinbearbeitungskolloquium, 24.–
26. 4. 1996, pp. 16/1–16/19.
28 Fix, R.M., Tiitto, K., Tiitto, S., Mater.
Eval. 48 (1990) 904–908.
29 Shaw, B. A., Hyde, T.R., Evans, J. T., in: 1st
International Conference on Barkhausen
Noise and Micromagnetic Testing, Hannover,
1–2. 9. 1998, pp. 14/1–10.
30 Tönshoff, H.K., Karpuschewski, B., et al.,
in: Moderne Schleiftechnologie, 14 May
1998, Furtwangen, pp. 7.1–7.13.