Tài liệu Cảm biến trong sản xuất P9 pdf
Bạn đang xem bản rút gọn của tài liệu. Xem và tải ngay bản đầy đủ của tài liệu tại đây (1.83 MB, 31 trang )
4.2
Metal Forming
E. Doege, F. Meiners, T. Mende, W. Strache, J. W. Yun, Institute for Metal Forming
and Metal Forming Machine Tools, University of Hannover, Germany
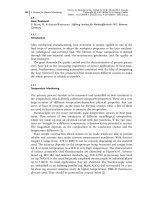
The profitable use of advanced monitoring systems is more and more integrated
in modern mass manufacturing processes since reliable equipment is available.
The idea is to improve the metal forming process due to the high availability of
tools and machines by decreasing machine setup and failure times. Therefore, it
is important to employ new sensor technologies in metal forming systems for the
observation of process signals.
4.2.1
Sensors for the Punching Process
In the last 30 years, enormous improvements have been achieved in the stamping
process concerning economic production, accuracy and possible shape of the parts
[1]. Today’s tools are more sophisticated and more expensive. The costs of a mod-
ern multi-stage tool can be more than $ US 100000 and requires constant process
monitoring to achieve high availability of the tool. This aspect is very important
for the trend of just-in-time production. Also, customer requirements for 100%
quality control can be fulfilled with indirect quality control by the process signals.
Therefore, the demand for tool safety devices and process control units is increas-
ing constantly [2]. Traditional limit switches [3] are not sufficient. The manufac-
turers’ expectations for modern process control systems are as follows:
· complete quality assurance and documentation (100% indirect product quality
control);
· protection of expensive and complex multi-stage tools against breakage and
subsequent damage;
· machine overload protection;
· detection of feeding faults;
· extended production time with no supervision (ghost shifts);
· decrease of setup times and support with stored parameters;
· fewer production stoppages by premature recognition of process disturbances;
· permanent process monitoring to support the user with process information to
permit optimal process setting;
· higher press speeds to increase productivity;
· control of existing tools;
· no sensor handling in the tooling room.
To fulfil all these requirements, the process control system should have sensors
which are sensitive enough to recognize the disturbances and they must guaran-
tee easy handling in daily production (no cables in the tool room). The signal pro-
cessing must also be very sophisticated to detect breakage, wear, and process
trends.
4 Sensors for Process Monitoring172
Sensors in Manufacturing. Edited by H.K. Tönshoff, I. Inasaki
Copyright © 2001 Wiley-VCH Verlag GmbH
ISBNs: 3-527-29558-5 (Hardcover); 3-527-60002-7 (Electronic)
4.2.1.1 Sensors and Process Signals
The most common process signals for the monitoring of the punching process
and the press load [5] are forces and acoustic emissions. Both signals include pro-
cess information, which can be controlled or analyzed by process monitoring de-
vices. In addition, these devices need one of the following signals as a reference
basis for the monitoring or analysis:
· time;
· crankshaft angle;
· slide path.
Normally the time signal is used as the reference base for process monitoring/
control. However, the time base depends on the press speed. If the press changes
speed and if the signal is controlled by the window or the tolerance band tech-
nique [6, 7], the time-based signal will vary and could cause a press stop. In this
case a crankshaft resolver with a high resolution at the lower dead center will be
used. A linear distance sensor at the press slide can alternatively be used as a ba-
sis for the process signals. The disadvantage of the linear distance sensor is the
low resolution at the lower dead center, because of the sine shape of the slide
path. In Figure 4.2-1 the typical process signals of a punching process are shown.
Acoustic Emission Sensors
Short-term disturbances (tool breakage or cracks in the product material) can be
easily detected by acoustic emission sensors [6–8]. This sudden change in the
press load produces an acoustic emission signal up to 150 kHz, traveling through
the tool and the machine. Most importantly, acoustic emission sensors should be
placed as close as possible to the metal forming process to avoid disturbances (the
4.2 Metal Forming 173
Fig. 4.2-1 Typical signals of the punching process
machine’s vibrations). Each mechanical contact (gap) between the forming pro-
cess and the acoustic emission sensors filters the acoustic emission spectrum as a
low pass. Therefore, the acoustic emission sensors should be placed into the tool
[6] or next to the tool. In Figure 4.2-2 a piezoelectric sensor is shown with a very
wide transmission band, which enables the sensor to measure acoustic emission
signals in the 100 kHz range, because the piezoelectric element is mounted in a
damping mass with no seismic mass (no resonance).
Force Sensors
The most important process signals are the signals of the force sensors (see Fig-
ure 4.2-3), which are placed in the structure or on the surface. Piezoelectric force
sensors or piezoelectric transverse measuring pins are mostly used in the struc-
ture. On the surface the common devices are piezoelectric or resistive strain
gages. A later calibration of all these sensors is necessary, because the strain and
the sensitivity of the sensors depend on the surrounded structure of the machine
or tool. Existing monitoring systems are mostly based on simple force monitor-
ing. The force signal is mainly used for process monitoring. When the adjusted
force limit is exceeded, the machine will automatically be stopped by the emer-
gency stop.
4.2.1.2 Sensor Locations
In Figure 4.2-4 the most common sensor locations for the punching process con-
trol are shown. Acoustic emission sensors must be placed very close to the pro-
cess. Typical locations for the acoustic emission sensors are the upper and the
lower tool or the slide and the table. A greater distance to the process will in-
crease the noise signal by the press.
The force signal is normally measured by sensors which are placed in the press
frame, the connecting rods, the slide or directly in the tool [9]. Some presses are
equipped by the press manufacturer with sensors to protect the press against
4 Sensors for Process Monitoring174
Fig. 4.2-2 Acoustic emission sensor (Kistler Instrumente AG)
force overload. The distance between these sensors, which are placed in/on the
press frame or the connecting rod, and the forming process is too large to detect
more than the force overload. The signals of these force sensors and the acoustic
emission sensor underlie many disturbances, eg, the press drive and vibrations.
The best sensor signals can be obtained when the force sensors are directly placed
in the tool (see Figure 4.2-5). The second best solution for the signal quality is to
place the force sensors directly above or under the tool. See the sensor plate and
table locations in Figure 4.2-4.
4.2 Metal Forming 175
Fig. 4.2-3 Force and strain sensors for process control (Kistler Instrumente AG)
Fig. 4.2-4 Possible sensor locations at a forming press [9]
4.2.1.3 Sensor Applications
In this section, sensor applications, which are close to the forming process, will
be described in detail. The integration into the top plate of the upper tool is
shown in Figure 4.2-5. With this application a single forming operation can be
perfectly monitored. The influence of a neighboring forming operation on the
measured force signal is very low. Typical sensors for this application are piezo-
electric transverse measuring pins or force rings, because the sensors are placed
in the structure. The total or a part of the forming operation force is transmitted
and measured by the sensors. A disadvantage is the large number of expensive
sensors in a tool and the bad tool handling in daily production. The very rough
environment in the tool shop also complicates the handling of the tools with sen-
sitive sensor cables.
Better tool handling and lower sensor costs can be achieved when the sensors
are integrated into machine parts or remain at the press structure. One solution,
which was presented by Terzyk et al. [6], is the integration of force sensors into
the slots of the press table. In Figure 4.2-6, two slot force sensors are shown,
4 Sensors for Process Monitoring176
Fig. 4.2-5 Force sensors integrated into the upper tool [6]
Fig. 4.2-6 Table slot force sensors [6]
which are placed under the lower tool. The advantage of this solution is the high
flexibility and the integration into existing processes, because the shape of the ta-
ble slots is standardized.
On the other hand, the slots must be cleaned and must have straight surfaces.
These sensors cannot be placed in the center of the tool, because there are holes
in the table in this area for scrap transportation.
A good combination of process-sensitive signals and good handling is achieved
by a multi-sensor plate, which is placed between the slide and the upper tool. In
Figure 4.2-7 the scheme of the multi-sensor plate is presented. The multi-sensor
plate consists of a frame plate, which has the same shape as the slide, and several
sensor cassettes, which contain force and acoustic emission sensors. The follow-
ing requirements are the basis for the development of the system:
· easy handling in the production workshop;
· short distance to the process;
· integration of several force sensors for detailed process monitoring;
· connection devices for additional sensors;
· improved process control by a combined force/acoustic emission monitoring;
· modular design for high flexibility;
· integration into existing tool-press systems.
Easy handling is solved by using a modular cassette system, which is fixed by a
frame plate and two guiding rails to the press slide (Figure 4.2-7). During a tool
change the sensors will remain at the slide. All cables between the cassettes and
the docking station are integrated in the frame plate. Because of the modular de-
sign, the multi-sensor plate can easily be adapted to the requirements of the user.
The number and the locations of the standardized sensor cassettes can be
changed. The docking station houses the charge amplifier and the connectors for
additional sensors and is mounted on the frame plate. The frame plate has a
height of 25 mm and the same shape as the slide, so that the tools can be fixed to
the slide in the usual way.
4.2 Metal Forming 177
Fig. 4.2-7 Scheme of the multi-sensor plate [9]
A multi-sensor plate with four cassettes and the docking station for a 500 kN
press is shown in Figure 4.2-8.
Some typical process signals measured with the multi-sensor plate are pre-
sented below. A production tool with 11 forming operations (cutting, deep draw-
ing, stamping) separated into four modules will be analyzed by means of the mul-
ti-sensor plate. The workpiece, the tool setup, the force and acoustic emission sig-
nals are shown in Figure 4.2-9. The two force cassettes of the multi-sensor plate
are placed above the first and above the last (fourth) module to demonstrate the
local resolution of the system. The acoustic emission cassette is placed in the mid-
dle of the tool.
The measured signals contain information on the cutting/forming process, on
the blank holder and on the tool stop reaction. The contact of the blank holder oc-
curs at point A in the force diagram and at point 1 in the acoustic emission dia-
gram. Characteristic cutting operations can be identified at B/2 and C/3. The re-
sulting cutting impact is very significant in the acoustic emission signal (peaks 2
and 3). Owing to an incorrect slide height (too tight), the upper tool is running
on the stops of the lower tool (impact at D/4). The tight tool mounting causes an
increase in the force signals up to point E. The force signal above the first mod-
ule is higher than that above the last module, because the stops are in the first
two modules of the tool (four modules). The lower dead center is reached at point
E (highest force signal). The lift-off of the stops and of the blank holder occurs at
the moments F/5 and G/6. The force curve is evidence for the incorrect adjusted
slide height (too tight).
The correlation between the force signals and the acoustic emissions in the dia-
grams is significant and the combination of the two signals permits the identifica-
tion of different cutting/forming operations.
4 Sensors for Process Monitoring178
Fig. 4.2-8 Multi-sensor plate for a 500 kN press
4.2 Metal Forming 179
Fig. 4.2-9 Force and acoustic emission signals of a modular metal forming tool measured with the multi-sensor
plate for a 500 kN press
The sensor signals should be significant so that the user can ‘see and under-
stand’ the complex forming operation. Especially for the tool setup the stored sig-
nals of previous setups can be very helpful by using the same setup and therefore
saving time and achieving the same product quality.
A tight slide position causes unnecessary high press forces in the lower dead
center and product defects. This load decreases the tool and the machine lifetime
and increases the energy consumption. The signals in Figure 4.2-10 were mea-
sured in a press shop with a production tool. At the normal slide height a force
signal of a cutting operation is measured before the lower dead center. At the
tight setup of the tool (0.6 mm lower) a significant second peak occurs at the low-
er dead center. The stored signals of the force cassettes enable the user to setup
the tool properly with less load for the machine and the tool.
Another important aspect for the monitoring of the punching process is the de-
tection of tool breakage. For this detection acoustic emission sensors should be
used, because the reaction of the tool on overload and breakage is more signifi-
cant in the acoustic emission signal than in the force signal. The force com-
presses the punch and energy will be stored in the punch. After the breakage
(overload), the stored energy is released as acoustic emissions to the environment
like a compressed spring. These acoustic emissions have significant amplitudes
and can easily be detected in a ‘silent moment’ of the process.
In Figure 4.2-11 the signals of force and acoustic emissions of a normal punch
and of a breaking punch are shown. There are only slight differences in the force
signals. Especially the ‘small valley’ around 60 ms cannot be found in the signal
4 Sensors for Process Monitoring180
Fig. 4.2-10 Force signals of normal
and incorrect tool setup
of the breaking punch. This is the moment when the punch moves upwards in
the mold. The acoustic emission signal is more significant. The punch causes a
second peak at the moment of breakage. This event can easily be detected with a
narrow tolerance band [6] around the ‘normal’ curve.
4.2.2
Sensors for the Sheet Metal Forming Process
Sheet metal forming is a complex process which is affected by a manifold of in-
fluences. The high demands to quality and cost efficiency at the production of
sheet metal components are increasing continuously. These high requirements
can only be met with optimum designed and faultless manufacturing processes.
Hence it is necessary to have fundamental knowledge about the behavior of the
used materials and machines as well as the possibilities for the control of the ac-
tual process parameters. Furthermore it is of great importance to control the
course of events during the forming operation because the process affecting pa-
rameters cannot be kept constant for any space of time. Material and tool proper-
ties as well as machine parameters are subjected to variations which are affecting
the process stability adversely. Improvements can be achieved by the on-line mea-
surement of indirect and direct process describing parameters and their transfer
to a process monitoring system.
4.2 Metal Forming 181
Fig. 4.2-11 Force and acoustic emission signals of a breaking punch
4.2.2.1 Deep Drawing Process and Signals
Sheet metal forming processes are affected by a manifold of influences. Fig-
ure 4.2-12 shows the different succeeding stages of the deep drawing process.
Examples of monitorable signals are material properties such as tensile
strength, anisotropy, ductility, lubrication dose, wear of tools, and adjustment of
forming machines. Changes in these parameters cause several failure modes such
as cracks, wrinkles, etc., and also long process starting times, production insecur-
ity and deviations from the required quality [11]. Differences in material charges
often lead to a change of ductility, formability, and surface properties. The periph-
ery affects the forming operation by variations within the straightening process,
the accuracy of blanking, and the blank position in the drawing die. Also, changes
in lubrication, tool wear, and different tool positions with respect to the press are
unavoidable. The forming press affects the drawing result by changes in ram tilt,
deflection of the press table, frame deformation, and deviations in the adjustment
of punch speed and die cushion force.
4.2.2.2 Material Properties
In sheet metal forming, the working accuracy depends on mechanical properties
such as tensile strength, normal anisotropy, and hardening exponent. These pa-
rameters fluctuate from coil to coil and charge in the ranges of the specified toler-
ances. The increasing standard quality requirements for the process and products
demand a testing method which is capable of monitoring these material proper-
ties on-line and prior to the deep drawing process. Applying the magnetoinductive
4 Sensors for Process Monitoring182
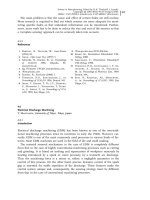
Fig. 4.2-12 Deep drawing process chain and monitorable signals
testing method, a sensor is inserted into the process chain after reeling off the
blank from a coil. The sensor head is held at a defined distance above the sheet
material and an exciting signal is brought to a magnetic coil to induce a magnetic
field in the material (Figure 4.2-13).
The signals received mainly depend on the microstructural composition such as
grain size, grain orientation, alloying elements, and dislocation density. Further,
the resulting electromagnetic properties are correlated with mechanical parame-
ters which were determined previously in tensile tests. The dependences on the
properties are shown in Figure 4.2-14.
By using correlation statistics, a multiple regression equation allows the predic-
tion of mechanical properties directly from the magnetoinductive measurements
4.2 Metal Forming 183
Fig. 4.2-13 Determination of the magneto-inductive signal parameters [12]
Fig. 4.2-14 Dependences on magnetic, material, and mechanical properties
and nondestructive testing method to avoid wrinkles and cracks caused by toler-
ance deviations in the sheet quality.
4.2.2.3 Lubrication
The lubrication properties affect the formability during the deep drawing process.
The importance of control and analysis of the lubrication properties has signifi-
cantly increased in pressing processes owing to the introduction of new genera-
tions of automatic transfer presses. The control of incoming material gives possi-
bilities to reject the material before further processing them. The yield of the
pressing process will increase, giving savings of material and production costs
[13].
Pressforming processes require uniformity of oil films on the metal surface.
During deep drawing the oil film separates the sheet metal from the die to allow
the material to flow constantly between blankholder and die. The use of oil avoids
cold welding of the steel on the active tool surfaces which can cause galling and
passing of the friction force limit. As a result, the deep drawing process fails ow-
ing to cracks in the material. Galling means the formation of cold welds between
blank sheet material, especially stainless steel and aluminium alloys with die
material at high local pressures. During sliding these welds shear off and cause
scratches in the material. Another important process parameter is the necessary
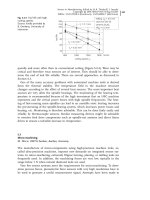
blankholder force. This force is affected directly by the friction coefficient which
depends on the quantity of the lubricant as shown in Figure 4.2-15.
In deep drawing processes, the blankholder force will be kept at a defined level
to reach a defined surface pressing. Differences in the amount of lubrication
cause deviations from the acceptable tolerance zone. For an increased amount of
4 Sensors for Process Monitoring184
Fig. 4.2-15 3D tolerance zone with inter-
dependence of lubrication, blankholder
force, and drawing distance [14]
lubrication the process will fail owing to wrinkles, whereas for reduced amounts
the deep drawing part will tear off.
A portable sensor based on high-resolution infrared spectrometry has been de-
veloped for the measurement of oil film thickness on metal surfaces. This light-
weight hand-held device is intended for use in rolling mills and sheet metal engi-
neering workshops. The sensor permits the measurement of thin oil films and is
useful for optimizing the thickness of oil coatings or pressforming lubricants. Fig-
ure 4.2-16 shows a schematic diagram of the analyzer, a two-part system consist-
ing of a measurement head and data collection unit. The analytical measurement
principle is based on the absorption of infrared radiation by hydrocarbons, the
common constituent in all oils.
The optical measurement head includes a compact multichannel infrared analy-
zer, electronics, and an LCD display. The optics, mechanical parts, light source,
and multichannel detector electronics are integrated into the measurement head
to provide stable, high-resolution analyses in a production environment. A control
unit includes a data processing unit, LCD display, keypad, and PC interface. The
control unit collects measurement data and calculates oil amounts in terms of
weight per unit area by comparing measured data with pre-calibration curves
stored in memory.
The measurement is performed by placing the sensor head on the metal sur-
face (Figure 4.2-17). Spacer pins at the measurement head stabilize the fixed dis-
tance between the measuring head and the surface. After triggering, the mea-
sured amount of oil is displayed on both the measurement and control units. The
actual result is derived as an average value from several sub-results measured at
different points on the surface.
Owing to optical differences in the surface texture of materials such as cold-
rolled and hot-rolled steel, copper, and aluminium, the analyzer is calibrated for
the type of surface to be measured. Calibration also eliminates effects caused by
possible differences in oil quality. It is recommended that each calibration is
made using the same type of surface and oil as is expected in actual measure-
ment. The repeatability of the analyzer, which can be expressed by the standard
deviation of readings in a single-point measurement, depends on the oil film
thickness. In the case of cleaned cold-rolled steel the standard deviation is of the
4.2 Metal Forming 185
Fig. 4.2-16 Schematic diagram of the infrared analyzer
order of 1 g/m
2
. The influence of surface textures increases the standard deviation
when measurements are performed at separate points on the surface.
4.2.2.4 In-Process Control for the Deep Drawing Process
Nowadays, deep drawing processes are controlled on the basis of predetermined
static values. Considering the heavy demands on the quality of deep drawn com-
ponents and low production costs, it is necessary to observe process-influencing
parameters. In a first step, higher process security can be obtained with the practi-
cal operation of multiple sensors located directly in the drawing process.
For process monitoring, direct process-based and time-dependent information
for the characterization of the process course have to be available. This is very dif-
ficult because the forming takes place in closed tools at high forces. Therefore, it
is not possible to react automatically to parameter changes which occur, eg, with
the use of another coil with different forming or surface properties [15].
Flange Insertion Sensor
For the consideration of the deep drawing process, the measurement of the flange
insertion offers information which contains a reliable prediction of the progress
of the deep drawing process and further of the part quality. A flange insertion
sensor has been developed to measure the flange insertion distance and to draw
conclusions regarding stress and strain [16].
The sensor consists of an inductive position sensor with a thin metal tongue at
the top. The tongue has a thickness of 0.5 mm and is brought into the gap be-
tween blankholder and die to touch the outer edge of the blank sheet from the be-
ginning to the end of the deep drawing process (Figure 4.2-18). The flange inser-
tion is measured over the drawing distance and can be used to detect a deviation
from the tolerance field describing the non-failure area. Deviations can lead to
wrinkles and cracks in the drawing part.
4 Sensors for Process Monitoring186
Fig. 4.2-17 Infrared sensor head placed on the metal surface
Wrinkle Sensor
With the combination of the flange insertion sensor and the wrinkle sensor, a
more accurate prediction of the failure of the drawing process can be designed.
Wrinkles develop at high radial tensile stress and tangential compression stress in
the flange. With the acting normal pressure the blankholder avoids buckling of
the material. The wrinkle sensor consists of two position sensors that detect the
distance between blankholder and die (Figure 4.2-19).
The development of wrinkles can be detected by the increase in the gap be-
tween the two sensors. The wrinkle sensor is a good addition to the flange inser-
tion sensor because it can observe the top tolerance border of the wrinkle develop-
ment as a function of the flange insertion distance during the deep drawing pro-
cess (Figure 4.2-18).
4.2 Metal Forming 187
Fig. 4.2-18 Flange insertion sensor in deep drawing tool [17]
Fig. 4.2-19 Wrinkle sensor [17]
Roller Ball Sensor
An analysis of drawing operations shows that the material flow can be identified
as a direct value for the characterization of the forming process [18]. The material
flow can be defined as the dynamic local displacement of the material during the
forming operation which allows direct conclusions about the failure mode cracks,
necks, and wrinkles. Based on the material flow, it is possible to calculate the
quality characteristics thickness and strain distribution of the drawing part. Addi-
tionally, the motion of the welding seam for tailored blanking can be investigated
[19].
The material flow depends on all affecting influences of the forming process
such as the tribological system, the machine, and material conditions. Thus, the
material flow is the essential process providing information for deep drawing.
Therefore, the practical on-line measurement of the material flow is important for
the realization of a process monitoring system. The direct assessment of the mate-
rial flow can be realized with a measurement concept called the roller ball sensor.
With this sensor principle, it is possible to measure the direction, velocity, and dis-
tance of the material movement during the forming process. The sensor works
with the same principle as a computer mouse, which detects relative motions
with a ball rolling over a surface (Figure 4.2-20).
4 Sensors for Process Monitoring188
Fig. 4.2-20 Roller ball sensor [20]
The integration of multiple sensors into the drawing tool at positions which are
critical for the forming operation leads to the recording of detailed measurement
data. Over the circumference of a drawing part, it is useful to place some sensors
at the edges and some in the straight areas (Figure 4.2-21).
The sensors can be located in the blank holder in front of the drawing radius
and also in the drawing die behind the drawing radius through bore holes with a
diameter of about 3 to 6 mm into the active surfaces of the tool without causing
scratches on the drawing parts. Figure 4.2-22 shows as an example a measure-
ment record of the material flow obtained with a rectangular drawing part.
4.2 Metal Forming 189
Fig. 4.2-21 Position of roller ball sensors in the deep drawing tool [20]
Fig. 4.2-22 Example of a measurement record of the material flow [20]
The radial scale of the diagram corresponds to the material flow distance, the
abscissa to the radial distance, and the ordinate to the tangential distance. Also, a
velocity vector of the material movement and the drawing depth are assigned to
each material flow distance. Therefore, the curve represents the entire material
movement on the sensor location during the drawing operation. A straight
material flow, orthogonal to the drawing border, corresponds in the record to a
straight line in the 0 8 direction. The continuous positive angle of the measure-
ment curve illustrated shows that the material flows from the edge of the drawing
part into the straight side. The decreasing angle means that the lateral material
movement becomes smaller with increasing drawing depth. A greater difference
between material flow distance and drawing depth affects in a higher plastic
strain of the material, which could be detected in the sensor area.
The material flow offers further possibilities for evaluation and for monitoring
of the drawing process. With the installation of several sensors in the flange, it is
possible to measure the field of velocity from the material flow. This vector field
is the basis for the calculation of the material deformation. The vector gradient
will be derived from the field of velocity which represents the change in the veloc-
ity vector between different positions inside the field. The vector gradient can be
split up into a symmetric and an antisymmetric part. The antisymmetric part is
equivalent to the rigid body motion of the material and the symmetric part de-
scribes the local deformation. The tensor of strain rate is calculated and the effec-
tive strain rate according to von Mises can be determined. Numerical integration
over time leads to the distribution of the effective strain in the flange and the wall
of the drawing part (Figure 4.2-23). This graph shows the high and low stressed
4 Sensors for Process Monitoring190
Fig. 4.2-23 Monitoring of the effective strain at a deep drawing part [20]
areas of the deep drawing part and offers the possibility of judging the failure or
success of the process.
4.2.3
Sensors for the Forging Process
Whenever high strength and surface quality of massive components are required,
forging parts are used. Owing to the manufacturing procedure, these parts show
a more regular structure than cast components and a favorable uninterrupted fi-
ber orientation in comparison with components manufactured in machining pro-
cesses. Therefore, forging parts have the best mechanical properties.
The operating sequence of the forging process is shown in Figure 4.2-24
[21, 22]. The entire sequence can be divided into three main sections: forming
(cutting, heating, forming, and clipping), heat treatment, and verification (clean-
ing and testing). Also, division into pre-process (cutting, heating), in-process
(forming, clipping) and post-process (heat treatment, cleaning, and testing) is pos-
sible. There are processes within these main sections that do not necessarily have
to take place, eg, clipping operation for precision-forged parts [23–26].
4.2.3.1 Sensors Used in Forging Processes
In order to achieve high-standard forging parts and at the same time reproducible
parts in large amounts, a number of part measurements have to be taken. They
have to be controlled throughout the process. According to the forging process
shown in Figure 4.2-24, Figure 4.2-25 shows the necessary measurements before
the deformation process (slug mass and slug temperature) and during the defor-
4.2 Metal Forming 191
Fig. 4.2-24 Operating sequence of the forging process
mation process (forming force, ejector force, stopper force, tool temperature, ram
path, and frame force).
The established measurements show those process parameters by means of
which a judgement about the process and the process results is possible. These
characteristic process-describing values are force, temperature, and pressure. They
must be measured by adequate sensor equipment.
Slug Temperature and Mass
Before the heating process, the slug mass is weighed with a highly accurate electron-
ic scale (Figure 4.2-26, left) and the signals are transferred digitally to a measuring
computer. The temperature of the heated slug is measured without contact before
the forging process. For this measuring operation a quotient pyrometric system
(Figure 4.2-26, center) or an infrared thermoelement (Figure 4.2-26, right) is used.
Depending on the construction of these sensors, temperatures between –45 and
+3000 8C can be measured with an accuracy of ± 1% of the measuring result. The
determination of the temperature is effected by the measurement of the optical ra-
diation capacity depending on the temperature that is taken by a test object in the
spectral region. Should the measured temperature be outside a previously defined
range of tolerance, the affected slug will not be taken for the subsequent forging
process.
Forces
The total load on the press, the frame force, is determined via strain gages (com-
pare Figure 4.2-3) on the press frame. They consist of a meander-like measuring
lattice in a thin carrier foil and transform strains into a modification of the elec-
tric resistance. Strain control techniques supply information about deformation
4 Sensors for Process Monitoring192
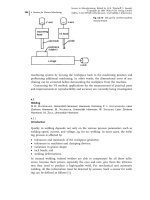
Fig. 4.2-25 Schematic diagram of useful measurements in forging processes
characteristics and the state of stresses in parts. They allow the realization of da-
magable force transducers (force measuring ring) and weighing techniques.
Common forging processes have a frame force that corresponds to the load of
the tool. For the precision forging process by means of closed dies [21, 26], the
frame force is the total of forming and closing force (compare Figure 4.2-32).
To measure the forming force a force sensor with the above mentioned measur-
ing principle according to Figure 4.2-3 is employed.
The stopper force is also determined by strain gages. The strain gages are con-
nected to a full Wheatstone bridge to compensate for thermal effects by active and
passive strain gages.
The determination of the ejector force, required to eject the forged part, is car-
ried out by measuring the pressure of the hydraulic ejector system. Therefore, a
piezoelectric pressure gage is employed. When a force acts on the piezoelectric
crystal, positive and negative grid points are offset. This causes a change of the
amount of electricity on the crystal surface as a function of force. These piezoelec-
tric pressure gages are shown on the left in Figure 4.2-3.
Tool Temperature
The temperature of the tools is measured with contact by means of thermoelectric
couples. The most frequently used thermoelectric couples belong to type K based
on NiCr-Ni. These thermoelectric couples allow the measurement of temperatures
in a range from –200 to +13728C. They consist of two nickel cables, one includ-
ing 10% chromium and the other including 5% aluminium and silver. At their
ends they are joined by soldering or welding. Thus, a thermocouple has two junc-
tion points (see Figure 4.2-27).
One junction point is called the hot junction (spot mark) and designated
T
Hot-Junction
and the other junction point is called the cold junction (comparison
mark) and designated T
Cold-Junction
. When the hot junction and cold junction are
heated to different temperatures, a potential difference U
PD
is obtained that is
proportional to the temperature difference between the hot and cold junctions.
4.2 Metal Forming 193
Fig. 4.2-26 Electronic scale (left) from Kilomatic GmbH, pyrometric meter (center) from Land
Infrarot GmbH and infrared thermoelement (right) from ASM GmbH [27–29]
Ram Path
The ram path is a reference value to represent forces in diagrams. It can also be
displayed as a function of time and is determined by an inductive distance gage.
Inductive distance gages make use of the influence of induction depending on
the distance of coil systems (AC) and caused by the displacement of iron cores
(principle of solenoid plunger). A distance accuracy of 10 lm and better can be
achieved. Measuring lengths are from 0.1 to several hundred mm. The Figure 4.2-
28 (right) shows different constructions of inductive distance gages with different
measuring lengths from 0.25 to 470 mm and a temperature stability up to 600 8C.
After having given an extensive description of the different sensors to deter-
mine the necessary measuring variables and a brief explanation of the general
measuring principles for the sensors used, the following sub-sections deal with
the locations for the sensors and the boundaries that have to be taken into ac-
count for mounting and measurement. Furthermore, representative measuring re-
sults will be presented and interpreted.
4 Sensors for Process Monitoring194
Fig. 4.2-27 Schematic diagram
of the measuring principle of
a thermoelectric couple
Fig. 4.2-28 Piezoelectric pressure gages (left) and inductive distance gages (right), all from ASM
GmbH [29]
4.2.3.2 Sensor Application and Boundaries
Slug Temperature and Mass
For determining the slug mass and slug temperature, the sensors have to be
placed in such a way that measuring the corresponding variables does not cause
unnecessary delays in handling.
The slug mass is determined before heating. In this context, not the slug mass but
the volume of the slug is the essential variable for the process to be monitored. The
volume can be calculated from slug mass and slug density. Depending on the for-
ging technique, variations of the volume within a range of ±0.5% can be ob-
served. These high demands on mass accuracy have to be met for precision forging.
After heating the slugs, the slug temperature is measured without contact im-
mediately before loading the die. For this the pyrometric meter is mounted on a
plate with a swiveling ball joint and is aligned with the hot slug at an approxi-
mate distance of 1 m.
The locations for mounting the sensors which are used to measure the vari-
ables in the process, ie, forces, tool temperature, and ram path, are shown sche-
matically in Figure 4.2-29.
Forces
To determine the frame force and stopper force, the strain gages are cemented di-
rectly on to the frame or the stopper, respectively. Two special package systems
are employed for cementing. Owing to the loss of adhesion of common cements
at temperatures higher than 80–120 8C, these temperatures must not be exceeded.
Lower temperatures are valid for moving spot marks whereas static spot marks
can withstand higher temperatures. Special heat-resistant cements for tempera-
tures higher than 1208C are available but the cement and also the cure technique
have to meet very exact requirements.
4.2 Metal Forming 195
Fig. 4.2-29 Tool system with integrated sensors
Die Set
Forming Force
(Strain Gage)
Frame Force
(Strain Gage)
Tool Temperature
(Thermoelectric
Couple)
Stopper Force
(Strain Gage)
Ram Path
(Inductive Distance
Gage)
Ejector Force
(Piezoelectric Pressure
Gage)
To determine the forming force as process-oriented as possible, the force sensor
is integrated into the force flux of the forming process. On account of the high
slug temperatures and the tool heating necessary for some processes, there are
high temperatures in the tool system with integrated force sensors. Cooling de-
vices are placed between the heated tool and force sensor to protect the strain
gages of the force sensor from unacceptable temperatures.
All strain gages are connected to a full Wheatstone bridge to compensate for
thermal effects by active and passive strain gages.
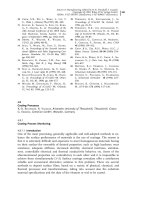
Among others, the tool system shown in Figure 4.2-30 demonstrates the force
sensor integrated into the flux of the forming force and the necessary cooling de-
vice.
The mounting of the piezoelectric pressure gage can also be seen in Figure 4.2-
30. This sensor belongs to the ejector of the press. The mode of mounting the
sensor is specified by the press manufacturer and a change is not necessary.
4 Sensors for Process Monitoring196
Fig. 4.2-30 Tool system for precision forging with force sensor to determine the forming force
and pressure gage to determine the ejector force
Force Sensor
Piezoelectric
Pressure Gage