Tương quan giữa quy hoạch sử dụng đất và phát triển kinh tế xã hội tại huyện Mai Châu, tỉnh Hòa Bình docx
Bạn đang xem bản rút gọn của tài liệu. Xem và tải ngay bản đầy đủ của tài liệu tại đây (219.66 KB, 11 trang )
J. Sci. & Devel., Vol. 11, No. 3: 353
-
363
T
ạ
p chí Khoa h
ọ
c và Phát tri
ể
n 201
3,
t
ậ
p 1
1
, s
ố
3
:
353
-
363
www.hua.edu.vn
353
CORRELATION BETWEEN LAND USE PLANNING AND SOCIO-ECONOMIC DEVELOPMENT
IN MAICHAU DISTRICT, HOABINH PROVINCE
Đỗ Văn Nhạ
1
, Phạm Bích Tuấn
1
, Raine Marggraf
2
1
Department of Land Use Planning, Faculty of Natural Resources and Environment, Hanoi University
of Agriculture - Vietnam;
2
Georg-August-University Göttingen, Germany
Email:
Received date: 18.04.2013 Accepted date: 20.06.2013
ABSTRACT
Land Use Planning (LUP) is a potential solution for sustainable use of land in the long-run by optimizing the
effective use of land resources. However, the vital role of Land Use Planning in socio-economic development needs
to be analysed in a specific area. This is an important background task. In a transition country and emerging
economy like Vietnam, it is a priori not clear, which force LUP actually exerts on actual development. Because of the
high priority that the Vietnamese government places upon economic development, it is conceivable that economic
forces exert a much stronger influence on plan. If there is strong indication that actual development is not correlated
to plans, LUP will be a lost cause from an economic point of view. More complex LUP would only generate more
costs without possibly resulting in any positive change. If, in contrast, a strong influence can be documented,
confidence in the entire LUP process will be strengthened.
Keywords: Correlation, Land Use Planning (LUP), socio-economic development.
Tương quan giữa quy hoạch sử dụng đất và phát triển kinh tế xã hội
tại huyện Mai Châu, tỉnh Hòa Bình
TÓM TẮT
Quy hoạch sử dụng đất là một trong những giải pháp quan trọng trong việc sử dụng tài nguyên đất hiệu quả và
bền vững. Bên cạnh đó, vai trò của quy hoạch sử dụng đất đối với phát triển kinh tế xã hội cần được nghiên cứu,
phân tích tại các vùng cụ thể. Việt Nam đang trong quá trình chuyển đổi nền kinh tế nên nhiều hoạt động phát triển
có sự đan xen, trọng tâm của sự phát triển phụ thuộc vào nhiều yếu tố, do đó tính ổn định bị hạn chế. Những năm
qua, việc ưu tiên cho phát triển kinh tế đã được cụ thể trong quy hoạch sử dụng đất và nó ảnh hưởng trực tiếp tới
việc bố trí sử dụng đất trong các phương án quy hoạch. Vấn đề đặt ra là kết quả phát triển kinh tế xã hội đạt được
của địa phương có tương quan với sự thay đổi sử dụng đất trong phương án quy hoạch đề ra không? Nếu không
tương quan tức là quy hoạch sử dụng đất không có tác động hoặc ít tác động tới thực tiễn phát triển kinh tế xã hội
của địa phương, dẫn đến sự lãng phí trong công tác quy hoạch sử dụng đất. Ngược lại, nếu mối tương quan đó
được xác định, thì vai trò của quy hoạch sử dụng đất đối với phát triển của các địa phương được xác lập và việc
nâng cao chất lượng quy hoạch sử dụng đất được quan tâm.
Từ khóa: Phát triển kinh tế xã hội, quy hoạch sử dụng đất, tương quan.
1. INTRODUCTION
Land Use Planning (LUP) is a systematic
assessment of the potential of land and water
resources subject to economic and social
conditions in order to select suitable land use
options. It should account for current land use
needs, as well as safeguarding resources for
future use (FAO, 1993). Therefore, LUP can be
considered as one of the most important
approaches for long-term sustainable
development at both the regional and national
levels. Based on different development
scenarios, LUP shall help groups of
stakeholders to organize the utilisation of land
resources in a way that fosters socio-economic
Correlation between land use planning and socio-economic development in Maichau district, Hoabinh province
354
development (Counsell & Haughton, 2006). LUP
is understood as the planning for the allocation
of activities to land areas to benefit human kind
(Crowley et al., 1975). In this regard, LUP can
contribute significantly to economic
development in the future, by systematically
shaping industrialization and urbanization,
both of which are major driving forces
contributing to land-use change (Long et al.,
2007). In addition, a systematic LUP is able to
contribute positively to sustainable
development within agricultural landscapes,
particularly in frontier landscapes. This is
particularly important in the rural areas of
developing countries where the population
depends mostly on agricultural income
(Counsell & Haughton, 2006). Moreover, LUP
needs to form a “bridge” connecting to different
scales from national to commune level to
facilitate sustainable development in public
administration hierarchies (Bristow, 1981;
Kelly, 2004: p43).
In Vietnam, the economy has changed
significantly from a bureaucratic and centralized
planning economy to the market-oriented system
after the opening of the country since 1986. The
average annual GDP growth was very high (7.3%
from 1995 to 2005) (WB, 2008). The economic
transition has resulted in profound changes in
the organization of different sectors of the
Vietnamese economy. Associated with the
changes of organization, LUP in Vietnam has
become more helpful with the plans being less
rigid and taking into account market factors
(Nguyen Quang, 2003: p7-9). Land Use Planning
and plans in Vietnam is one of the 13 contents of
State management on land (Article 6, Land law
2003) (Anonymous, 2003). LUP divides and
allocates land for specific purposes and
development among different sectors. Not only is
it the spatial plan in the country, but there are
also urban development plans, agriculture
development plans, forest planning, and many
more. However, the Land Use Planning is, in
theory, the overriding spatial plan that covers all
land and is also the legal basis for any types of
land use (Anonymous, 2003; SEMLA, 2009).
During this period of strong economic growth,
LUP was mainly used to facilitate economic
development (Nguyen Hieu Trung et al., 2004).
In addition, LUP affects negatively the actual
socio-economic development as well, such as:
actually divided land does not support for actual
socio-economic development, for example:
unsuitable planned area for resident, industry,
annual crop
Obviously, LUP is built to support for actual
socio-economic development at specific period of
development. In contrast, it is a concern whether
or not the results of actual socio-development
have correlation with intended change of land in
LUP. Based on this concern, the research
objectives are to prove the correlation between
LUP and actual socio-economic development in
Maichau District, Hoabinh Province, including:
(1) Correlation between LUP and statistical data
on socio-economic development; (2) Correlation
between LUP and judgments of authorities and
natural resources management officials at the
different communes on economic, social and
infrastructure development in the research area.
The results of research will prove the vital
role of LUP in actual socio-economic
development in research area if the correlation
is determined positively. Additionally, the
quality of LUP needs to be improved based on
the results in the research area.
2. METHOD
2.1. Research area
Maichau District with its complicated
terrain was conveniently selected to carry out the
study. Located in the mountainous and
attractive region of the province with many
beautiful landscapes and traditional customs, the
district is considered as one of the most beautiful
districts of Hoabinh Province and northwest
region of Vietnam. Moreover, the location of the
district is also a crucial bridge between Hanoi
and other provinces in the northwest region of
Vietnam (Anonymous, 2001: p14).
Đỗ Văn Nhạ, Phạm Bích Tuấn, Raine Marggraf
355
2.2. Research contents
The contents include: (1) Correlation
between LUP and food production; (2)
Correlation between LUP and population
growth; (3) Correlation between LUP and
industrial development; (4) Opinion of resources
managers and officials.
2.3. Method
The analysis is based on interview data of
the importance of LUP on development in the
case study district as well as on a statistical
analysis of actual land use change in
comparison to the directives in LUP 2000.
2.3.1. Statistical method
To determine and analyse correlation
between LUP made in 2000 and actual socio-
economic development from 2001 to 2010 in
Maichau District, statistical method was used
to collect and analyse the secondary data,
including:
The results of LUP made in the year of 2000
for the period of 10 years development from
2001 to 2010 were collected at the
Department of Natural Resources
Management at the district and provincial
level.
Based on the land use pattern in the year
2010, the implementation of LUP from 2001
to 2010 is judged. Also, it was investigated
at the Department of Natural Resources
Management in different scales.
Economic development in such period from
2001 to 2010 including agriculture, non-
agriculture, etc. especially agriculture was
also collected at the different departments
in the research area.
Actual social and environmental conditions
from 2001 to 2010 archived regularly at the
Statistical Department were used to
compare with the results of LUP.
2.3.2. Interview method
Interview method was used to gather
information regarding contribution of LUP to
socio-economic development in the selected
area. The interviewees comprised 23 authorities
and 23 natural resources management officials
at the different communes who participated in
making the LUP in 2000. This LUP was
implemented from 2001 to 2010 in their
locations. Basically, participants have to clarify
the contribution of LUP to socio-economic
development of their communes.
The aim of interviewing the authorities at
different communes in the district was to collect
their judgments of economic, social and
infrastructure development in their location, as
they have connection with LUP made in 2000.
Consequently, their judgment of LUP
contributions is one of the basic parameters to
estimate the correlation.
Questionnaire focused on:
Process to make LUP in the year 2000
Contribution of LUP to socio-economic
development.
Effect of LUP on environmental
development.
2.3.3. Correlation method
This method was used to determine the
correlation between the planned land use
change and actual land use change in the
research area, the correlation between LUP and
actual socio-economic development from 2001 –
2010, and the correlation between LUP and
judgments of authorities and natural resources
management officials at the different communes
on economic, social and infrastructure
development in Maichau District. SPSS
software was used to determine the correlation.
The framework is shown in Fig. 1
Accordingly, the combination between
secondary data and primary data plays the vital
role in determining the correlation. SPSS was
used to analyse the data and linear regression
indicated the correlation between LUP and
socio-economic development.
Correlation between land use planning and socio-economic development in Maichau district, Hoabinh province
356
Fig. 1. Conceptual framework to determine the correlation
3. RESULTS AND DISCUSSIONS
3.1. Correlation between LUP and food
production
The commercial and industrial development
in Vietnam is subjected to certain limitations
especially in mountainous regions. Securing
food for the local people has been a significant
concern of farmers and authorities (FAO, 2011:
p2). Tram Huu Cuong (2005) demonstrated that
developing agriculture and rural economy to
large-scale production would form a basis for
economic, political and social stability. Thus,
land users should develop and exploit effectively
the natural resources in their administrative
areas (Jocelyn, 2002: p28). In the period from
2000 to 2010 in Maichau District, total food
production increased remarkably due to some
reasons, such as increased crop yields, and
annual crop area or suitable change of the
location of annual crop with higher yield. The
correlation between annual crop area and self-
produced food is shown in the fig.2.
The data indicates that total food product
in Maichau increased steadily from roughly
13,200 tons in 2000 to 25,600 tons in 2010,
while the area of annual crop also rose by
nearly 53 ha in LUP and 2,080 ha in actual land
use throughout the same period.
3.2. Correlation between LUP and
population growth
To stabilise the development of the society is
also one of the main goals of LUP. Trends of
population growth and economic development
are directly related to the political stability of the
government during a particular time in history
(Kelly, 2004: p30). The rate of population growth
in developing countries is higher than in others,
especially in Southeast Asian countries, such as
Vietnam and Indonesia, so the need to extend
the residential area has been estimated to be
District Province
Analysis
Correlation
Interview
Authority
Commune
Natural
resources
management
official
Land Use
Planning
Land use
pattern
Economic
data
Social data
Secondary data
Đỗ Văn Nhạ, Phạm Bích Tuấn, Raine Marggraf
357
higher for LUP at different levels from nation to
commune. Additionally, population density
control, one form existing in most LUP, can be
expressed in different ways (Evans, 2004). The
correlation between LUP and population growth
in Maichau District is shown in fig.3.
Fig.2. Annual crop land and food production (2000-2010)
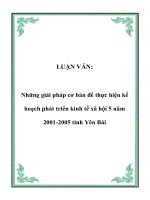
Fig.3. Correlation between residential land and population growth in Maichau
0
1000
2000
3000
4000
5000
6000
7000
2000 2005 2010
Year
Area (ha)
0
5000
10000
15000
20000
25000
30000
Food (ton)
Area of annual crop (LUP) Area of annual crop (actual LU) Food (rice and maize)( ton)
0
100
200
300
400
500
600
700
800
900
2000 2005 2010
Year
Area (ha)
0
10000
20000
30000
40000
50000
60000
Population (Person)
Residential area (LUP) Residential area (Actual LU) Population
Correlation between land use planning and socio-economic development in Maichau district, Hoabinh province
358
The figure indicates that the population of
the district increased gradually from around
47,300 people in 2000 to 52,700 people in 2010,
with an average population growth of 1.12% in 10
years (GSO, 2010). While residential land also
rose significantly in both LUP and actual Land
Use (LU). Indeed, the increase of roughly 70 ha
and 110 ha were in LUP and actual LU,
respectively. It is obvious that LUP was meant to
provide land for population growth in such period.
3.3. Correlation between LUP and
industrial development
Avans (2004) demonstrated that the use of
land and the location of activities that operate
in LUP process possibly control the economic
activities towards economic efficiency. The
increase or decrease of land for economic
activities is merely solved by LUP. It is a
unique tool to accommodate land for different
purposes throughout the specific period of
development. In the first period of
industrialization, land is actually significant
and appeals to investors. The realisation of
rural industrialization and modernization
demands that industrial land rise significantly
to meet the need of land and contribute to the
increase of income from industry for local people
(Anonymous, 2001).
Fig.4 illustrates that land for non-
agriculture and business was expanded
gradually to support the demand of industrial
development in Maichau District. Specifically,
industrial land soared by around 21 ha both in
LUP and actual LU from 2000 to 2010, an
increase of more than 3 times throughout that
period. The income from industry also rose
dramatically from VND 5.43 billion in 2000 to
VND 105.46 billion in 2010, nearly 20 times
higher. It is assumed that the increase of
industrial land affected positively the industrial
income of the district.
The correlation between Land Use
Planning and food production, population and
industrial value is summarized in table 1. It
shows that total output indicators correlate well
with total assigned land use for a suitable land
use category.
Table 2 shows the correlation between
intended change and actual change of land use
in 23 communes from 2000 to 2010.
The data in table 2 proves that intended
change (between actual land use 2010 and LUP)
and actual change (between actual land use
2010 and actual land use 2000) were
significantly correlated for all land use types.
Fig.4. Correlation between industrial land and value of industry in Maichau
0
5
10
15
20
25
30
2000 2005 2010
Year
Area (ha)
0
20
40
60
80
100
120
Value (VND billion)
Land for non-agricultural production and business (LUP)
Land for non-agricultural production and business (actual LU)
Value of industry
Đỗ Văn Nhạ, Phạm Bích Tuấn, Raine Marggraf
359
Table 1. Correlation between LUP and social economic development
Dependent variables
Independent variables (LUP) (n=23)
Annual crop land
Industrial and business land Residential land
1. Actual annual crop land R-Square 0.579 0.086 0.069
P-value 0.000 0.499 0.226
Slope 1.112*** -14.140 -2.083
2. Actual industrial and
business land
R-Square 0.043 1.000 0.064
P-value 0.590 0.000 0.512
Slope -0.005 1.007*** 0.051
3. Actual residential land R-Square 0.000 0.008 0.400
P-value 0.976 0.825 0.001
Slope 0.001 -0.280 0.539***
4. Food R-Square 0.579 0.068 0.069
P-value 0.000 0.499 0.226
Slope 4.434*** -56.388 -8.305
5. Population R-Square 0.000 0.292 0.672
P-value 0.990 0.133 0.000
Slope 0.024 88.503 40.146***
6. Industrial value R-Square 0.048 0.793 0.067
P-value 0.573 0.001 0.502
Slope -0.022 3.944*** 0.231
*, **, *** significant at 0.05, 0.01, 0.001, respectively.
Source: Own calculation
Table 2. Correlation between intended change and actual change of land use
Actual land use 2010 - LUP
(Intended change)
Actual land use 2010 - Actual land use 2000
(Actual change) (n=23)
Agriculture Residence Industry Forest Unused
Agriculture
R-Square 0.776 0.068 0.012 0.086 0.019
P-value 0.000 0.228 0.617 0.175 0.529
Slope 1.619*** 0.053 -0.012 -1.924 -0.882
Residence
R-Square 0.082 0.789 0.008 0.162 0.035
P-value 0.185 0.000 0.685 0.057 0.392
Slope 3.615 1.244*** -0.069 18.166 8.19
Industry
R-Square 0.002 0.000 0.832 0.031 0.028
P-value 0.852 0.93 0 0.419 0.446
Slope -40.409 -2.091 54.055*** 619 -567.136
Forest
R-Square 0.163 0.093 0.024 0.416 0.308
P-value 0.056 0.157 0.478 0.001 0.006
Slope -0.089 0.007 0.002 0.51** 0.426
Unused
R-Square 0.039 0.054 0.009 0.114 0.589
P-value 0.366 0.287 0.663 0.116 0.000
Slope 0.095 -0.012 -0.003 -0.58 -1.279***
*, **, *** significant at 0.05, 0.01, 0.001, respectively
Correlation between land use planning and socio-economic development in Maichau district, Hoabinh province
360
Specifically, for agriculture, 1 ha or 1% more
in intended change was equivalent to 1.6 ha or
1.6% more in actual increase. For residence, 1 ha
or 1% more in planned change, it increased 1.2
ha or 1.2% in actual change. In terms of
industrial land, 1 ha or 1% more in intended
change, the actual change increased 54 ha or
54%. For 1 ha or 1% more planned forest area, it
increased 0.5 ha or 0.5% in actual change. For
the unused land, the correlation was negative. In
sum, a substantial impact of LUP2000 on actual
development appears at the municipality level is
visible, however, as correlation coefficients vary
and rarely approach +1.0, the actual spatial
influence is limited.
Nota bene, this analysis was conducted at
the municipal level, not at the level of the single
parcels of land to which a specific land use was
assigned. I.e. the analysis indicates a high
positive correlation even in potential cases
where the intended changes had happened
somewhere else as long as these deviations
balance at the municipal level. Thus, the actual
spatial importance of LUP2010 may be
overestimated.
3.4. Opinion of resource managers and
officials
To reinforce the correlation between LUP
and socio-economic development from 2001 to
Table 4. Descriptive statistics of interview of communal officials
Variables Mean (n=23)
Std.
deviation
Min Max
Dependent variables
1 Participation of authority in making LUP (Yes=1; No=0) 1 0.0000 1 1
2 Participation of local people in making LUP (Yes=1;
No=0)
0 0.0000 0 0
3 Contribution of LUP to economic growth (Low (<10%)=1,
medium (10-15%) = 2; High (>15%) = 3)
2.0435 0.63806 1 3
4 Contribution of LUP to agricultural development (Low
(<10%)=1, medium (10-15%) = 2; High (>15%) = 3)
2.2174 0.73587 1 3
5 Contribution of LUP to non-agricultural development (Low
(<10%)=1, medium (10-15%) = 2; High (>15%) = 3)
1.4783 0.73048 1 3
6 Contribution of LUP to residential development (Low =1,
medium = 2; High = 3)
1.6957 0.55880 1 3
7 Contribution of LUP to food security (Low = 1, medium =
2; High = 3)
2.0435 0.82453 1 3
8 Contribution of LUP to landslide prevention (Low = 1,
medium = 2; High = 3)
1.7391 0.61919 1 3
9 Contribution of LUP to erosion prevention (Low =1,
medium = 2; High = 3)
1.9130 0.59643 1 3
10 Contribution of LUP to reforestation (Low =1, medium =
2; High = 3)
1.6087 0.65638 1 3
11 Contribution of LUP to change of labour use (Low =1,
medium = 2; High = 3)
1.4783 0.73048 1 3
Independent variables (LUP)
1 Increase of annual crop land (ha) 2.2804 37.3315 -94.3100 76.2300
2 Increase of forest land (ha) 321.8461 397.9902 0.9100 1,966.7500
3 Increase of residential land (ha) 3.0596 2.8041 0.3900 15.1000
4 Increase of industrial land (ha) 0.9322 2.2712 0.0000 9.5500
5 Decrease of unused land (ha) 364.2343 395.3139 55.3300 2,029.8800
Source: Own investigation and calculation
Đỗ Văn Nhạ, Phạm Bích Tuấn, Raine Marggraf
361
2010, the interview of natural resources
management officials and authorities of 22
communes and one town in Maichau District was
carried out under concrete questions focused on
three main aspects: (1) Participation in LUP; (2)
Contribution of LUP to socio-economic
development; (3) Effect of LUP on environment.
Additionally, the area increases and decreases in
different land use types in LUP were also
extracted as independent variables.
LUP in the district was made in 2000 without
local people’s participation. Evans (2004) argues
that the compromise with local people is very
important in planning to achieve a balanced
development. There was merely the participation
of authorities and natural resources management
officials in the making of LUP.
The contribution of LUP to economic
development was claimed to be of great
importance. Indeed, the contribution to socio-
economic development was rated as between 1.5
and 2.2 at a three point scale (1: low, 2: medium,
3: high importance). The strongest influence was
assumed for agricultural development.
Table 5. Correlation between LUP and contribution of LUP
to socio-economic development
Variables
Independent variables
Increase of
annual
crop land
Increase of
industrial and
business land
Increase of
forest land
Increase of
residential
land
Decrease of
unused land
1. Contribution of LUP to
economic growth
R-Square 0.299 0.304 0.018 0.002 0.006
P-value 0.007 0.006 0.539 0.856 0.721
Slope 0.009** 0.155** 0.000 0.009 0.000
2. Contribution of LUP to
agricultural development
R-Square 0.753 0.010 0.058 0.001 0.025
P-value 0.000 0.652 0.268 0.896 0.475
Slope 0.017*** 0.032 0.000 -0.008 0.000
3. Contribution of LUP to non-
agricultural development
R-Square 0.031 0.653 0.026 0.005 0.021
P-value 0.420 0.000 0.464 0.752 0.510
Slope 0.003 0.260*** 0.000 -0.018 0.000
4. Contribution of LUP to
residential development
R-Square 0.07 0.011 0.120 0.524 0.165
P-value 0.222 0.630 0.105 0.000 0.054
Slope 0.004 0.026 0.000 0.144*** 0.001
5. Contribution of LUP to
reforestation
R-Square 0.176 0.002 0.595 0.156 0.544
P-value 0.046 0.838 0.000 0.055 0.000
Slope -0.007* 0.013 0.001*** 0.095 0.001***
6. Contribution of LUP to food
security
R-Square 0.687 0.024 0.151 0.054 0.096
P-value 0.000 0.481 0.067 0.285 0.150
Slope 0.018*** 0.056 0.000 -0.068 0.000
7. Contribution of LUP to
landslide prevention
R-Square 0.134 0.000 0.528 0.208 0.506
P-value 0.086 0.963 0.000 0.029 0.000
Slope -0.006 -0.003 0.001*** 0.101* 0.001***
8. Contribution of LUP to
erosion prevention
R-Square 0.149 0.018 0.441 0.144 0.403
P-value 0.069 0.537 0.001 0.074 0.001
Slope -0.006 -0.036 0.001*** 0.081 0.001***
9. Contribution of LUP to
change of labour use
R-Square 0.096 0.611 0.017 0.004 0.012
P-value 0.150 0.000 0.549 0.769 0.622
Slope 0.006 0.251*** 0.000 -0.017 0.000
*, **, *** significant at 0.05, 0.01, 0.001, respectively.
Source: Own calculation
Correlation between land use planning and socio-economic development in Maichau district, Hoabinh province
362
Table 5 shows that there exists a
significant correlation between the influences
those municipal level interviewees attribute to
LUP 2000 and actual socio-economic
development from 2001 to 2010. For example,
the increase of annual crops and industrial land
affected largely the agricultural and non-
agricultural development, respectively.
4. CONCLUSIONS
Local land managers regard Land Use
Planning as a low-to-medium to medium
effective tool to shape district development.
Overall indicators of socio-economic
development correlate well with the total areas
assigned to the land use categories of the LUP
2000. Thus, it can be inferred that LUP
contributes positively to sustainable
development because it provides space for these
developments, especially as land inputs for
agricultural and forest production. However, at
the level of the detailed changes proposed in
LUP 2000 versus the actual changes at the
municipal level, substantial deviations from the
plan are commonly observed. Also, this result
has to be put into perspective: The deviations in
the residential and agricultural land use
categories are among the lowest at the municipal
level. For both categories, actual change is
highly correlated with planned changes
(p<0.001), and the proportionality factors are
roughly 1.2 and 1.6. So the null-hypothesis that
there is no relationship between plan and actual
development is clearly rejected.
The correlation between the changes of land
use in LUP and socio-economic statistical data in
Maichau District is an evidence to prove partly
the contribution of LUP to socio-economic
development throughout the period of
development. Particularly, in the undeveloped
area with deficient financial support, land
resource and land allocation become the vital key
to change the economy structure towards non-
agriculture and increase the income of local
people. Besides, the correlation also demonstrates
the effect of LUP implementation on actual
development which is one of the backgrounds
used to propose different land use scenarios in
LUP for the next period of development.
The changes of land use in LUP
(independent variables) and actual socio-
economic development judgments (dependent
variables) of local authorities and natural
resources management officials in the district,
who made and realized LUP, demonstrate the
correlation as well. Indeed, LUP correlated with
food production, contributed to socio-economic
development through: Economic growth,
residential development, change of the labour
force, and environmental protection like
landslide and erosion prevention.
Certainly, additional high resolution
analyses would be desirable as well as
qualitative insights into the “real” interaction of
plan and actual development. Nevertheless, the
results of this research can be regarded as
supporting the notion that LUP does influence
local development. Thus, scientific endeavors to
improve the capacity of Vietnamese Land Use
Planning by the incorporation of environmental
factors cannot and should not be disregarded
because of the low effectiveness of Land Use
Planning itself.
REFERENCES
Anonymous (2001). The report on land use planning of
Maichau District - Hoabinh Province: People's
committee of Maichau District.
Anonymous (2003). The Vietnam Landlaw in 2003. In
Vietnam Government (Ed.).
Bristow, M. Roger (1981). Planning by demand: A possible
hypothesis about town planning in Hong Kong. Asian
journal of public administration, 199-223.
Counsell, Dave, & Graham Haughton (2006).
Sustainable development in regional planning: The
search for new tools and renewed legitimacy.
Goeforum 37: 921-931.
Crowley, John.R, John.L Hall, E. Bruce MacDuogall,
John Passarello, & Frederick.J Thomson (1975).
Land use planning. Supporting paper 3.
Evans, Alan W. (2004). Economics and Land Use
Planning: Blackwell Publishing.
FAO (1993). Guidelines for land-use planning. Food
and Agriculture organization of United Nations.
Đỗ Văn Nhạ, Phạm Bích Tuấn, Raine Marggraf
363
Rome, Italy: Food and Agriculture organization of
United Nations.
FAO (2011). Vietnam and FAO: Achievements and
success stories: FAO Representation in Vietnam.
GSO (2010). National statistical data in 2010. National
statistical office.
Jocelyn, A. Songco (2002). Do Rural Infrastructure
Investments Benefit the Poor? Evaluating
Linkages: A Global View, A Focus on Vietnam:
School of International and Public Affairs,
Columbia University and the World Bank,
Vietnam.
Kelly, Stephanie B. (2004). Community planning. How
to solve urban and environmental problems:
Rowman &Littlefield publishers.
Long, Hualou, Guoping Tang, Xiubin Lia, &
Gerhard.K. Heilig (2007). Socio-economic driving
forces of land-use change in Kunshan, the Yangtze
River Delta economic area of China.
Environmental Management, 83: 351-364.
Nguyen Hieu Trung, Le Quang Tri, M. E. F. Van
Mensvoort, & A. Bregt (2004). GIS for
participatory land use planning in the Mekong
delta, Vietnam. The 4th international conference of
Asian federation of information technology in
agriculture and natural resources, Bangkok,
Thailand.
Nguyen Quang (2003). Review of Existing Planning
System: Obstacles and Strategies Moving toward
Innovative Planning Approaches. Case study of Ha
Tinh Planning System: GTZ, PDP-HaTinh.
SEMLA (2009). Integrated Land Use Planning: Results
and lessions learnt. Hanoi, Vietnam: Strengthening
Environmental Management and Land
Administration. Vietnam - Sweden Cooperation
Programme.
Tran Huu Cuong (2005). Market Access and
Agricultural Production in Vietnam. University
Hohenheim.
WB (2008). Vietnam-country overview: World Bank.