dielectrics in electric fields (12)
Bạn đang xem bản rút gọn của tài liệu. Xem và tải ngay bản đầy đủ của tài liệu tại đây (2.56 MB, 55 trang )
11
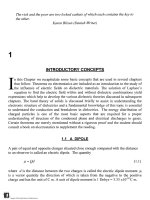
SPACE
CHARGE
IN
SOLID DIELECTRICS
T
his
chapter
is
devoted
to the
study
of
space charge build
up and
measurement
of
charge density within
the
dielectric
in the
condensed phase. When
an
electric
field
is
applied
to the
dielectric polarization occurs,
and so far we
have treated
the
polarization
mechanisms
as
uniform
within
the
volume. However,
in the
presence
of
space charge
the
local
internal
field
is
both
a
function
of
time
and
space introducing non-
linearities
that influence
the
behavior
of the
dielectrics. This chapter
is
devoted
to the
recent
advances
in
experimental techniques
of
measuring space charge, methods
of
calculation
and the
role
of
space charge
in
enhancing breakdown probability.
A
precise
knowledge
of the
mechanism
of
space charge formation
is
invaluable
in the
analysis
of
the
polarization processes
and
transport phenomena.
11.1
THE
MEANING
OF
SPACE CHARGE
Space charge occurs whenever
the
rate
of
charge accumulation
is
different
from
the
rate
of
removal.
The
charge accumulation
may be due to
generation, trapping
of
charges,
drift
or
diffusion
into
the
volume.
The
space
charge
may be due to
electrons
or
ions
depending upon
the
mechanism
of
charge transfer. Space charge arises both
due to
moving
charges
and
trapped charges.
Fig.
11.1
shows
the
formation
of
space charge
due to
three processes
in a
dielectric that
is
subjected
to an
electric
field
1
.
(a) The
electric
field
orients
the
dipoles
in the
case
of a
homogenous material
and the
associated space charge
is a
sharp step
function
with
two
peaks
at the
electrodes.
(b) Ion
migration occurs under
the
influence
of the
electric
field,
with negative charges
migrating
to the
positive electrode
and
vice-versa.
The
mobility
of the
various carriers
515
TM
Copyright n 2003 by Marcel Dekker, Inc. All Rights Reserved.
are
not
equal
and
therefore
the
accumulation
of
negative charges
in the top
half
is
random.
Similarly
the
accumulation space charge
due to
positive charges
in the
bottom
portion
is
also random
and the
voltage
due to
this space charge
is
also arbitrary.
The
space charge
is
called
"heterocharges".
(c)
Charges
injected
at the
electrodes generate
a
space charge when
the
mobility
is
low.
The
charges have
the
same polarity
as the
electrode
and are
called
"homocharges."
V
o
Fig.
11.1
Development
of
charge distribution
p (z) in a
dielectric material subjected
to an
electric
field,
(a)
dipole orientation,
(b) ion
migration,
(c)
charge transfer
at the
interfaces
(Lewiner,
1986,
©
IEEE).
A
modern treatment
of
space charge phenomenon
has
been presented
by
Blaise
and
Sarjeant
2
who
compare
the
space charge densities
in
metal oxide conductors (MOS)
and
high
voltage capacitors (Table
11.1).
The
effect
of
moving charges
is far
less
in
charging
of
the
dielectric
and
only
the
trapped charges
influence
the
internal
field.
TM
Copyright n 2003 by Marcel Dekker, Inc. All Rights Reserved.
11.2
POLARONS
AND
TRAPS
The
classical picture
of a
solid having trapping sites
for
both polarities
of
charge carriers
is
shown
earlier
in
Fig.
1.11.
The
concept
of a
polaron
is
useful
in
understanding
the
change
in
polarization that occurs
due to a
moving charge.
Table 11.1
Electronic space charge densities
in MOS and
HV
capacitors (Blaise
and
Sargent, 1998)
(with
permission
of
IEEE)
MOS
Parameter
mobility
Current
density
Applied field
Charge density
Charge
cone.
unit
m
2
/Vs
A/m
2
MV/m
C/m
3
/m
3
Mobile
~20xl
O'
4
10-10
4
100-1200
20u-0.02
10'
8
-10'
5
Trapped
100-1200
300-30,000
0.1-0.01
HV
Mobile
charges
10'
7
-10-
4
10'
2
-0.1
10-100
200u-0.02
capacitors
Trapped
charges
10-100
-
2xlO'
8
-2xlO-
6
10'
3
-10
An
electron moving through
a
solid causes
the
nearby positive charges
to
shift
towards
it
and
the
negative charges
to
shift
away. This distortion
of the
otherwise regular array
of
atoms causes
a
region
of
polarization that moves with
the
electron.
As the
electron
moves away, polarization vanishes
in the
previous location,
and
that region returns
to
normal.
The
polarized region acts
as a
negatively charged particle, called polaron,
and its
mass
is
higher than that
of the
isolated charge.
The
polarization
in the
region
due to the
charge
is a
function
of the
distance
from
the
charge. Very close
to the
charge,
(r <
r
e
),
where
r is the
distance
from
the
charge
and
r
e
is the
radius
of the
sphere that separates
the
polarized
region
from
the
unpolarized region. When
r >
r
e
electronic polarization
becomes
effective
and
when
r >
r^
ion
polarization
occurs.
Let
us
consider
a
polaron
of
radius
r
p
in a
dielectric medium
in
which
a
fixed
charge
q
exists.
The
distance
from
the
charge
is
designated
as r and the
dielectric constant
of the
medium
varies
radially
from
z
polaron
is,
according
to
Landau
at
1*1
<
r
p
to
s
s
1 1
at
r
2
>
r
p
.
The
binding
energy
of the
(11.1)
TM
Copyright n 2003 by Marcel Dekker, Inc. All Rights Reserved.
where
r
p
is the
radius
of the
polaron,
So,
and
s
s
are the
dielectric constants which shows
that smaller values
of
r
p
increase
the
binding energy. This
is
interpreted
as a
more
localized charge.
The
localization
of the
electron
may
therefore
be
viewed
as a
coupling
between
the
charge
and the
polarization
fields.
This coupling causes lowering
of the
potential energy
of the
electron.
The
kinetic energy determines
the
velocity
of the
electron which
in
turn determines
the
time required
to
cross
the
distance
of a
unit cell.
If
this time
is
greater than
the
characteristic relaxation time
of
electron
in the
ultraviolet region, then
the
polarization
induced
by the
electron will
follow
the
electron almost instantaneously.
The
oscillation
frequencies
of
electron polarons
is in the
range
of
10
15
-10
16
Hz. If we now
consider
the
atomic
polarization which
has
resonance
in
infrared
frequencies,
a
lower energy electron
will
couple with
the
polarization
fields
and a
lattice polaron
is
formed.
The
infrared
1011
frequency
domain
is
10
-10
Hz and
therefore
the
energy
of the
electron
for the
formation
of a
lattice polaron
is
lower,
on the
order
of
lattice vibration energy.
The
lattice
polaron
has a
radius, which,
for
example
in
metal oxides,
is
less than
the
interatomic
distance.
Having considered
the
formation
of
polarons
we
devote some attention
to the
role
of the
polarons
in the
crystal structure. Fig.
11.2(a)
shows
the
band structure
in
which
the
band
corresponding
to the
polaron energy level
is
shown
as
2J
P
[
Blaise
and
Sargent,
1998].
At
a
specific
site
i
(11.2b)
due to the
lattice deformation
the
trap depth
is
increased
and
therefore
the
binding energy
is
increased. This
is
equivalent
to
reducing
the
radius
of the
polaron, according
to
equation
(11.1),
and
therefore
a
more localization
of the
electron.
This variation
of
local electronic
polarizability
is the
initiation
of the
trapping
mechanism.
Trapping centers
in the
condensed phase
may be
classified
into passive
and
active
centers. Passive centers
are
those associated with anion vacancies, that
can be
identified
optically
by
absorption
and
emission lines. Active trapping centers
are
those associated
with
substituted cations. These
are
generally
of low
energy
(~leV)
and are
difficult
to
observe optically. These traps
are the
focus
of our
attention.
11.3
A
CONCEPTUAL APPROACH
Focusing
our
attention
on
solids,
a
simple experimental setup
to
study space charge
is
shown
in
fig.
11.3
4
.
The
dielectric
has a
metallic electrode
at one end and is
covered
by a
conducting
layer which acts
as a
shield.
The
current
is
measured through
the
metallic
end.
The
charges
may be
injected
into
the
solid
by
irradiation
from
a
beam
of
photons,
X-rays
or
gamma rays. Photons
in the
energy range
up to
about
300 keV
interact with
a
TM
Copyright n 2003 by Marcel Dekker, Inc. All Rights Reserved.
solid, preferentially
by the
photoelectric
effect.
Photons above this energy interact
by
Compton
effect;
an
increase
of
wavelength
of
electromagnetic radiation
due to
scattering
by
free
or
loosely bound electrons, resulting
in
absorption
of
energy (Gross, 1978).
The
secondary electrons
are
scattered mainly
in the
forward direction.
The
electrons move
a
certain distance within
the
dielectric, building
up a
space charge density
and an
internal
electric
field
which
may be
quite intense
to
cause breakdown.
w
(a)
0
WJ
(b)
c.b.
/
\
\\v\\
u\\vuu\\\\\\\vvx\\vvvvv
(a)
polaron
sites
I
trap
ion
(b)
Fig.
11.2
(a)
Potential wells associated with polaron sites
in a
medium
of
uniform
polarizability,
forming
a
polaron band
of
width 2Jp.
(b)
Trapping
effect
due to a
slight
decrease
of
electronic polarizability
on a
specific site
i,
(adi
<
ad).
The
charge
is
stabilized
at
the
site
due to
lattice deformation. This leads
to the
increase
of
trap depth
by an
amount
dWion-
The
total binding energy
is
Wb=
8Wi
r
+
5Wi
O
n
(Blaise
and
Sargent, 1998,
©
IEEE).
The
space charge build
up due to
irradiation with
an
electron beam
is
accomplished
by a
simple technique known
as the
'Faraday
cup'.
This method
is
described
to
expose
the
principle
of
space charge measurements. Fig.
11.4
shows
the
experimental arrangement
used
by
Gross,
et
al
5
.
A
dielectric
is
provided with vacuum deposited electrodes
and
irradiated with
an
electron beam.
The
metallic coating
on the
dielectric should
be
thin
enough
to
prevent absorption
of the
incident electrons.
The
electrode
on
which
the
irradiation
falls
is
called
the
"front" electrode
and the
other electrode,
"back
electrode".
Both electrodes
are
insulated
from
ground
and
connected
to
ground through separate
TM
Copyright n 2003 by Marcel Dekker, Inc. All Rights Reserved.
current
measuring instruments.
The
measurements
are
carried
out in
either current mode
or
voltage mode
and the
method
of
analysis
is
given
by
Gross,
et
al.
Dielectric
a —
Build-up
region
scatter
Region
Radiant
Energy
Flux
Density
Compton
Current
Density
Space
Charge Density
Electric
Field
Strength
Fig.
11.3
(a)
Technique
for
measurement
of
current
due to
charge
injection,
(b)
Schematic
for
variation
of
space charge density
and
electric
field
strength (Gross, 1978, ©IEEE).
Electrical
field,
particularly
at
high temperatures, also augments injection
of
charges into
the
bulk
creating
space charge.
The
charge
responsible
for
this space charge
may be
determined
by the TSD
current measurements described
in the
previous chapter.
In
amorphous
and
semicrystalline
polymers space charge
has a
polarity opposite
to
that
of
the
electrode polarity; positive polarity charges
in the
case
of
negative poling voltage
and
vice-versa.
The
space charge
of
opposite polarity
is
termed heterocharge whereas
space charge
of the
same polarity
is
termed homocharge.
In the
case
of the
hetero
charges
the
local space charge
field
will
intensify
the
applied
field,
whereas
in the
case
TM
Copyright n 2003 by Marcel Dekker, Inc. All Rights Reserved.
of
homo charges there will
be a
reduction
of the net
field.
In the
former
case
of
heterocharges,
polarization that occurs
in
crystalline regions will also
be
intensified.
•1
Fig.
11.4
Split
Faraday
cup
arrangement
for
measurement
of
charge build
up and
decay.
A-
Front
electrode, B-back electrode,
s-thickness
of
dielectric,
r
-center
of
gravity
of
space
charge
layer.
The
currents are: Ii-injection current,
H
-front
electrode current,
I2=rear
current,
I=dielectric
current (Gross
et.
al.
1973, with permission
of A.
Inst.
Phys.).
The
increase
in
internal electric
field
leads
to an
increase
of the
dielectric constant
s'
at
high temperatures
and low
frequencies,
as has
been noted
in
PVDF
and PVF . It is
important
to
note that
the
space
charge build
up at the
electrode-dielectric interface also
leads
to an
increase
of
both
&'
and s" due to
interfacial polarization
as
shown
in
section
4.4.
It is
quite
difficult
to
determine
the
precise
mechanism
for the
increase
of
dielectric
constant; whether
the
space charge build
up
occurs
at the
electrodes
or in the
bulk.
Obviously
techniques capable
of
measuring
the
depth
of the
space charge layer shed light
into these complexities.
The
objectives
of
space charge measurement
may be
stated
as
follows:
(1)
To
measure
the
charge intensities
and
their polarities, with
a
view
to
understanding
the
variation
of the
electric
field
within
the
dielectric
due to the
applied
field.
(2) To
determine
the
depth
of the
charge layer
and the
distribution
of the
charge within
that layer.
(3) To
determine
the
mechanism
of
polarization
and its
role
in
charge accumulation.
TM
Copyright n 2003 by Marcel Dekker, Inc. All Rights Reserved.
(4) To
interpret
the
space charge build
up in
terms
of the
morphology
and
chemical
structure
of the
polymer
In
the
sections that
follow,
the
experimental techniques
and the
methods employed
to
o
analyze
the
results
are
dealt with. Ahmed
and
Srinivas have published
a
comprehensive
review
of
space charge measurements,
and we
follow
their treatment
to
describe
the
experimental
techniques
and a
sample
of
results obtained using these techniques. Table
11.2
presents
an
overview
of the
methods
and
capabilities.
11.4
THE
THERMAL
PULSE
METHOD
OF
COLLINS
The
thermal pulse method
was
first
proposed
by
Collins
9
and has
been applied, with
improvements,
by
several authors.
The
principle
of the
method
is
that
a
thermal pulse
is
applied
to one end of the
electret
by
means
of a
light
flash. The flash
used
by
Collins
had
a
duration
of
8us.
The
thermal pulse travels through
the
thickness
of the
polymer,
diffusing
along
its
path.
The
current,
measured
as a
function
of
time,
is
analyzed
to
determine
the
charge distribution within
the
volume
of the
dielectric.
The
experimental
arrangement
is
shown
in
Fig.
1
1.5.
The
electret
is
metallized
on
both sides
(40
nm
thick)
or on one
side only (lower
fig.
11.5),
with
an air gap
between
the
electret,
and a
measuring electrode
on the
other.
By
this method voltage changes across
the
sample
are
capacitively coupled
to the
electrode.
The
gap
between
the
electrode
and the
electret should
be
small
to
increase
the
coupling.
The
heat
diffuses
through
the
sample
and
changes
in the
voltage across
the
dielectric,
AV(t),
due to
non-uniform thermal expansion
and the
local change
in the
permittivity,
are
measured
as a
function
of
time.
The
external voltage source required
is
used
to
obtain
the
zero
field
condition which
is
required
for
equations
(1
1
.3)
and
(1
1
.4)
(see below).
Immediately
after
the
heat pulse
is
applied, temperature changes
in the
electret
are
confined
to a
region close
to the
heated
surface.
The
extent
of the
heated zone
can be
made small
by
applying
a
shorter
duration
pulse.
The
process
of
metallizing
retains
heat
and
the
proportion
of the
retained heat
can be
made small
by
reducing
the
thickness
of
the
metallizing.
In the
ideal case
of a
short pulse
and
thin metallized layer,
the
voltage
change
after
a
heat pulse applied
is
given
by
(11.2)
TM
Copyright n 2003 by Marcel Dekker, Inc. All Rights Reserved.
where
p
T
is the
total charge density (C/m
2
). Determination
of the
total charge
in the
electret does
not
require
a
deconvolution
process.
Table
11.2
Overview
of
space charge measuring techniques
and
comments (Ahmed
and
Srinivas,
1997).
R is the
spatial resolution
and t the
sample thickness.
(with
permission
of
IEEE)
Method
Thermal
pulse
method
laser
intensity
modulation method
Laser
induced
pressure
pulse method
Thermoelasncally
generated
UPP
Pressure wave
propagation method
Non-structured
acoustic
pulse method
Laser
generated
acousbc
pulse method
Acoustic probe method
Piezoelectncally-
generated
pressure step
method
Thermal
step method
Electro-acoustic
stress
pulse method
Photoconductivity
method
Space
charge mapping
Spectroscopy
Field probe
Disturbance
Absorption
of
short-tight
pulse
in
front
electrode
Absorption
of
modulated light
in
front
electrode
Absorption
of
short
laser light pulse
in
front
electrode
Absorption
of
short
laser light pulse
in
thin
buried layer
Absorption
of
short
User
light
pulse
in
metal
target
HV
spark between
conductor
and
metal
diaphragm
Absorption
of
short
laser light pulse
in
thin
paper target
Absorption
of
laser light
pulse
in
front
electrode
Electrical excitation
of
piezoelectric quartz
plate
Applying
two
isothermal
sources
across
sample
Force
of
modulated
electric held
on
charges
in
sample
Absorption
of
narrow
light beam
in
sample
Interaction
of
polarized
light
with
field
Absorption
of
exciting
radiation
in
sample
None
Scan
mechanism
Diffusion
according
to
heat-conduction
equations
Frequency-dependent
steady-state heat profile
Propagation
with
longitudinal sound
velocit)
Propagation
with
longitudinal sound
velocity
Propagation
with
longitudinal sound
velocity
Propagation
with
longitudinal
sound
velocity
Propagation
with
longitudinal sound
velocity
Propagation
with
longitudinal
sound
velocity
Propagation
with
longitudinal sound
velocity
Thermal
expansion
of
the
sample
Propagation
with
longitudinal sound
velocity
External
movement
of
light beam
parallel
illumination
of
sample volume
or
movement
of
light beam
or
sample
External
movement
of
radiation
source
or
sample
Capacinve
coupling
to
the field
Detection process
\foltagechangeacross
sample
Current
between sample
electrodes
Current between sample
electrodes
Current
or
voltage
between sample
electrodes
\foltageorcurrent
between sample
electrode
\foltage
between sample
electrode
\Wtage
between
sample
electrodes
\foltage
between sample
electrodes
Current
between
sample
electrodes
Current between sample
electrodes
Piezoelectric transducer
at
sample electrode
Current
between sample
electrodes
Photographic record
Relative
change
in
the
observed spectrum
Current
r(nm)
3*2
>2
1
I
10
1000
50
200
1
150
100
^1.5
200
5*50
1000
*(M"0
~200
~25
100
-
1000
50-70
5-200
<
10000
<3000
2000
-
6000
25
2000
-
20000
<
10000
—
-
-
<
20000
Comments
High
resolution requires
deconvolution
Numerical
deconvolution
is
required
No
deconvolution
is
required
Deconvolution
is
required
Resolution improved
with
deconvolution
Also used
for
surface
charge measurements
Used
for
solid
and
liquid
dielectric
Higher
resolution with
deconvoluhon
Deconvolution
is
required Target
and
sample
immersed
in
dielectric
liquid
Deconvolution
is
required
Deconvolution
is
required
Deconvoluhon
is
required Also used
for
surface
charge
measurements
Nondestructive
for
short
illumination
time
Mostly
used
on
transparent
dielectric
liquids
Few
applications
Destructive
TM
Copyright n 2003 by Marcel Dekker, Inc. All Rights Reserved.
Incident
light
Metallizing
Etectret
To
preamplifier
Incident
light
^
Air
gap
f
Electret
/•/
>\
'
\1
P
' l\
\>\
/////.
//A
\
^
^
Sens
!
x
V
C
Sue
ng
To
preamplifi
Fig.
11.5
Schematic diagram
of the
apparatus
for the
thermal pulsing experiment
in the
double
metallizing
and
single metallizing configurations. (Collins, 1980,
Am.
Inst.
Phys.)
The
observed properties
of the
electret
are in
general related
to the
internal distribution
of
charge
p
(x)
and
polarization P(x) through
an
integral over
the
thickness
of the
sample.
The
potential
difference
V
0
across
the
electret under open circuit conditions (zero
external
field) is
given
by
*;=•
^00
(11.3)
where p(x)
is the
charge density
in
C/m
3
and d the
thickness
of the
sample.
Collins
(1980)
derived
the
expression
*S*00
J
A
f \
D
Ap(x)-B—
ax
J
(11.4)
TM
Copyright n 2003 by Marcel Dekker, Inc. All Rights Reserved.
where
A =
a
x
-
a
e
and B =
a
p
-
a^-
a
e
,
x is the
spatial coordinate with
x = 0 at the
pulsed
electrode.
p(;x;)
and
P(JC)
are the
spatial distributions
of
charge
and
polarization.
The
symbols
a
mean
the
following:
a
x
=
Thermal
coefficient
of
expansion
a
£
=
Temperature
coefficient
of the
dielectric
constant
a
p
=
Temperature
coefficient
of the
polarization
There
are two
integrals,
one a
function
of
charge
and the
other
a
function
of
temperature.
Two
special
cases
are of
interest.
For a
non-polar dielectric with only induced
polarization
P = 0,
equation
(1
1
.4)
reduces
to
(11.5)
For an
electret with zero internal
field
/>(*)
=
+f
r
(1L6)
ax
.7)
Collins used
a
summation procedure
to
evaluate
the
integral
in
equation
(11.5).
The
continuous charge distribution,
p(x)
is
replaced
by a set of N
discrete charge layers
p
n
with
center
of
gravity
of
each layer
at mid
point
of the
layer
and
having coordinate
x-
}
=
(j
-
V^d/N
with
j = 1, 2,
N.
The
integral with
the
upper limit
x in
equation
(11.5)
is
replaced with
the
summation
up to the
corresponding layer
Xj.
Equation
(11.5)
then
simplifies
to
(11.8)
Assuming
a
discrete charge distribution
the
shape
of the
voltage pulse
is
calculated using
equation
(1
1.8)
and
compared with
the
measured pulse shape.
The
procedure
is
repeated
till
satisfactory agreement
is
obtained.
Collins'
procedure does
not
yield
a
unique
distribution
of
charge
as a
deconvolution process
is
involved.
TM
Copyright n 2003 by Marcel Dekker, Inc. All Rights Reserved.
The
technique
was
applied
to
fluoroethylenepropylene
(FEP,
Teflon™)
electrets
and the
depth
of
charge layer obtained
was
found
to be
satisfactory. Polyvinylidene
fluoride
(PVDF) shows
piezo/pyroelectric
effects,
which
are
dependent
on the
poling conditions.
A
copolymer
of
vinylidene fluoride
and
tetrafluoroethylene
(VF
2
-TFE)
also
has
very
large piezoelectric
and
pyroelectric
coefficients.
The
thermal poling method
has
revealed
the
poling conditions that determine these properties
of the
polymers.
For
example,
in
PVDF,
a
sample poled
at
lower temperatures
has a
large spatial non-uniformity
in the
polarization across
its
thickness. Even
at the
highest poling temperature some non-
uniformity
exists
in the
spatial distribution
of
polarization. Significant
differences
are
observed
in the
polarization distribution, even though
the
samples were prepared
from
the
same sheet.
Seggern
10
has
examined
the
thermal pulse technique
and
discussed
the
accuracy
of the
method.
It is
claimed that
the
computer simulations show that
the
only accurate
information
available
from
this method
is the
charge distribution
and the
first
few
Fourier coefficients.
11.5 DEREGGI'S
ANALYSIS
DeReggi
et
al.
11
improved
the
analysis
of
Collins (1980)
by
demonstrating that
the
voltage response could
be
expressed
as a
Fourier series. Expressions
for the
open circuit
conditions
and
short
circuit
conditions
are
slightly
different,
and in
what follows,
we
consider
the
former
12
.
The
initial temperature
at
(x,0)
after
application
of
thermal pulse
at
;t=0,
t=0
may be
expressed
as
ro,o)
=
^+Aro,o)
(11.9)
where
TI
is the
uniform
temperature
of the
sample before
the
thermal pulse
is
applied,
and
AT(x,0)
is the
change
due to the
pulse.
AT(jc,0)
is a
sharp pulse extending
from
x = 0
with
a
width
s«d.
From equation
(11.9)
it
follows that
the
temperature
at x
after
the
application
of the
pulse
is
T(x,t)
=
T
l
+AT(x,t)
(11.10)
where
TM
Copyright n 2003 by Marcel Dekker, Inc. All Rights Reserved.
cos
n=1
exp
-n
2
t
(11.11)
=
\imAT(x,t)
a
"
~ 7
a
The
temperature
at the
surface
is
given
by
(11.12)
(11.13)
n=l
(11.14)
(11.15)
0
o
where
T
=
d
/TI
K and k is
called thermal
diffusivity.
The
dimensionless quantities
AT(0,t)/ao
and
AT(d,
t)/ao
can be
obtained
by
measuring
the
transient resistance
of one or
both
the
electrodes. Then
the
ratios
a
n
/ao
and
TI
can be
determined without knowing
the
detailed shape
of the
light pulse.
Substituting equation
(11.15)
into
(11.5)
the
voltage
at
time
t is
given
as
n
(11.16)
where
the
following relationships hold.
A
0
=
(11.17)
r
, ,
.
,n7rx
=
jp(x)sm(—
-)dx
(11.18)
The
terms
a
n
and
A
n
are the
coefficients
of
Fourier series expansions
for
AT(x,0)
and
p(jc)
respectively,
if
these
are
expanded
as
cosine
and
sine terms, respectively.
TM
Copyright n 2003 by Marcel Dekker, Inc. All Rights Reserved.
For the
short circuit conditions, equations
for the
charge distribution
and the
polarization
distribution
are
given
by
Mopsik
and
DeReggi (1982,
1984).
About
10-15
coefficients
could
be
obtained
for
real samples, based
on the
width
of the
light pulse.
The
polarization distribution determined will
be
unique
as a
deconvolution procedure
is not
resorted
to.
Fig.
11.6
shows
the
results
for a
nearly
uniformly
poled polyvinylidene
fluoride
(PVF
2
)
which
was
pulsed alternately
on
both
sides.
An
interesting observation
in
this
study
is
that there
is a
small peak
just
before
the
polarization
falls
off.
A
further
improvement
of the
thermal pulse technique
is due to
Suzuoki
et.
al.
13
who
treat
the
heat
flow
in a
slab
in the
same
way as
electrical current
in an R-C
circuit with
distributed capacitance.
The
electrical resistance, capacitance, current
and
voltage
are
replaced
by the
thermal resistance
R
t
,
thermal capacitance
Q,
heat
flow
q
(jc,
t) and
temperature
T(;c,
t),
respectively.
The
basic equations are:
1
/•>
V /
-N
1
/•>
OX
Ot
=
^
rZ
v-v
(H20)
dx
dt
The
heat
flux is
given
by
^
/(
—
CO
1
/
/
2 2
>
\
/
/rx^-v
\
'"
01.21)
TM
Copyright n 2003 by Marcel Dekker, Inc. All Rights Reserved.
2.0
1.0
0.0
_
4
i i
0.2
0.4 0.6 0.8
X
1.0
Fig.
11.6
Polarization
in
PVF2 sample.
The
solid line
is
experimental distribution.
The
dashed
line
is the
resolution expected
for a
step
function,
at x
=
0.5
(DeReggi,
et
al.,
1982, with
permission
of J.
Appl.
Phys.).
The
total
current
in the
external circuit
at t = 0,
when
the
specimen
is
illuminated
at x = 0
is
given
by
(11.22)
Similarly,
the
current,
when
the
specimen
is
illuminated
at x = d, is
(11.23)
The
total
amount
of
space
charge
is
a=-
(11.24)
The
mean
position
of the
space
charge
is
TM
Copyright n 2003 by Marcel Dekker, Inc. All Rights Reserved.
*-
72(0)
(11.25)
The
thermal pulse
was
applied using
a
xenon lamp
and the
pulse
had a
rise time
of
1
00
^is,
width
SOOus.
Since
the
calculated thermal time
constant
was
about 5ms,
the
light
pulse
is an
approximation
for a
rectangular pulse.
The
materials investigated were
HDPE
and
HDPE doped with
an
antistatic agent. Fig.
11.7
shows
the
measured currents
in
doped
HDPE. Homocharges were
identified
at the
anode
and in
doped HDPE
a
strong
heterocharge,
not
seen
in
undoped HDPE,
was
formed
near
the
cathode.
11.6 LASER
INTENSITY
MODULATION METHOD
(LIMM)
Lang
and Das
Gupta
14
have developed this method which
is
robust
in
terms
of
data
accuracy
and
requires only conventional equipment,
as
opposed
to a
high speed transient
recorder, which
is
essential
for the
thermal pulse method.
A
thin polymer
film
coated
with
evaporated opaque electrodes
at
both surfaces
is
freely
suspended
in an
evacuated
chamber
containing
a
window through which radiant energy
is
admitted. Each
surface
of
the
sample,
in
turn,
is
exposed
to a
periodically modulated radiant energy source such
as
a
laser.
The
absorbed energy produces temperature waves which
are
attenuated
and
retarded
in
phase
as
they propagate through
the
thickness
of the
specimen. Because
of
the
attenuation,
the
dipoles
or
space charges
are
subjected
to a non
uniform
thermal
force
to
generate
a
pyro-electric
current which
is a
unique
function
of the
modulation
frequency
and the
polarization distribution.
Let
CD
rad
s"
1
be the
frequency
of the
sinusoidally modulated laser beam
and the
specimen
illuminated
at x =
d.
The
surface
at x
=
0 is
thermally insulated.
The
heat
flux
absorbed
by
the
electrode
is q (d. t)
which
is a
function
of the
temperature gradient along
the
thickness.
The one
dimensional heat
flow
equations
are
solved
to
obtain
the
current
as
J>(*)coshD(y
+
l)xdx
(1
1
.26)
*
r.
iw
DsmhD(j
+
\}d
*
1
/O
where
D=
(o/2K)
, j is the
complex number operator
and C
contains
all the
position
and
frequency-dependent parameters.
The
current generated lags
the
heat
flux
because
of
the
phase retardation
of the
thermal wave
as it
progresses through
the
film.
The
current
therefore
has a
component
in
phase
and in
quadrature
to the
heat
flux.
TM
Copyright n 2003 by Marcel Dekker, Inc. All Rights Reserved.
The
mathematical treatment
of
measured currents
at a
number
of
frequencies
for
determining
P(;c)
involves
the
following
steps:
The
integral sign
in
equation
(11.26)
may
be
replaced
by a
summation
by
dividing
the
film
into
n
incremental thickness, each layer
having
its
polarization,
Pj,
where
j=1,2, n.
The
matrix equation
[I] = [G] [P]
where
(11.27)
[CVo(/
+
l)
cosh
£>(/•
[DsmhD(i-
is
solved.
The
in-phase component
of
measured current
is
used with
the
real part
of G
and
the
quadrature component
is
used with
the
imaginary part.
It is
advantageous
to
measure
I(o)
at
more than
n
frequencies
and
apply
the
least square method
to
solve
for P.
—
v
500
US
-50
(J
-100
-150L
250 V
500 V
1500
V
Fig.
11.7
Experimental thermal pulse currents
in
doped HDPE
for (a)
cathode illumination
(b)
anode illumination. Negative currents show
the
existence
of a
positive space charge
in the
sample
(Suzuoki
et
al,
1985; with permission
of
Jap.
J.
Appl.
Phys.)
Fig.
11.8
shows
the
polarization distributions
and
pyroelectric currents versus frequency.
Because
of the
impossibility
of
producing
an
experimentally
precise
type
of
polarization,
a
triangular distribution
was
assumed
and the
currents were synthesized. Using
the in-
phase
and
quadrature components
of
these currents,
the
polarization distribution
was
calculated
as
shown
by
points.
The
parameters used
for
these calculations
are d =
25.4
um,
K = 0.1 x
10"
7
mY
1
,
10
2
< f <
10
5
Hz
(101 values), obtaining
51
values
of
P
k
.
Lang
TM
Copyright n 2003 by Marcel Dekker, Inc. All Rights Reserved.
and
Das
Gupta (1981) have used
the
LIMM
technique
to
study spatial distribution
of
polarization
in
PVDF
and
thermally poled polyethylene.
11.7
THE
PRESSURE
PULSE
METHOD
The
principle
of the
pressure pulse method
was
originally proposed
by
Laurenceau,
et
al.
15
and
will
be
described
first.
There have been several improvements
in
techniques that
will
be
dealt with later.
The
pressure probe within
a
dielectric causes
a
measurable
electrical
signal,
due to the
fact
that
the
capacitance
of a
layer
is
altered
in the
presence
of
a
stress wave.
The
pressure pulse contributes
in two
ways towards
the
increase
of
capacitance
of a
dielectric layer.
First,
the
layer
is
thinner than
the
unperturbed thickness
due
to the
mechanical displacement carried
by the
wave. Second,
the
dielectric
constant
of
the
compressed layer
is
increased
due to
electrostriction
caused
by the
pulse
.
A
IN-PHASE
•
QUADRATURE
0.2 0.4 0.6 0.8
POSITION
(X/L)
Fig.
11.8
(a)
Pyroelectric current versus
frequency
(x = 0 and x
=
d
refers
to
heating
from
x
=
0 and x = d
side
of the
film,
fy = 0 and
§
=
7i/2
refers
to in
phase
or in
quadrature with heat
flux
respectively,
(b)
Polarization distributions (solid line)
and
calculated distributions
(points).
Selected data
from
(Lang
and Das
Gupta,
1981,
with permission
of
Ferroelectrics).
A
dielectric slab
of
thickness
d,
area
A, and
infinite-frequency
dielectric constant
8*.
with
electrodes
a and b in
contact with
the
sample,
is
considered.
The
sample
has
acquired,
due
to
charging,
a
charge density
p (x) and the
potential distribution within
the
dielectric
is V
(x).
All
variables
are
considered
to be
constant
at
constant
x; the
electrode
a is
grounded, electrode
b is at
potential
V. The
charge densities
a
a
and
(Jb
are
given
by
TM
Copyright n 2003 by Marcel Dekker, Inc. All Rights Reserved.
d_-(AQV_
<%
7 A
°°
7
d
A d
(11.29)
v
^
"
d A d
where
a
\xp(x)dx
n
d
and
^=
\p(x)dx
(11.30)
Expressions
(1
1.28)
and
(1
1.29)
show that
if V = 0 and if the
sample
is not
piezoelectric,
a
uniform
deformation along
the x
axis does
not
alter
the
charges
on the
electrodes since
(d-(x))/d
remains constant. This implies that
in
order
to
obtain
the
potential
or
charge
profiles,
a
non-homogeneous deformation must
be
used.
A
step
function
compressional
wave propagating through
the
sample with
a
velocity
v,
from
electrode
a
towards
b,
provides such
a
deformation.
As
long
as the
wave
front
has not
reached
the
opposite
electrode,
the
right side
of the
sample
is
compressed while
the
left
part remains
unaffected
(Fig.
1 1
.9).
The
charge induced
on
electrode
b is a
function
of the
charge
profile,
of the
position
of the
wave
front
in the
sample,
but
also
of the
boundary
conditions
at the
electrodes: Open circuit
or
short circuit conditions.
In the
first
case
the
observable parameter
is the
voltage,
in the
second case,
the
external current.
Let the
unperturbed thickness
of the
sample
be
d
0
,
and A p the
magnitude
of
pressure
excess
in the
compressed region,
(3 the
compressibility
of the
dielectric
defined
as the
fractional
change
in
volume
per
unit excess pressure,
(3 =
-AV/(VAp).
The
compressed
part
of the
dielectric
has a
permittivity
of s' and
;c
f
is the
position
of the
wave
front
at
time
t,
which
can be
expressed
as
Xf
=
d-v
0
t. In the
compressed region charges, which
are
supposed
to be
bound
to the
lattice,
are
shifted
towards
the
left
by a
quantity
u
(x,t)
=
-(3
Ap
(x-Xf).
In the
uncompressed part
the
charges remain
in the
original position.
The
electric
field
in the
uncompressed part
is
E(;c,t)
and E'
(jc,t)
in the
compressed part.
At
the
interface between these regions
the
boundary condition that applies
is
f
,f)
=
e'E'(x
f
,i)
(11.31)
The
boundary condition
for the
voltage
is
TM
Copyright n 2003 by Marcel Dekker, Inc. All Rights Reserved.
(11.32)
->
z
a
t'
Fig.
11.9
Charge
in a
dielectric between
two
electrodes, divided into
a
compressed region
of
permittivity
s'
and an
uncompressed region
of
permittivity
s; the
step
function
compression travels
from
right
to
left
at the
velocity
of
sound.
The
position
of the
wave
front
is
Xf.
The
undisturbed
part
has a
thickness
do
(Laurenceau,
1977,
with permission
of A.
Inst.
of
Phy.).
Laurenceau,
et
al.
(1977) provide
the
solution
for the
voltage under open circuit
conditions
as
(11.33)
The
current under short circuit conditions
is
A
x
f
+(e/£')(d-x
f
)
(11.34)
Equations
(11.33)
and
(11.34)
show that
the
time variation
of
both
the
voltage
and
current
is an
image
of the
spatial distributions
of
voltage
and
current inside
the
sample
TM
Copyright n 2003 by Marcel Dekker, Inc. All Rights Reserved.
prior
to
perturbation.
The
front
of the
pressure wave acts
as a
virtual moving probe
sweeping across
the
thickness
at the
velocity
of
sound.
Laurenceau,
et
al.
(1977) proved that
the
pressure pulse method gives satisfactory
results:
a
compressional step wave
was
generated
by
shock waves
and a
previously
charged polyethylene plate
of 1 mm
thickness
was
exposed
to the
wave.
The
short circuit
current measured
had the
shape expected
for a
corona
injected
charge, reversed polarity,
when charges
of
opposite sign were
injected.
Further,
the
charges were released
thermally
and the
current
was
reduced considerably,
as
expected.
Lewiner
(1986)
has
extended
the
pressure pulse method
to
include charges
due to
polarization
P
resulting
in a
total charge density
dP
p(x)
=
p
s
(x)-
—
(11.35)
ax
where
p
s
is the
charge density
due to the
space charge.
The
open circuit voltage between
the
two
electrodes
is
given
by
x
r
V(t)
=
j3G(s
r
)
$E(x,0)p(x,t)dx
(1
1.36)
o
where
Xf
=vt
is the
wave
front
which
is
moving towards
the
opposite
with
a
velocity
v,
G(s
r
)
is a
function
of the
relative permittivity which
in
turn
is a
function
of
pressure.
In
short circuit conditions
the
current I(t)
in the
external circuit
is
related
to the
electric
field
distribution
by
(
1L37
)
where
C
0
is the
uncompressed geometric capacitance,
C
0
=
S
0
s
r
A/d.
Equations
(11.36)
and
(11.37)
show that
if
p(jc,
t) is
known,
the
electric
field
distribution
may be
obtained
from
the
measurement
of
V(t)
or
I(t).
If the
pressure wave
is a
step like
function
of
amplitude
Ap
(fig.
1
1-9)
then V(t)
will
be a
mirror image
of the
spatial distribution
of the
potential
in the
sample
as
discovered
by
Laurenceau,
et al.
(1977),
whereas I(t)
is
directly
related
to the
electric
field. If the
pressure wave
is a
short duration pulse, then V(t)
and
I(t) give directly
the
spatial distributions
of the
electric
field and
charge density.
If the
pressure wave
profiles
change during
its
propagation through
the
sample, this
effect
can
be
taken into account
by a
proper description
of
p(x,
t). The
techniques used
to
generate
a
short rise time pressure waves
are
shock wave tubes, discharge
of
capacitors
in fluids,
TM
Copyright n 2003 by Marcel Dekker, Inc. All Rights Reserved.
piezoelectric transducers
and
short rise time laser pulses. Fig.
11.10
shows
a
typical
experimental
set up for the
laser pulse pressure pulse method.
electrodee
•
ample
fast
recorder
X-Y
recorder
computer
oecilloecope
Fig.
11.10
Experimental
set up for the
measurement
of
space
charge
(Lewiner,
1986,
©
IEEE)
The
choice
of the
laser
is
governed
by two
conditions.
First,
the
homogeneity
of the
beam must
be as
good
as
possible
to
give
a
uniform
pressure pulse over
the
entire
irradiated area. Second,
the
duration
of the
laser pulse
is
determined
by the
thickness
of
the
sample
to be
studied.
For
thin samples,
< 100
jam,
short duration pulses
of
0.1-10
ns
duration
are
appropriate.
For
thicker samples broader pulses
are
preferred since there
is
less
deformation
of the
associated pressure pulse
as it
propagates through
the
thickness.
The
power density
of the
laser beam between
10
6
-10
8
W/cm
2
yields good results.
The
measured voltage
and
current
in 50
um
thick
Teflon
(FEP)
film
charged with
negative corona
up to a
surface
potential
is of
1250
V is
shown
in
Fig.
11.11.
The
charge
decay
as the
temperature
of the
charged sample
is
raised,
is
shown
in
Fig.
11.12.
The
charged
surface
retains
the
charge longer than
the
opposite
surface,
and
higher
temperature
is
required
to
remove
the
charge entirely.
The
LIPP
technique
is
applied
with
several variations depending upon
the
method
of
generating
the
pressure pulse.
The
methods
are
briefly
described below.
TM
Copyright n 2003 by Marcel Dekker, Inc. All Rights Reserved.
6
10 -
«
tlm.
(n.)
40
Fig.
11.11
Current
and
voltage wave
forms
measured during
the
propagation
of a
pressure pulse
through
a
negative corona charged
FEP
film
of 50
jam
thickness.
T is the
time
for the
pulse
to
reach
the
charged
surface
(Lewiner,
1986,
©
IEEE).
120:
140
s
160'
180
V
200
s
220*
240*
260
20
40
tlm*
(n«)
60
Fig.
11.12
Charge decay with temperature
in
negative corona charged
FEP
film.
Charged side
retains charges longer
(LEWINER,
1986,
©
IEEE)
TM
Copyright n 2003 by Marcel Dekker, Inc. All Rights Reserved.
11.7.1
LASER
INDUCED
PRESSURE PULSE METHOD
(LIPP)
A
metal layer
on one
side
of a
dielectric absorbs energy when laser light
falls
upon
it.
This causes stress
effects
and a
pressure pulse,
< 500 ps
duration,
is
launched, which
propagates through
the
sample with
the
velocity
of
sound. Fig.
11.13
shows
the
experimental arrangement used
by
Sessler,
et
al.
17
.
The
method uses
one
sided metallized
samples
and it is
charged
at the
unmetallized
end by a
corona discharge.
The
laser light
pulses,
focused
on the
metallized
surface,
having
a
duration
of
30-70
ps and
1-10
mJ
energy,
are
generated
by a
Nd:YAG laser.
PULSED
LASER
\
FRONT
ELECTRODE
SAMPLE
N,
ABSORBING
,
LAYERX
\
r
PRESSURE!
PULSE
-SURFACE
CHARGE
SAMPLE-HOLDER
'ELECTRODE
AIR
GAP
/ELECTRODE
I—n>i—i®
I
L^-J
U-J
AMPLIFIER
OSCILLO
'SCOPE
Fig.
11.13
Experimental
setup
for the
laser-induced pressure-pulse (LIPP) method
for one
sided
metallized
samples (Sessler,
et
al.,
1986,
©
IEEE).
The
pressure
pulse
generates,
under
short
circuit
conditions,
the
current
signal
7(0
=
Apr
3*.
dx
(11.38)
x=vt
where
A is the
sample area,
p the
amplitude
of the
pressure,
i
the
duration
of the
pressure
pulse,
PO
the
density
of the
material,
s the
sample thickness,
g the air gap
thickness,
e
(x)
the
piezoelectric constant
of the
material,
s
s
the
static (dc) dielectric constant
and
£*,
the
infinity
frequency
dielectric constant.
TM
Copyright n 2003 by Marcel Dekker, Inc. All Rights Reserved.
11.7.2
THERMOELASTIC STRESS WAVES
This method
has
been adopted
by
Anderson
and
Kurtz
(1984).
When some portion
of an
elastic medium
is
suddenly heated
thermoelastic
stress
waves
are
generated.
A
laser
pulse
of
negligible duration enters
a
transparent solid
and
encounters
a
buried, optically
absorbing layer, causing
a
sudden appearance
of a
spatially dependent temperature rise
which
is
proportional
to the
absorbed energy.
optical absorber
laser
pulse
.^
\
sapphire
window
/
My
lay
lar
ers
-A
brass
AA,—
r»
fi~~
¥•—
^
50
Q
coax
V
i
io
6
Q
Fig.
11-14
(a)
Pressure pulse
in a
slab
of
dielectric containing
a
plane
of
charge
Q. The
pulse
travels
to the
right. Electrode
2 is
connected
to
ground through
a
co-axial cable
and
measuring
instrument,
(b)
Experimental arrangement
for
measuring
injected
space charge.
The
Mylar
film
adjacent
to the
sapphire window acquires internal charge
as a
result
of
being subjected
to
high-
field
stress prior
to
installation
in the
measurement cell. Thicknesses shown
are not to
scale.
(Anderson
and
Kurtz, 1984
© Am.
Inst.
Phys.)
The
thickness
of the
sample
in the x
direction
is
assumed
to be
small
compared
to the
dimensions along
the y and z
directions
so
that
we
have
a one
dimensional situation.
At
the
instant
of
energy absorption
the
solid
has
inertia
for
thermal expansion
and
hence
compressive
stress
appears
in the
solid.
The
stress
is
then relaxed
by
propagation,
in the
opposite
direction,
of a
pair
of
planar, longitudinal acoustic pulses which replicate
the
initial
stress
distribution. Each
of
these
pressure pulses carries away half
of the
mechanical displacement needed
to
relax
the
heated
region.
The
measured signal
is the
voltage
as a
function
of
time
and a
deconvolution procedure
is
required
to
determine
the
charge density (Anderson
and
Kurtz, 1984).
TM
Copyright n 2003 by Marcel Dekker, Inc. All Rights Reserved.