Structural changes in resorcinol formaldehyde aerogel seen by NMR
Bạn đang xem bản rút gọn của tài liệu. Xem và tải ngay bản đầy đủ của tài liệu tại đây (3.62 MB, 8 trang )
Microporous and Mesoporous Materials 317 (2021) 110988
Contents lists available at ScienceDirect
Microporous and Mesoporous Materials
journal homepage: />
Structural changes in resorcinol formaldehyde aerogel seen by NMR
´nika K´eri a, *, Bala
´zs Nagy b, Krisztina La
´szlo
´ b, Istva
´n Ba
´nyai a
Mo
a
b
University of Debrecen, Department of Physical Chemistry, H-4032, Debrecen, Egyetem t´er 1, Hungary
Budapest University of Technology and Economics, Department of Physical Chemistry and Materials Science, H-1521, Budapest, PO Box 91, Hungary
A R T I C L E I N F O
A B S T R A C T
Keywords:
Resorcinol-formaldehyde aerogel
Carbon aerogel
Pore morphology
NMR cryoporometry
Carbon aerogels prepared from resorcinol formaldehyde organic aerogels have a wide range of use due to their
considerably large specific surface area. Since the applications mostly happen in wet form, e.g. in aqueous
medium, NMR cryoporometry was employed to follow the porous behavior of an organic aerogel and its carbon
derivative, as well as the textural changes after the pyrolysis. Water and cyclohexane were used as hydrophilic
and hydrophobic probe molecules, respectively. In the polymer aerogel, saturated with water, by NMR we found
spherical mesopores confined by the aerogel beads and wide channels in the macropore size-range separating the
aggregated beads. After carbonization cylindrical pores were observed between the beads and the aggregates got
closer to each other. On the other hand, the hydrophobic cyclohexane probed exclusively the macropores, which
might be the result of local swelling. The micropore region both in the polymer and the carbonized form was
explored only by the low temperature gas adsorption measurements. The comparison of the two methods
confirmed that these techniques excellently complement each other in characterizing the micro-, meso- and
macropores of solid porous materials: vapor adsorption is superior in characterizing the micro- and meso
porosity, while NMR cryoporometry provides information about the pore geometry and size distribution in the
meso- and macropores.
1. Introduction
Resorcinol formaldehyde (RF) aerogels have many excellent prop
erties such as large specific surface area and tunable porosity [1–3].
Furthermore, RF polymer aerogels are also precursors of carbon aero
gels, which are relatively good electric conductors due to the carbon
matrix and heat insulators as a result of their porosity. Therefore these
materials attract great attention in adsorption, catalysis, energy storage,
and conversion applications [4]. Their applications in energy storage
devices (lithium ion batteries, supercapacitors, fuel cells, etc.) are
widely studied [5–8]. The open, interconnected pore network of micro-,
meso- and macropores, which can be tuned by the conditions of the
synthesis, drying and carbonization of the polymer aerogel, makes these
materials extremely high capacity adsorbents as well [9–12].
RF based carbon aerogels are obtained after the pyrolysis of the RF
polymer aerogels. During the polymer to carbon conversion also the
texture of the aerogel undergoes important changes. The microporosity
generally increases, resulting in an increase of the apparent surface area.
On the other hand, the alterations in the meso- and macropore regions
may be more sensitively affected by the experimental conditions
[13–16]. Gas adsorption methods are the most widely used vehicles for
the characterization of the porosity and pore size distribution. Electron
microscopic methods, scattering (e.g., SAXS and SANS), and various
spectroscopies can be used to complete the textural and, occasionally,
the surface chemical information [17]. Most of these techniques provide
information about the solid sample in evacuated conditions. However,
the above-mentioned applications take place in a solvent, mostly
aqueous medium. Therefore, from the application point of view, the
investigation of the porous structure in liquid medium is essential.
Recently, nuclear magnetic resonance (NMR) cryoporometry has
appeared more frequently in the literature for characterizing the pore
shape and size [18–25]. It takes advantage of the melting and freezing
point depressions of liquids confined in pores. Water and organic sol
vents (e.g., cyclohexane) are often used as probe liquids depending on
the character of the porous matrix. While the RF polymer aerogels
contain phenolic hydroxyl groups, their pyrolysis results in carbon
aerogels of a more hydrophobic character. However, the skeleton of
carbon aerogels is often decorated with hydrophilic functional groups.
* Corresponding author. Department of Physical Chemistry, H-4032, Debrecen, Egyetem t´
er 1, Hungary.
E-mail addresses: (M. K´
eri), (B. Nagy), (K. L´
aszl´
o),
hu (I. B´
anyai).
/>Received 1 December 2020; Received in revised form 20 January 2021; Accepted 13 February 2021
Available online 24 February 2021
1387-1811/© 2021 The Authors. Published by Elsevier Inc. This is an open access article under the CC BY license ( />
M. K´eri et al.
Microporous and Mesoporous Materials 317 (2021) 110988
Cadar et al. compared the wetting of carbon xero- and aerogels in water
and cyclohexane. They observed a non-uniform water distribution,
while the cyclohexane forms a uniform, strongly attached surface layer
[26,27]. On this basis, we assume that cryoporometry measurements
carried out with both liquids (water and cyclohexane) can give extra
information about the pore structure compared to the conventional
methods.
NMR cryoporometry has already been applied in the case of carbonbased materials. Ghosh et al. [28] investigated the freezing of water
inside carbon nanotubes of 1.4 nm diameter by NMR cryoporometry,
and were able to distinguish water inside the nanotube and adsorbed on
the wall. It must be noted that their cryoporometry experiments were
made far out of the so-called large pore limit, where the quantitative
evaluation of the data is possible [23]. Zhao et al. found correlating
NMR cryoporometry and nitrogen adsorption pore size distribution
curves for coal samples [29]. Krutyeva et al. combined gas adsorption,
NMR cryoporometry, and some other NMR methods to characterize
carbon molecular sieves and activated carbons [30]. They systematically
built up a characterization protocol as follows: the specific surface area
and the porosity were accepted from the gas sorption, while the pore size
distribution from the NMR cryoporometry on samples, completely
saturated with nitrobenzene.
The aim of our work was to determine the morphology of an RF
polymer aerogel (PA) and the derived carbon aerogel (CA) in liquid
media, and to study the applicability of NMR cryoporometry to follow
the textural changes during the pyrolysis process. The texture of the
aerogels was characterized by NMR cryoporometry, nitrogen and water
vapor adsorption as well as scanning electron microscopy (SEM) to
reveal the compatibility of the methods. Cryoporometry measurements
were carried out in aqueous and cyclohexane media to understand the
role of the polarity of the probe liquids.
gas sorption analyzer instrument to determine the surface area and pore
size distributions of the aerogels. The BET model was used to obtain the
apparent surface area from the isotherms [33]. The volume of micro
pores was derived from the Dubinin-Radushkevich (DR) model [34]. As
no kernel files, necessary for DFT based calculations, are available for
polymers, the pore size distributions were calculated with the Barrett,
Joyner and Halenda (BJH) model [35]. The use of this model limits the
window of the pore size distribution curves. The pore size distribution of
the carbon gel was calculated with the NLDFT equilibrium model. The
best fit (fitting error 0.65%) was obtained with slit-like pore geometry.
Data evaluation was carried out with the software of the manufacturer of
the instrument (ASiQwin version 3.0).
Water vapor sorption was applied for the hydrophilic/hydrophobic
characterization. The isotherm was measured on a static volumetric
Hydrosorb (Quantachrome) water vapor sorption analyzer at 293 K.
2. Experimental
where n is a factor characteristic for the pore geometry, Kc is the cry
oporometric constant of the liquid, and rp is the radius for spherical and
cylindrical pores, and the half-distance between planar surfaces [23]. n
is 3, 2 and 1 for spherical, cylindrical and slit-shaped geometry respec
tively for the freezing, while 2, 1, and 0 for the melting process. It is
obtained from the different mechanism of freezing and melting, if no
special bottle-effect or uncontrollable delay by nucleation occurs on
cooling. It means that in certain cases a hysteresis can be observed on the
freezing-melting curves [22–25]. The NMR pore size distributions are
often compared favorably with gas adsorption results; nevertheless gas
adsorption data are occasionally used for the calibration of the NMR
methods [30,39]. When the gas sorption and cryoporometric experi
ments give different results, either of them can be correct but holds
different or complementary information. With careful interpretation,
they can turn the results more reliable.
Cryoporometric experiments were carried out on the RF polymer
aerogel (PA) and its carbon derivative (CA) fully saturated with the
probe liquids. The gels were introduced into plastic NMR tubes and
loaded with deionized (Milli-Q) water. In the case of CA, cyclohexane
(AnalaR NORMAPUR® ACS, Reag. Ph. Eur) was also used as probe
2.3. NMR experiments and data evaluation
NMR cryoporometry is used for determining the pore size distribu
tion of wetted porous materials. Since this technique is less known, we
briefly introduce its theoretical background in the following.
Cryoporometry is based on the phenomena that liquids in a confined
geometry (=pore) melt and freeze at lower temperatures (Tm/f) than in
the bulk phase (T0) [36]. By liquid-phase NMR only the molten phase is
detected, thus the melting and freezing processes can be followed
through the detected intensity of the NMR signal by changing the tem
perature. Using a modified form of the Gibbs-Thompson equation (eq.
(1)) the pore size and pore size distribution can be calculated [37].
ΔTm/f = Tm/f − T0 = −
2.1. Synthesis of the aerogels
The aerogel samples were prepared similarly to the first reported
synthesis of polymer and carbon aerogels [31]. Briefly, first a resorcinol
(R)-formaldehyde (F) hydrogel was prepared with an R/catalyst
(Na2CO3) mass ratio of 50. After changing the water to acetone, the wet
gel was dried in supercritical CO2 yielding the polymer aerogel, PA
(48%) [32]. The dry gel was converted to carbon aerogel, CA, in a rotary
quartz reactor at 1173 K for 1 h in a 25 mL/min high purity nitrogen
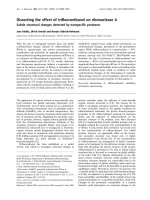
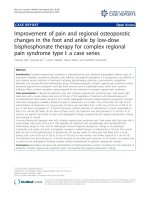
flow (99.996%, Linde). The preparation process is summarized in Fig. 1.
2.2. Characterization
Scanning and transmission electron microscopy (SEM and TEM,
respectively) were used for taking the image of the texture (Hitachi
SU8030 and JEM2011).
Low temperature nitrogen adsorption measurements (77 K) were
carried out with a NOVA 2000e (Quantachrome) automatic volumetric
nKc
rp
Fig. 1. Scheme of the preparation of RF polymer and carbon aerogels from hydrogel.
2
(1)
M. K´eri et al.
Microporous and Mesoporous Materials 317 (2021) 110988
liquid. Before the NMR experiment, we waited at least one day for the
diffusion of the liquid into the aerogels. After the calibration of several
parameters (90◦ pulse length, echo time, etc.) the samples were frozen at
233 K. Dried, cold air and a cooling unit (BSCU 05) was used for cooling
the probe head (400 MHz inverse broadband probe head). The tem
perature was changed from 264 K to about 274 K for water and to 282 K
for cyclohexane filled samples and 1H spectra were recorded at every
0.1, 0.2 or 0.5 K step after a temperature equilibration of 5 min. The
thermometer was previously calibrated against ethylene glycol and
methanol [40]. The temperature calibration was also confirmed by the
bulk transition temperature of the probe liquids. The 1H NMR spectrum
of the sample was recorded by a spin echo sequence to eliminate the
broad signal of the frozen liquid during the echo time, which was
typically 0.5–1 ms [23]. MestReNova 9.0© was used for the
post-processing. To follow the melting and freezing processes the peak
integrals of the molten liquid were plotted as a function of the temper
ature. From the melting-freezing hysteresis the pore geometry was
deduced and according to eq. (1) pore radii were calculated. The Kc was
taken as 30 nm K for water and 96 nm K for cyclohexane according to
Petrov and Furo [23]. The pore size distribution curves were plotted
after the numerical derivation of the integral - pore radius function in
the following way: the measured data were fitted with asymmetric lo
gistic curves (like Richards and Gompertz growth functions) using the
OriginPro 8.6© software and the analytical derivatives were calculated
[41].
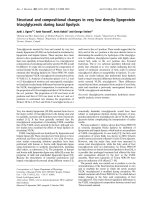
closure point of the loops, marking the cavitation induced evaporation is
at ca p/p0 0.65 in the polymer and is shifted to 0.75 after the pyrolysis.
The SEM images and the shape of the isotherms confirm the textural
similarity of PA and CA. The isotherm is practically shifted upward as a
result of the pyrolysis. The most significant change is an intensive in
crease occurring in the microporous region. The opposite trend in the
total pore volume (Fig. 3 and Table 1.) can be explained by the limits of
the nitrogen adsorption technique. The enhanced microporosity also
leads to the increase of the apparent surface area and a more than 50%
drop of the average pore size (dave) detected by this technique (Table 1.).
The comparison of the pore size distributions calculated from the cor
responding branches of the isotherms confirms that the pyrolytic heat
treatment does not alter the pore size distribution in the mesopore range
[10,43]. The DFT based pore size distribution of CA (Fig. 3b, inset) re
veals the existence of micropores in the 1–2 nm range and confirms the
presence of the mesopores seen in the BJH distribution.
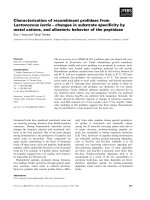
Water vapor adsorption of the carbon aerogel provides information
about the hydrophilic/hydrophobic character of the porous material. It
is important to know, that XPS analysis revealed that the surface con
– O and 47.6% in R–OH or
tains 5.4 atomic % O, 49.1% of which is in C–
R-O-R forms [44]. Indeed, the initial slope of the water vapor isotherm
of the carbon gel (Fig. 4) shows that the surface of the carbon contains
enough polar groups to adsorb water even at low relative humidity.
3.2. Morphology of the aerogels seen by NMR
3. Results and discussion
The pore structure of PA immersed in water was studied by NMR
cryoporometry. The expected results allow to test the potential
morphological changes in water and the compatibility of the adsorption
and NMR methods. Fig. 5a shows the freezing and melting processes of
water in the saturated polymer aerogel. The two overlapping melting
curves (empty symbols in Fig. 5a) show the good reproducibility of the
experiment. The molten water appears first at around 266 K, and a
melting process shows up in a wide temperature range up to 271 K with
an inflexion point at about 269.5 K. This melting is accompanied by a
freezing step between 269 and 264 K, showing an inflexion point at
267.8 K. The ratio of the freezing (ΔTf = 5.35 K) and melting point
depression (ΔTm = 3.65 K) equals 1.5, which coincides with the spher
ical pore geometry model in the large pore limit according to Petrov and
Furo [23].
The second sharp melting step around 273.2 K belongs to bulk water.
The corresponding freezing process is shifted to ca. 272 K. Considering
some theoretical arguments of Petrov and Furo [23,24], like the influ
ence of the pore geometry and pore wall curvature on the
freezing-melting hysteresis, this effect is characteristic for slit-like pores.
It means a spatial dimension being infinite in two directions (at least in
the size-range of NMR cryoporometry) and finite in one direction, thus
can be interpreted as a wide channel as well. The ratio of the signal
integral of the two freezing steps indicates the distribution of pore water
in the different pore types, namely that ca. 11% of water is located in the
3.1. Morphology of the aerogels seen by vapor adsorption
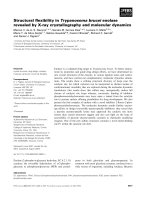
The electron microscopic images of the aerogels are shown in Fig. 2,
revealing the presence of pores in a wide size range as well as their
interconnected nature. The size of the beads is about 30 nm in the
polymer and 12 ± 3 nm in the carbon aerogel.
The morphology of PA and CA was characterized by low temperature
N2 adsorption measurements. Fig. 3 shows the adsorption isotherms and
the pore size distributions (diameter, d) derived from both the adsorp
tion and desorption branches. As no kernel file is available for polymer
samples necessary for DFT based calculations, we used the BJH model
for the sake of comparison.
The nitrogen adsorption/desorption isotherms of the aerogels are of
type IV(a) according to the IUPAC classification revealing an inter
connected pore network of aggregated particles [42]. Although the PA
contains micropores, wider mesopores and macropores dominates its
porosity. After the pyrolysis the type of the isotherm conserved, how
ever, due to the thermal treatment of the polymer beads the contribution
of the micropores significantly increased. The isotherms have a hyster
esis loop of type H3, i.e., the pore network also contains macropores not
completely filled with liquid nitrogen. Their size, as seen by SEM/TEM,
exceeds the upper limit of the nitrogen adsorption technique. The
Fig. 2. SEM and HRTEM images of the aerogels. a) SEM of the polymer aerogel, the scale bar is 5 μm. b) SEM and c) HRTEM of the carbon sample. The scale bars are
0.5 μm and 10 nm, respectively.
3
M. K´eri et al.
Microporous and Mesoporous Materials 317 (2021) 110988
Fig. 3. a) Low temperature nitrogen adsorption/desorption isotherms; b) semi-logarithmic plot of pore size distribution from the adsorption and c) desorption
branches calculated with the BJH model. The inset of b) shows the linear plot from NLDFT calculation for slit-shaped pores. Full symbols (red): PA, open symbols
(black): CA. (For interpretation of the references to colour in this figure legend, the reader is referred to the Web version of this article.)
aerogel beads of 30 nm. Considering the slit-like pores or wide channels
the distribution of the wall distance has a characteristic value of about
52 nm, but the pore size distribution is quite broad (derived from the
freezing curve). Comparing this result with the SEM image of PA
(Fig. 2a) we can conclude that the wide channels mean connected water
layers between the aggregated beads in the macrostructure. These sizes
are in the same range as the pore size distribution determined by N2
adsorption experiments (Fig. 3c red dots). The broad size distributions
extinguish the differences arising from the applied geometrical ap
proaches of the two methods.
Summarizing the results of PA: micropores can be well detected with
gas porosimetry, but are below the size limit of NMR cryoporometry;
mesopores are detected similarly by both methods. We can state that the
apparent mesopore structure does not significantly change in aqueous
medium, but the cryoporometry could define two locations of different
geometries and the distribution of water between them.
The structural changes of the aerogel after the carbonization
(resulting in CA) have been also studied by NMR cryoporometry. As seen
Table 1
Data derived from N2 gas adsorption/desorption adsorption measurement.
Sample
PA
CA
a
b
c
d
e
SBETa
Vmicrob
2
3
VTOTc
3
Vmesod
3
davee
m /g
cm /g
cm /g
cm /g
nm
483
1016
0.31
0.42
1.74
1.53
1.43
1.11
14.4
6.0
Apparent surface area from the BET model.
Micropore volume from DR model.
Total pore volume from N2 adsorption.
Vmeso = VTOT - Vmicro.
dave = 4VTOT/SBET.
spherical pores, while ca. 89% is confined to the wide channels.
The pore size distributions (Fig. 5b) were calculated by eq. (1) for the
appropriate geometries. The pores, considered as spherical, has a char
acteristic diameter of ca. 30 nm (calculated on the basis of the melting
process) and can be interpreted as water drops surrounded by the
4
M. K´eri et al.
Microporous and Mesoporous Materials 317 (2021) 110988
the bulk transition point (273.15 K), thus it indicates probably two
melting processes. It leads to the conclusion that beside the wide
channels another pore-geometry is present in the same temperature
range, and the freezing and melting curves of the two geometries
overlap. To model this phenomenon, we simulated the overlapping
processes as seen in Fig. 6a. The measured freezing curve between 268
and 270 K, and the measured melting process up to 272.8 K show a
hysteresis typical of cylindrical pores with ΔTf/ΔTm ≈ 2, which is esti
mated with blue dashed lines. The melting curve of slit-like water was
assumed steep at 273.1 K, while the freezing process was simulated from
the remained measured points of the freezing curve, and signed with
orange dot-and-dash lines. The total of the simulated freezing curves
(green dotted line) well coincides with the measured points. From the
maximum of the integrals the water amount in different geometries
resulted in ca. 40% for slits and 60% for cylindrical pores, thus, the
distribution of water in the confinements significantly changes after
carbonization. The most frequent pore sizes of the slit-like and cylin
drical pores are 28 and 36 nm respectively (Fig. 6b), which match the
pore size distribution ranges obtained from the nitrogen adsorption
experiment (slit geometry from NLDFT, Fig. 3b inset, and cylindrical
from the BJH method, Fig. 3c). Nevertheless, we are aware that the two
methods have differences in geometrical interpretations [23] and
further experiments are needed for more definite conclusions.
Compared to the polymer aerogel the wall distance of the wide
channels significantly decreased and the size-distribution is narrower in
CA. It means that the aggregated beads got closer to each other as a
result of the pyrolysis. Inside the aggregates cylindrical channels are
assessed in the same size-range, instead of the spherical pores of PA. The
distribution of water is more balanced between the two domains, indi
cating a pore network being more permeable for water molecules. There
may be another reason which can contribute to the explanation of the
structural differences: PA is a softer material than CA, therefore
immersing the samples in water can give a different picture about the
morphology from nitrogen porosimetry.
Since carbon aerogels have a hydrophobic carbon skeleton, cyclo
hexane as a non-polar probe liquid was also tested for CA. Two meltingfreezing processes can be distinguished: one belongs to the bulk cyclo
hexane at 280 K, the other process shows a definite hysteresis with the
ratio of ΔTf/ΔTm = 2, referring to cylindrical pores (Fig. 7a). The re
sidual signal integral can be attributed to the remained frozen
Fig. 4. Water vapor adsorption/desorption isotherms of the CA sample at
293 K.
in Fig. 6a the melting and freezing steps corresponding to the spherical
pores cannot be detected any longer.
The freezing point depression characteristic for the wide channels
remained, but the hysteresis became wider (ca. 2 K) indicating
decreasing wall distance due to carbonization (Fig. 6a). As already
mentioned, in the case of slit-like pores no melting-point depression is
detectable, the heating process results in the melting point of bulk water
[23,24]. However, the melting curve of CA is not as steep as expected at
Fig. 5. a) Freezing (●) and melting (○,◊) curves of water in the PA sample. The different empty symbols show the reproducibility of the curves (second cycle).
Double arrows show the melting (ΔTm) and freezing point (ΔTf) depressions. b) Pore size distributions of spherical (○) and slit-like (●) pores in PA. Solid lines are a
guide to the eyes.
5
M. K´eri et al.
Microporous and Mesoporous Materials 317 (2021) 110988
Fig. 6. a) Freezing (●) and melting (○) curves of water in the CA sample. Lines are simulated curves (details in text): dashed (blue) for cylinder geometry, dot-anddash (orange) for slit geometry, while the dotted (green) line is their sum (freezing branches). Percentages show the contribution of the different geometries. b) Pore
size distributions derived from the simulated freezing curves with the corresponding lines. (For interpretation of the references to colour in this figure legend, the
reader is referred to the Web version of this article.)
Fig. 7. a) Freezing (●) and melting (○) curves of cyclohexane in CA. b) Pore size distribution derived from the melting (○) curve with cylindrical geometry.
cyclohexane which is not relaxed during the applied echo time [23,45].
The broad pore size distribution has a maximum at diameter (d) ca. 110
nm (Fig. 7b) meaning that cyclohexane was detected in large, cylindrical
channels. We assume that these correspond to the interconnected pore
network among the aggregated particles of the aerogel structure.
There may be several factors that result in the difference of the pore
morphology determined by the two probe liquids applied:
(ii) There are hydrophilic groups (as seen from the water vapor
adsorption isotherm) on the otherwise hydrophobic carbon skeleton.
We presume that cyclohexane might not penetrate into the micro
pores and narrower mesopores if their inlet is blocked by the polar
groups.
(iii) Another aspect is the unique behavior of cyclohexane as a probe
liquid. For carbon-based materials it is advantageous that cyclo
hexane is hydrophobic. Its cryoporometric constant (Kc) is high, but
also depends on the quality of the surface (we used a value from
literature [23]). Below the transition temperature a plastic phase
appears between the liquid and frozen crystalline states and the
rotational diffusion of the molecules in the plastic phase results in the
lengthening of the transverse relaxation time (T2) [47]. This in
fluences the NMR signal, thus the melting/freezing curves, and might
affect the detection of cyclohexane in smaller confinements as well.
(i) According to a previous study, polymer-based carbons, with hy
drophilic groups on their surface, show local swelling in non-polar
solvents, like cyclohexane, with almost negligible macroscopic
swelling [46]. It means that during the swelling the distance sepa
rating the beads of the aerogel structure decreases, i.e., the pores
shrink. This argument can explain why the mesopores of CA cannot
be detected with cyclohexane and on the other hand, the observed
macropores might be the result of the shrinkage of the larger mac
ropores originally out of the scope of the technique (but seen in the
SEM and TEM images, Fig. 2b–c).
4. Conclusions
The objective of this work was a comparative analysis of aerogel
6
M. K´eri et al.
Microporous and Mesoporous Materials 317 (2021) 110988
samples using a widely applied and well standardized method (vapor
adsorption) and a recently adapted NMR technique (NMR cry
oporometry). We found similarities and differences in the results. The
pore structure of an RF polymer aerogel and its carbon aerogel deriva
tive was investigated by low temperature nitrogen adsorption in vapor
phase and NMR cryoporometry in liquid phase. Water and cyclohexane
were used as polar and non-polar immersion media.
The comparison of the results shows that the two methods provide
complementary information about the texture of the porous systems
investigated. The microporous region can be explored by N2 adsorption,
in the mesopore size-range both techniques provide similar pore size
distribution, while NMR cryoporometry expands the observation limit
toward the macropore region. The combined application of the two
methods allows a more detailed structural study of porous materials
including the structural changes resulted from the carbonization and the
occasional change of the morphology caused by the probe liquids.
It is demonstrated that the employment of carefully selected liquids,
e.g., a polar and a non-polar solvent, may provide further information
about the potential differences in gas and liquid media, bringing the
characterization closer to the conditions of the real applications.
[9] N. Job, R. Pirard, J. Marien, J.-P. Pirard, Porous carbon xerogels with texture
tailored by pH control during sol–gel process, Carbon 42 (3) (2004) 619–628.
[10] O. Czakkel, K. Marthi, E. Geissler, K. L´
aszl´
o, Influence of drying on the morphology
of resorcinol–formaldehyde-based carbon gels, Microporous Mesoporous Mater. 86
(1) (2005) 124–133.
[11] C. Macías, P. Lavela, G. Rasines, M.C. Zafra, J.L. Tirado, C.O. Ania, On the
correlation between the porous structure and the electrochemical response of
powdered and monolithic carbon aerogels as electrodes for capacitive
deionization, J. Solid State Chem. 242 (2016) 21–28.
[12] B. Nagy, I. Bakos, I. Bert´
oti, A. Dom´
an, A. Menyh´
ard, M. Mohai, K. L´
aszl´
o,
Synergism of nitrogen and reduced graphene in the electrocatalytic behavior of
resorcinol - formaldehyde based carbon aerogels, Carbon 139 (2018) 872–879.
[13] H. Tamon, H. Ishizaka, T. Araki, M. Okazaki, Control of mesoporous structure of
organic and carbon aerogels, Carbon 36 (9) (1998) 1257–1262.
[14] H. Tamon, H. Ishizaka, M. Mikami, M. Okazaki, Porous structure of organic and
carbon aerogels synthesized by sol-gel polycondensation of resorcinol with
formaldehyde, Carbon 35 (6) (1997) 791–796.
[15] V. Bock, A. Emmerling, J. Fricke, Influence of monomer and catalyst concentration
on RF and carbon aerogel structure, J. Non-Cryst. Solids 225 (1998) 69–73.
[16] M. Mirzaeian, P.J. Hall, The control of porosity at nano scale in resorcinol
formaldehyde carbon aerogels, J. Mater. Sci. 44 (10) (2009) 2705–2713.
[17] R. Kleinberg, Nuclear magnetic resonance, in: R. Celotta, T. Lucatorto (Eds.),
Methods in the Physiscs of Porous Media, Academic Press1999, pp. 337-385.
[18] V.M. Gun’ko, V.V. Turov, Nuclear Magnetic Resonance Studies of Interfacial
Phenomena, CRC Press, NewYork, 2013, pp. 455–522.
[19] D.T. Shane, R.L. Corey, C. McIntosh, L.H. Rayhel, R.C. Bowman, J.J. Vajo, A.
F. Gross, M.S. Conradi, LiBH4 in carbon aerogel nanoscaffolds: an NMR study of
atomic motions, J. Phys. Chem. C 114 (9) (2010) 4008–4014.
[20] F. D Orazio, S. Bhattcharja, J.C. Tarczon, W.P. Halperin, Magnetic resonance
relaxation analyísis of porous media, in: J. Klafter, J.M. Draker (Eds.), Molecular
Dynamics in Resricted Geometries, Wiley, New York, 1989.
[21] P.J. Barrie, Characterization of porous media using NMR methods, Annu. Rep.
NMR Spectrosc. 41 (2000) 265–316.
[22] O.V. Petrov, I. Fur´
o, Curvature-dependent metastability of the solid phase and the
freezing-melting hysteresis in pores, Phys. Rev. 73 (2006), 011608.
[23] O.V. Petrov, I. Fur´
o, NMR cryoporometry: principles, applications and potential,
Prog. Nucl. Magn. Reson. Spectrosc. 54 (2) (2009) 97–122.
[24] O. Petrov, I. Fur´
o, A study of freezing–melting hysteresis of water in different
porous materials. Part II: surfactant-templated silicas, Phys. Chem. Chem. Phys. 13
(36) (2011) 16358–16365.
[25] O. Petrov, I. Fur´
o, A study of freezing–melting hysteresis of water in different
porous materials. Part I: porous silica glasses, Microporous Mesoporous Mater. 138
(1) (2011) 221–227.
[26] C. Cadar, C. Cotet, L. Baia, I. Ardelean, Probing the connectivity and wettability of
carbon aerogels and xerogels via low-field NMR, AIP Conference Proceedings 2017
(1) (1917), 040006.
[27] C. Cadar, C. Cotet, L. Baia, L. Barbu-Tudoran, I. Ardelean, Probing into the
mesoporous structure of carbon xerogels via the low-field NMR relaxometry of
water and cyclohexane molecules, Microporous Mesoporous Mater. 251 (2017)
19–25.
[28] S. Ghosh, K.V. Ramanathan, A.K. Sood, Water at nanoscale confined in singlewalled carbon nanotubes studied by NMR, Europhys. Lett. 65 (5) (2004) 678.
[29] Y. Zhao, Y. Sun, S. Liu, K. Wang, Y. Jiang, Pore structure characterization of coal by
NMR cryoporometry, Fuel 190 (2017) 359–369.
[30] M. Krutyeva, F. Grinberg, F. Furtado, P. Galvosas, J. Karger, A. Silvestre-Albero,
A. Sepulveda-Escribano, J. Silvestre-Alberto, F. Rodriguez-Reinoso,
Characterization of carbon materials with the help of NMR methods, Microporous
Mesoporous Mater. 120 (1–2) (2009) 91–97.
[31] R.W. Pekala, Organic aerogels from the polycondensation of resorcinol with
formaldehyde, J. Mater. Sci. 24 (9) (1989) 3221–3227.
[32] O. Czakkel, E. Sz´ekely, B. Koczka, E. Geissler, K. L´
aszl´
o, Drying of
resorcinol–formaldehyde gels with CO2 medium, Microporous Mesoporous Mater.
148 (1) (2012) 34–42.
[33] S. Brunauer, P.H. Emmett, E. Teller, Adsorption of gases in multimolecular layers,
J. Am. Chem. Soc. 60 (2) (1938) 309–319.
[34] M.M. Dubinin, L.V. Radushkevich, The Equation of the Characteristic Curve of
Activated Charcoal, Chem. Zentr., 1947, pp. 875–890.
[35] E.P. Barrett, L.G. Joyner, P.P. Halenda, The determination of pore volume and area
distributions in porous substances. I. Computations from nitrogen isotherms,
J. Am. Chem. Soc. 73 (1) (1951) 373–380.
[36] J.H. Strange, M. Rahman, E.G. Smith, Characterization of porous solids by NMR,
Phys. Rev. Lett. 71 (21) (1993) 3589–3591.
[37] W.P. Halperin, F. D Orazio, S. Bhattacharja, C.J. Traczon, Magnetic resonance
relaxation analysis of porous media, in: J. Klafter, J.M. Drake (Eds.), Molecular
Dynamics in Restricted Geometrics, Wiley, New York, 1989, p. 331.
[39] R.M.E. Valckenborg, L. Pel, K. Kopinga, Combined NMR cryoporometry and
relaxometry, J. Phys. Appl. Phys. 35 (3) (2002) 249.
[40] C. Ammann, P. Meier, A. Merbach, A simple multinuclear NMR thermometer,
J. Magn. Reson. 46 (2) (1969) 319–321, 1982.
[41] D. Kehl, B. Sipos, A telítˆ
od´esi, a logisztikus
es az
eletgă
orbe alakỳ trendfỹggvenyek
becsl
ese Excel parancsf
ajl segớtsegevel, Statisztikai Szle. 87 (4) (2009) 381–411 (in
Hungarian).
[42] M. Thommes, K. Kaneko, V. Neimark Alexander, P. Olivier James, F. RodriguezReinoso, J. Rouquerol, S.W. Sing Kenneth, Physisorption of gases, with special
reference to the evaluation of surface area and pore size distribution (IUPAC
Technical Report), Pure Appl. Chem. (2015) 1051.
CRediT authorship contribution statement
´ nika Ke
´ri: experimental work, data evaluation, Writing – original
Mo
´zs Nagy: experimental work. Krisztina La
´szlo
´ : data evalu
draft. Bala
´ n Ba
´nyai: preliminary experiments,
ation, Writing – original draft. Istva
Conceptualization, Project administration.
Declaration of competing interest
The authors declare that they have no known competing financial
interests or personal relationships that could have appeared to influence
the work reported in this paper.
Acknowledgements
The research has been implemented with the support provided from
the National Research, Development and Innovation Fund of Hungary,
´nika K´
financed under the OTKA: K_131989 funding scheme. Mo
eri is
grateful for the National Research, Development and Innovation Fund of
Hungary (OTKA: PD_135169) for financial support. The research was
also supported by the EU and co-financed by the European Regional
Development Fund under the project GINOP-2.3.2-15-2016-00008 and
VEKOP-2.3.2-16-2017-00013. The research reported in this paper and
carried out at BME has been supported by the NRDI Fund (TKP2020 IES,
Grant No. BME-IE-BIO) based on the charter of bolster issued by the
NRDI Office under the auspices of the Ministry for Innovation and
Technology. Some figures were created with BioRender.com.
References
[1] M. Schwan, R. Tannert, L. Ratke, New soft and spongy resorcinol-formaldehyde
aerogels, J. Supercrit. Fluids 107 (2016) 201–208.
[2] J.P. Lewicki, C.A. Fox, M.A. Worsley, On the synthesis and structure of resorcinolformaldehyde polymeric networks - precursors to 3D-carbon macroassemblies,
Polymer 69 (2015) 45–51.
[3] S.A. Al-Muhtaseb, J.A. Ritter, Preparation and properties of resorcinolformaldehyde organic and carbon gels, Adv. Mater. 15 (2) (2003) 101–114.
[4] A. Arenillas, J.A. Men´
endez, G. Reichenauer, A. Celzard, V. Fierro, F.J. MaldonadoH´
odar, E. Bail´
on, N. Job, Organic and carbon gels. From laboratory synthesis to
applications. Book Series: Advances in Sol-Gel Derived Materials and Technologies,
Springer, Berlin/Heidelberg, Germany, 2019.
[5] E. Frackowiak, F. B´eguin, Carbon materials for the electrochemical storage of
energy in capacitors, Carbon 39 (6) (2001) 937–950.
[6] C. Moreno-Castilla, F.J. Maldonado-H´
odar, Carbon aerogels for catalysis
applications: an overview, Carbon 43 (3) (2005) 455–465.
[7] L.W. Hrubesh, Aerogel applications, J. Non-Cryst. Solids 225 (1998) 335–342.
[8] Y. Zhu, H. Hu, W. Li, X. Zhang, Resorcinol-formaldehyde based porous carbon as an
electrode material for supercapacitors, Carbon 45 (1) (2007) 160–165.
7
M. K´eri et al.
Microporous and Mesoporous Materials 317 (2021) 110988
[43] B. Nagy, I. Bakos, E. Geissler, K. L´
aszl´
o, Water-ionic liquid binary mixture tailored
resorcinol-formaldehyde carbon aerogels without added catalyst, Materials 12 (24)
(2019) 4208.
[44] B. Nagy, S. Villar-Rodil, J.M.D. Tasc´
on, I. Bakos, K. L´
aszl´
o, Nitrogen doped
mesoporous carbon aerogels and implications for electrocatalytic oxygen reduction
reactions, Microporous Mesoporous Mater. 230 (2016) 135–144.
[45] F. Zhu, W. Hu, J. Cao, B. Liu, Y. Liu, C. Chang, Probe material choice for nuclear
magnetic resonance cryoporometry (NMRC) measurements of the nano-scale pore
size distribution of unconventional reservoirs, Energy Explor. Exploit. 37 (1)
(2019) 412–428.
[46] K. L´
aszl´
o, O. Czakkel, K. Josepovits, C. Rochas, E. Geissler, Influence of surface
chemistry on the SAXS response of polymer-based activated carbons, Langmuir 21
(18) (2005) 8443–8451.
[47] J.B.W. Webber, Studies of nano-structured liquids in confined geometries and at
surfaces, Prog. Nucl. Magn. Reson. Spectrosc. 56 (1) (2010) 78–93.
8