1 quant reading 4 common probability distributions answers
Bạn đang xem bản rút gọn của tài liệu. Xem và tải ngay bản đầy đủ của tài liệu tại đây (1.04 MB, 47 trang )
Question #1 of 96
Question ID: 1456450
For a continuous uniform distribution that can take on values only between 2 and 10, the
probability of an outcome:
A) equal to 4 is 11.1%.
B) less than 3 is 12.5%.
C) greater than 5 is 27.5%.
Explanation
The probability of an outcome less than 3 is (3 – 2) / (10 – 2) = 12.5%. For a continuous
distribution, the probability of any single outcome is zero.
(Module 4.1, LOS 4.d)
Question #2 of 96
Question ID: 1456430
Which of the following statements about probability distributions is least accurate?
A)
B)
A probability distribution includes a listing of all the possible outcomes of an
experiment.
In a binomial distribution each observation has only two possible outcomes that
are mutually exclusive.
C) A probability distribution is, by definition, normally distributed.
Explanation
Probabilities must be zero or positive, but a probability distribution is not necessarily
normally distributed. Binomial distributions are either successes or failures.
(Module 4.1, LOS 4.a)
Question #3 of 96
Question ID: 1456493
Which of the following portfolios provides the optimal "safety first" return if the minimum
acceptable return is 9%?
Portfolio Expected Return (%) Standard Deviation (%)
1
13
5
2
11
3
3
9
2
A) 2.
B) 3.
C) 1.
Explanation
Roy's safety-first criterion requires the maximization of the SF Ratio:
SF Ratio = (expected return – threshold return) / standard deviation
Portfolio Expected Return (%) Standard Deviation (%) SF Ratio
1
13
5
0.80
2
11
3
0.67
3
9
2
0.00
Portfolio #1 has the highest safety-first ratio at 0.80.
(Module 4.2, LOS 4.k)
Question #4 of 96
Question ID: 1456515
A random variable with which of the following probability distributions will have the greatest
probability of an outcome more than two standard deviations from the mean?
A) Student’s t-distribution with 18 degrees of freedom.
B) Student’s t-distribution with 15 degrees of freedom.
C) Standard normal distribution.
Explanation
For degrees of freedom less than about 120, Student's t-distribution has fatter tails and
larger probabilities of extreme outcomes compared to the standard normal distribution.
For Student's t-distribution, the lower the degrees of freedom, the fatter the tails and the
greater the probability of extreme outcomes.
(Module 4.3, LOS 4.n)
Question #5 of 96
Question ID: 1456453
A casual laborer has a 70% probability of finding work on each day that she reports to the
day labor marketplace. What is the probability that she will work three days out of five?
A) 0.3087.
B) 0.3192.
C) 0.6045.
Explanation
P(3) = 5! / [(5 – 3)! × 3!] × (0.73) × (0.32) = 0.3087 = 5 →2nd→ nCr → 3 × 0.343 ×
0.09
(Module 4.1, LOS 4.e)
Question #6 of 96
Question ID: 1456465
Multivariate distributions can describe:
A) discrete random variables only.
B) continuous random variables only.
C) either discrete or continuous random variables.
Explanation
Multivariate distributions can describe discrete or continuous random variables.
(Module 4.2, LOS 4.g)
Question #7 of 96
Question ID: 1456520
Which of the following statements describes a limitation of Monte Carlo simulation?
A) Outcomes of a simulation can only be as accurate as the inputs to the model.
B)
C)
Simulations do not consider possible input values that lie outside historical
experience.
Variables are assumed to be normally distributed but may actually have nonnormal distributions.
Explanation
Monte Carlo simulations can be set up with inputs that have any distribution and any
desired range of possible values. However, a limitation of the technique is that its output
can only be as accurate as the assumptions an analyst makes about the range and
distribution of the inputs.
(Module 4.3, LOS 4.p)
Question #8 of 96
Question ID: 1456477
A stock portfolio has had a historical average annual return of 12% and a standard deviation
of 20%. The returns are normally distributed. The range –27.2 to 51.2% describes a:
A) 68% confidence interval.
B) 99% confidence interval.
C) 95% confidence interval.
Explanation
The upper limit of the range, 51.2%, is (51.2 – 12) = 39.2 / 20 = 1.96 standard deviations
above the mean of 12. The lower limit of the range is (12 – (-27.2)) = 39.2 / 20 = 1.96
standard deviations below the mean of 12. A 95% confidence level is defined by a range
1.96 standard deviations above and below the mean.
(Module 4.2, LOS 4.h)
Question #9 of 96
Question ID: 1456510
With 60 observations, what is the appropriate number of degrees of freedom to use when
carrying out a statistical test on the mean of a population?
A) 59.
B) 60.
C) 61.
Explanation
When performing a statistical test on the mean of a population based on a sample of size
n, the number of degrees of freedom is n – 1 since once the mean is estimated from a
sample there are only n – 1 observations that are free to vary. In this case the appropriate
number of degrees of freedom to use is 60 – 1 = 59.
(Module 4.3, LOS 4.n)
Question #10 of 96
Question ID: 1456438
A random variable X is continuous and bounded between zero and five, X:(0 ≤ X ≤ 5). The
cumulative distribution function (cdf) for X is F(x) = x / 5. Calculate P(2 ≤ X ≤ 4).
A) 1.00.
B) 0.50.
C) 0.40.
Explanation
For a continuous distribution, P(a ≤ X ≤b) = F(b) – F(a). Here, F(4) = 0.8 and F(2) = 0.4. Note
also that this is a uniform distribution over 0 ≤ x ≤ 5 so Prob(2 < x < 4) = (4 – 2) / 5 = 40%.
(Module 4.1, LOS 4.b)
Question #11 of 96
Question ID: 1456481
A grant writer for a local school district is trying to justify an application for funding an afterschool program for low-income families. Census information for the school district shows an
average household income of $26,200 with a standard deviation of $8,960. Assuming that
the household income is normally distributed, what is the percentage of households in the
school district with incomes of less than $12,000?
A) 15.87%.
B) 5.71%.
C) 9.92%.
Explanation
Z = ($12,000 – $26,200) / $8,960 = –1.58.
From the table of areas under the standard normal curve, 5.71% of observations are more
than 1.58 standard deviations below the mean.
(Module 4.2, LOS 4.i)
Question #12 of 96
Question ID: 1456506
If a stock decreases from $90 to $80, the continuously compounded rate of return for the
period is:
A) -0.1000.
B) -0.1250.
C) -0.1178.
Explanation
This is given by the natural logarithm of the new price divided by the old price; ln(80 / 90) =
-0.1178.
(Module 4.3, LOS 4.m)
Question #13 of 96
Question ID: 1456480
The probability that a normally distributed random variable will be more than two standard
deviations above its mean is:
A) 0.4772.
B) 0.0228.
C) 0.9772.
Explanation
1 – F(2) = 1 – 0.9772 = 0.0228.
(Module 4.2, LOS 4.h)
Question #14 of 96
Q estion ID: 1456498
Question #14 of 96
Question ID: 1456498
If random variable Y follows a lognormal distribution then the natural log of Y must be:
A) lognormally distributed.
B) normally distributed.
C) denoted as ex.
Explanation
For any random variable that is lognormally distributed its natural logarithm (ln) will be
normally distributed.
(Module 4.3, LOS 4.l)
Question #15 of 96
Question ID: 1456458
In a normal distribution, the:
A) median equals the mode.
B) skew is positive.
C) kurtosis is 4.
Explanation
A normal distribution has a zero skew (which implies a symmetrical distribution). When
skew is zero, the mean, median, and mode are all equal.
Kurtosis of a normal distribution is 3.
(Module 4.2, LOS 4.f)
Question #16 of 96
Question ID: 1456451
For a certain class of junk bonds, the probability of default in a given year is 0.2. Whether
one bond defaults is independent of whether another bond defaults. For a portfolio of five
of these junk bonds, what is the probability that zero or one bond of the five defaults in the
year ahead?
A) 0.7373.
B) 0.0819.
C) 0.4096.
Explanation
The outcome follows a binomial distribution where n = 5 and p = 0.2. In this case p(0) =
0.85 = 0.3277 and p(1) = 5 × 0.84 × 0.2 = 0.4096, so P(X=0 or X=1) = 0.3277 + 0.4096.
(Module 4.1, LOS 4.e)
Question #17 of 96
Question ID: 1456497
Expected returns and standard deviations of returns for three portfolios are shown in the
following table:
Portfolio Expected Return Standard Deviation
1
9%
5%
2
8%
4%
3
7%
3%
Assuming the risk-free rate is 3%, an investor who wants to minimize the probability of
returns less than 5% should choose:
A) Portfolio 2.
B) Portfolio 1.
C) Portfolio 3.
Explanation
The probability of returns less than 5% can be minimized by selecting the portfolio with
the greatest safety-first ratio using a threshold return of 5%:
Portfolio 1 = (9 – 5) / 5 = 4/5 = 0.80
Portfolio 2 = (8 – 5) / 4 = 3/4 = 0.75
Portfolio 3 = (7 – 5) / 3 = 2/3 = 0.67
(Module 4.2, LOS 4.k)
Question #18 of 96
Question ID: 1456460
Which of the following statements about a normal distribution is least accurate?
A)
Approximately 34% of the observations fall within plus or minus one standard
deviation of the mean.
B) Kurtosis is equal to 3.
C) The distribution is completely described by its mean and variance.
Explanation
Approximately 68% of the observations fall within one standard deviation of the mean.
Approximately 34% of the observations fall within the mean plus one standard deviation
(or the mean minus one standard deviation).
(Module 4.2, LOS 4.f)
Question #19 of 96
Question ID: 1456489
A food retailer has determined that the mean household income of her customers is
$47,500 with a standard deviation of $12,500. She is trying to justify carrying a line of luxury
food items that would appeal to households with incomes greater than $60,000. Based on
her information and assuming that household incomes are normally distributed, what
percentage of households in her customer base has incomes of $60,000 or more?
A) 15.87%.
B) 2.50%.
C) 5.00%.
Explanation
Z = ($60,000 – $47,500) / $12,500 = 1.0
From the table of areas under the normal curve, 84.13% of observations lie to the left of
+1 standard deviation of the mean. So, 100% – 84.13% = 15.87% with incomes of $60,000
or more.
(Module 4.2, LOS 4.j)
Question #20 of 96
Question ID: 1456508
A stock increased in value last year. Which will be greater, its continuously compounded or
its holding period return?
A) Its continuously compounded return.
B) Its holding period return.
C) Neither, they will be equal.
Explanation
When a stock increases in value, the holding period return is always greater than the
continuously compounded return that would be required to generate that holding period
return. For example, if a stock increases from $1 to $1.10 in a year, the holding period
return is 10%. The continuously compounded rate needed to increase a stock's value by
10% is Ln(1.10) = 9.53%.
(Module 4.3, LOS 4.m)
Question #21 of 96
Question ID: 1456490
An investment has an expected return of 10% with a standard deviation of 5%. If the returns
are normally distributed, the probability of losing money is closest to:
A) 16.0%.
B) 5.0%.
C) 2.5%.
Explanation
Using the standard normal probability distribution,
observation−mean
z =
standard deviation
0−10
=
5
= −2.0
, the chance of getting zero or less return
(losing money) is 1 − 0.9772 = 0.0228% or 2.28%. An alternative explanation: the expected
return is 10%. To lose money means the return must fall below zero. Zero is about two
standard deviations to the left of the mean. 50% of the time, a return will be below the
mean, and 2.5% of the observations are below two standard deviations down. About
97.5% of the time, the return will be above zero. Thus, only about a 2.5% chance exists of
having a value below zero. (Module 4.2, LOS 4.j)
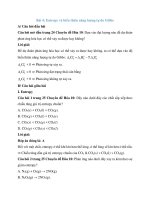
Question #22 of 96
Question ID: 1456486
Standard Normal Distribution
P(Z ≤ z) = N(z) for z ≥ 0
z
0.00
0.01
0.02
0.03
0.04
0.05
0.06
0.07
0.08
0.09
0.5 0.6915 0.6950 0.6985 0.7019 0.7054 0.7088 0.7123 0.7157 0.7190 0.7224
0.6 0.7257 0.7291 0.7324 0.7357 0.7389 0.7422 0.7454 0.7486 0.7517 0.7549
0.7 0.7580 0.7611 0.7642 0.7673 0.7704 0.7734 0.7764 0.7794 0.7823 0.7852
0.8 0.7881 0.7910 0.7939 0.7967 0.7995 0.8023 0.8051 0.8078 0.8106 0.8133
0.9 0.8159 0.8186 0.8212 0.8238 0.8264 0.8289 0.8315 0.8340 0.8365 0.8389
1.0 0.8413 0.8438 0.8461 0.8485 0.8508 0.8531 0.8554 0.8577 0.8599 0.8621
1.1 0.8643 0.8665 0.8686 0.8708 0.8729 0.8749 0.8770 0.8790 0.8810 0.8830
1.2 0.8849 0.8869 0.8888 0.8907 0.8925 0.8944 0.8962 0.8980 0.8997 0.9015
1.3 0.9032 0.9049 0.9066 0.9082 0.9099 0.9115 0.9131 0.9147 0.9162 0.9177
1.4 0.9192 0.9207 0.9222 0.9236 0.9251 0.9265 0.9279 0.9292 0.9306 0.9319
Given a normally distributed population with a mean income of $40,000 and standard
deviation of $7,500, what percentage of the population makes between $30,000 and
$35,000?
A) 15.96.
B) 13.34.
C) 41.67.
Explanation
The z-score for $30,000 = ($30,000 – $40,000) / $7,500 or –1.33. From the z-table given,
1.33 standard deviations above the mean is associated with a probability of 0.9082. The
probability of an outcome more than 1.33 standard deviations below the mean is 1 –
0.9082, which equals 0.0918.
The z-score for $35,000 = ($35,000 – $40,000) / $7,500 or –0.67. The probability of an
outcome more than 0.67 standard deviations below the mean is 1 – 0.7486, which equals
0.2514.
The probability of an outcome between 0.67 and 1.33 standard deviations below the mean
is 0.2514 – 0.0918 = 0.1596, or 15.96%.
(Module 4.2, LOS 4.j)
Question #23 of 96
Question ID: 1456434
A random variable that has a countable number of possible values is best described as a:
A) discrete random variable.
B) probability distribution.
C) continuous random variable.
Explanation
A discrete variable is one that has a finite number of possible outcomes and can be
counted, like the number of rainy days in a week.
A continuous variable, on the other hand, is one that has an infinite number of
possibilities and must be measured, for example, quantity of rain in a week.
(Module 4.1, LOS 4.a)
Question #24 of 96
Question ID: 1456452
Which of the following is NOT an assumption of the binomial distribution?
A) Random variable X is discrete.
B) The expected value is a whole number.
C) The trials are independent.
Explanation
The expected value is n × p. A simple example shows us that the expected value does not
have to be a whole number: n = 5, p = 0.5, n × p = 2.5. The other conditions are necessary
for the binomial distribution.
(Module 4.1, LOS 4.e)
Question #25 of 96
In a multivariate normal distribution, a correlation tells the:
A) overall relationship between all the variables.
B) relationship between the means and variances of the variables.
Question ID: 1456467
C) strength of the linear relationship between two of the variables.
Explanation
This is true by definition. The correlation only applies to two variables at a time.
(Module 4.2, LOS 4.g)
Question #26 of 96
Question ID: 1456435
Which of the following is least likely to be an example of a discrete random variable?
A) The number of days of sunshine in the month of May 2006 in a particular city.
B) The rate of return on a real estate investment.
C) Quoted stock prices on the NASDAQ.
Explanation
The rate of return on a real estate investment, or any other investment, is an example of a
continuous random variable because the possible outcomes of rates of return are infinite
(e.g., 10.0%, 10.01%, 10.001%, etc.). Both of the other choices are measurable (countable).
(Module 4.1, LOS 4.a)
Question #27 of 96
Question ID: 1456468
A multivariate distribution is best defined as describing the behavior of:
A) a random variable with more than two possible outcomes.
B) two or more independent random variables.
C) two or more dependent random variables.
Explanation
A multivariate distribution describes the relationships between two or more random
variables, when the behavior of each random variable is dependent on the others in some
way.
(Module 4.2, LOS 4.g)
Question #28 of 96
Question ID: 1456512
Which one of the following statements about the t-distribution is most accurate?
A) The t-distribution is positively skewed.
B) The t-distribution has thinner tails compared to the normal distribution.
C)
The t-distribution approaches the standard normal distribution as the degrees
of freedom increase.
Explanation
As the number of degrees of freedom grows, the t-distribution approaches the shape of
the standard normal distribution.
Compared to the normal distribution, the t-distribution has fatter tails.
The t-distribution is symmetric about the mean and so it has skewness of zero.
(Module 4.3, LOS 4.n)
Question #29 of 96
Question ID: 1456431
Which of the following statements about probability distributions is least accurate?
A) The skewness of a normal distribution is zero.
B)
C)
A binomial probability distribution is an example of a continuous probability
distribution.
A discrete random variable is a variable that can assume only certain clearly
separated values resulting from a count of some set of items.
Explanation
The binomial probability distribution is an example of a discrete probability distribution.
There are only two possible outcomes of each trial and the outcomes are mutually
exclusive. For example, in a coin toss the outcome is either heads or tails.
The other responses are both correct definitions.
(Module 4.1, LOS 4.a)
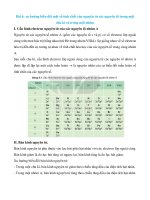
Question #30 of 96
Question ID: 1456483
Cumulative Z-Table
z
0.04
0.05
1.8 0.9671 0.9678
1.9 0.9738 0.9744
2.0 0.9793 0.9798
2.1 0.9838 0.9842
The owner of a bowling alley determined that the average weight for a bowling ball is 12
pounds with a standard deviation of 1.5 pounds. A ball denoted "heavy" should be one of
the top 2% based on weight. Assuming the weights of bowling balls are normally distributed,
at what weight (in pounds) should the "heavy" designation be used?
A) 14.00 pounds.
B) 14.22 pounds.
C) 15.08 pounds.
Explanation
The first step is to determine the z-score that corresponds to the top 2%. Since we are only
concerned with the top 2%, we only consider the right hand of the normal distribution.
Looking on the cumulative table for 0.9800 (or close to it) we find a z-score of 2.05. To
answer the question, we need to use the normal distribution given: 98 percentile = sample
mean + (z-score)(standard deviation) = 12 + 2.05(1.5) = 15.08.
(Module 4.2, LOS 4.i)
Question #31 of 96
Question ID: 1456514
Segment of the table of critical values for Student's t-distribution:
Level of Significance for a One-Tailed Test
df
0.050
0.025
Level of Significance for a Two-Tailed Test
df
0.10
0.05
28
1.701
2.048
29
1.699
2.045
30
1.697
2.042
40
1.684
2.021
For a t-distributed test statistic with 30 degrees of freedom, a one-tailed test specifying the
parameter greater than some value and a 95% confidence level, the critical value is:
A) 1.684.
B) 1.697.
C) 2.042.
Explanation
This is the critical value for a one-tailed probability of 5% and 30 degrees of freedom.
(Module 4.3, LOS 4.n)
Question #32 of 96
Question ID: 1456454
Assume 30% of the CFA candidates have a degree in economics. A random sample of three
CFA candidates is selected. What is the probability that none of them has a degree in
economics?
A) 0.027.
B) 0.343.
C) 0.900.
Explanation
The probability of 0 successes in 3 trials is: [3! / (0!3!)] (0.3)0 (0.7)3 = 0.343
(Module 4.1, LOS 4.e)
Question #33 of 96
Question ID: 1456447
Consider a random variable X that follows a continuous uniform distribution: 7 ≤ X ≤ 20.
Which of the following statements is least accurate?
A) F(12 ≤ X ≤ 16) = 0.307.
B) F(21) = 0.00.
C) F(10) = 0.23.
Explanation
F(21) = 1.00. For a cumulative distribution function, the expression F(x) refers to the
probability of an outcome less than or equal to x. In this distribution all the possible
outcomes are between 7 and 20. Therefore the probability of an outcome less than or
equal to 21 is 100%.
The other choices are true.
F(10) = (10 – 7) / (20 – 7) = 3 / 13 = 0.23
F(12 ≤ X ≤ 16) = F(16) – F(12) = [(16 – 7) / (20 – 7)] – [(12 – 7) / (20 – 7)] = 0.692 – 0.385
= 0.307
(Module 4.1, LOS 4.d)
Question #34 of 96
Question ID: 1456476
A stock portfolio's returns are normally distributed. It has had a mean annual return of 25%
with a standard deviation of 40%. The probability of a return between -41% and 91% is
closest to:
A) 65%.
B) 90%.
C) 95%.
Explanation
A 90% confidence level includes the range between plus and minus 1.65 standard
deviations from the mean.
(91 – 25) / 40 = 1.65 and (-41 – 25) / 40 = -1.65.
(Module 4.2, LOS 4.h)
Question #35 of 96
Question ID: 1456475
The mean return of a portfolio is 20% and its standard deviation is 4%. The returns are
normally distributed. Which of the following statements about this distribution are least
accurate? The probability of receiving a return:
A) of less than 12% is 0.025.
B) in excess of 16% is 0.16.
C) between 12% and 28% is 0.95.
Explanation
The probability of receiving a return greater than 16% is calculated by adding the
probability of a return between 16% and 20% (given a mean of 20% and a standard
deviation of 4%, this interval is the left tail of one standard deviation from the mean, which
includes 34% of the observations.) to the area from 20% and higher (which starts at the
mean and increases to infinity and includes 50% of the observations.) The probability of a
return greater than 16% is 34 + 50 = 84%.
Note: 0.16 is the probability of receiving a return less than 16%.
(Module 4.2, LOS 4.h)
Question #36 of 96
Which of the following qualifies as a cumulative distribution function?
A) F(1) = 0, F(2) = 0.25, F(3) = 0.50, F(4) = 1.
B) F(1) = 0, F(2) = 0.5, F(3) = 0.5, F(4) = 0.
C) F(1) = 0.5, F(2) = 0.25, F(3) = 0.25, F(4) – 1.
Explanation
Question ID: 1456439
Because a cumulative probability function defines the probability that a random variable
takes a value equal to or less than a given number, for successively larger numbers, the
cumulative probability values must stay the same or increase.
(Module 4.1, LOS 4.b)
Question #37 of 96
Question ID: 1456441
For a random variable defined over the interval 0 to 1 that has a cumulative distribution
function of F(x) = x3, the probability of an outcome between 20% and 70% is closest to:
A) 1/4.
B) 1/3.
C) 1/2.
Explanation
The probability of x < 0.7 is 0.73 = 0.343, and the probability of x < 0.2 = 0.23 = 0.008, so
the probability of 0.2 < x < 0.7 = 0.343 – 0.008 = 33.5%, which is closest to 1/3.
(Module 4.1, LOS 4.b)
Question #38 of 96
Question ID: 1456523
One of the major limitations of Monte Carlo simulation is that it:
A) cannot provide the insight that analytic methods can.
B) does not lend itself to performing “what if” scenarios.
C) requires that variables be modeled using the normal distribution.
Explanation
The major limitations of Monte Carlo simulation are that it is fairly complex and will
provide answers that are no better than the assumptions used and that it cannot provide
the insights that analytic methods can. Monte Carlo simulation is useful for performing
"what if" scenarios. One of the first steps in Monte Carlo simulation is to specify the
probably distribution along with the distribution parameters. The distribution specified
does not have to be normal. (Module 4.3, LOS 4.p)
Question #39 of 96
Question ID: 1456491
The mean and standard deviation of returns for three portfolios are listed below in
percentage terms.
Portfolio X: Mean 5%, standard deviation 3%.
Portfolio Y: Mean 14%, standard deviation 20%.
Portfolio Z: Mean 19%, standard deviation 28%.
Using Roy's safety-first criteria and a threshold of 4%, select the optimal portfolio.
A) Portfolio X.
B) Portfolio Y.
C) Portfolio Z.
Explanation
Portfolio Z has the largest value for the SFRatio: (19 – 4) / 28 = 0.5357.
For Portfolio X, the SFRatio is (5 – 4) / 3 = 0.3333.
For Portfolio Y, the SFRatio is (14 – 4) / 20 = 0.5000.
(Module 4.2, LOS 4.k)
Question #40 of 96
Question ID: 1456448
The probability density function of a continuous uniform distribution is best described by a:
A) line segment with a 45-degree slope.
B) horizontal line segment.
C) line segment with a curvilinear slope.
Explanation
By definition, for a continuous uniform distribution, the probability density function is a
horizontal line segment over a range of values such that the area under the segment (total
probability of an outcome in the range) equals one.
(Module 4.1, LOS 4.d)
Question #41 of 96
Question ID: 1456437
Question #41 of 96
Question ID: 1456437
The cumulative distribution function for a random variable X is given in the following table:
x
F(x)
5
0.15
10 0.30
15 0.45
20 0.75
25 1.00
The probability of an outcome greater than 15 is:
A) 75%.
B) 45%.
C) 55%.
Explanation
A cumulative distribution function (cdf) gives the probability of an outcome for a random
variable less than or equal to a specific value. For the random variable X, the cdf for the
outcome 15 is 0.45, which means there is a 45% probability that X will take a value less
than or equal to 15. Therefore, the probability of a value greater than 15 equals 100% –
45% = 55%.
(Module 4.1, LOS 4.b)
Question #42 of 96
Question ID: 1456504
The continuously compounded rate of return that will generate a one-year holding period
return of -6.5% is closest to:
A) -5.7%.
B) -6.3%.
C) -6.7%.
Explanation
Continuously compounded rate of return = ln(1 – 0.065) = -6.72%.
(Module 4.3, LOS 4.m)
Question #43 of 96
Question ID: 1456443
Which of the following random variables would be most likely to follow a discrete uniform
distribution?
A) The number of heads on the flip of two coins.
B)
C)
The outcome of a roll of a standard, six-sided die where X equals the number
facing up on the die.
The outcome of the roll of two standard, six-sided dice where X is the sum of the
numbers facing up.
Explanation
The discrete uniform distribution is characterized by an equal probability for each
outcome. A single die roll is an often-used example of a uniform distribution. In combining
two random variables, such as coin flip or die roll outcomes, the sum will not be uniformly
distributed.
(Module 4.1, LOS 4.c)
Question #44 of 96
Question ID: 1456433
Which of the following statements about the normal probability distribution is most
accurate?
A)
Sixty-eight percent of the area under the normal curve falls between the mean
and 1 standard deviation above the mean.
B) The normal curve is asymmetrical about its mean.
C)
Five percent of the normal curve probability is more than two standard
deviations from the mean.
Explanation
The normal curve is symmetrical about its mean with 34% of the area under the normal
curve falling between the mean and one standard deviation above the mean. Ninety-five
percent of the normal curve is within two standard deviations of the mean, so five percent
of the normal curve falls outside two standard deviations from the mean.
(Module 4.1, LOS 4.a)
Question #45 of 96
Question ID: 1456470
A multivariate distribution:
A) applies only to binomial distributions.
B) gives multiple probabilities for the same outcome.
C) specifies the probabilities associated with groups of random variables.
Explanation
A multivariate distribution specifies the probabilities for a group of related random
variables.
(Module 4.2, LOS 4.g)
Question #46 of 96
Question ID: 1456502
A stock that pays no dividend is currently priced at €42.00. One year ago the stock was
€44.23. The continuously compounded rate of return is closest to:
A) –5.04%.
B) +5.17%.
C) –5.17%.
Explanation
S1
ln (
S0
42.00
) = ln (
44.23
) = ln (0.9496) = − 0.0517 = − 5.17%
(Module 4.3, LOS 4.m)
Question #47 of 96
Question ID: 1456484
The average amount of snow that falls during January in Frostbite Falls is normally
distributed with a mean of 35 inches and a standard deviation of 5 inches. The probability
that the snowfall amount in January of next year will be between 40 inches and 26.75 inches
is closest to:
A) 68%.
B) 79%.
C) 87%.
Explanation
To calculate this answer, we will use the properties of the standard normal distribution.
First, we will calculate the Z-value for the upper and lower points and then we will
determine the approximate probability covering that range. Note: This question is an
example of why it is important to memorize the general properties of the normal
distribution.
Z = (observation – population mean) / standard deviation
Z26.75 = (26.75 – 35) / 5 = -1.65. (1.65 standard deviations to the left of the mean)
Z40 = (40 – 35) / 5 = 1.0 (1 standard deviation to the right of the mean)
Using the general approximations of the normal distribution:
68% of the observations fall within ± one standard deviation of the mean. So, 34% of
the area falls between 0 and +1 standard deviation from the mean.
90% of the observations fall within ± 1.65 standard deviations of the mean. So, 45%
of the area falls between 0 and +1.65 standard deviations from the mean.
Here, we have 34% to the right of the mean and 45% to the left of the mean, for a total of
79%.
(Module 4.2, LOS 4.j)
Question #48 of 96
Question ID: 1456501
A lognormal distribution is least likely to be:
A) negatively skewed.
B) used to model stock prices.
C) bounded below by zero.
Explanation
A lognormal distribution is positively skewed and is bounded below by zero.
If stock returns are continuously compounded, then prices follow a lognormal distribution
under certain conditions.
(Module 4.3, LOS 4.l)
Question #49 of 96
Question ID: 1456505
Given a holding period return of R, the continuously compounded rate of return is:
A) eR – 1.
B) ln(1 + R).
C) ln(1 + R) – 1.
Explanation
This is the formula for the continuously compounded rate of return.
(Module 4.3, LOS 4.m)
Question #50 of 96
Question ID: 1456457
A normal distribution can be completely described by its:
A) mean and mode.
B) mean and variance.
C) skewness and kurtosis.
Explanation
The normal distribution can be completely described by its mean and variance.
(Module 4.2, LOS 4.f)
Question #51 of 96
Question ID: 1456466
A multivariate normal distribution that includes three random variables can be completely
described by the means and variances of each of the random variables and the:
A) correlation coefficient of the three random variables.
B) correlations between each pair of random variables.
C) conditional probabilities among the three random variables.
Explanation