Pro SQL Server 2012 Reporting Services, 3rd Edition pptx
Bạn đang xem bản rút gọn của tài liệu. Xem và tải ngay bản đầy đủ của tài liệu tại đây (28.43 MB, 506 trang )
McDonald
McGehee
Landrum
Shelve in
Databases/ MS SQL Server
User level:
Intermediate–Advanced
www.apress.com
SOURCE CODE ONLINE
RELATED
BOOKS FOR PROFESSIONALS BY PROFESSIONALS
®
Pro SQL Server 2012 Reporting
Services
Deliver customizable, web-enabled reports at reasonable cost with Pro SQL Server
2012 Reporting Services.
Covering the very latest in new features for SQL Server 2012, this book is your
guide to bringing business intelligence to your organization. Reporting Services
experts Brian McDonald, Shawn McGehee, and Rodney Landrum help you get the
most out of this enterprise-level reporting platform.
With Pro SQL Server 2012 Reporting Services, you’ll learn how to:
• Create interactive reports for business users
• Pull data from relational databases, from XML, and from other sources
• Write efficient queries on which to base a report
• Build and lay out a report using Report Designer
• Enable end users to create ad hoc reports on demand
• Combine Reporting Services with Analysis Services, SharePoint Server,
and other technologies to deliver business intelligence across the enterprise
• Secure and audit your reports as part of your regulatory compliance efforts
• Customize your reports using C# assemblies and embedded Visual Basic .NET code
After reading Pro SQL Server 2012 Reporting Services, you’ll fully understand how
to use the breadth of tools offered by this platform to create and deploy reports.
You’ll also know how to take advantage of all its advanced features, enabling
Reporting Services to help you and your enterprise find success.
www.it-ebooks.info
For your convenience Apress has placed some of the front
matter material after the index. Please use the Bookmarks
and Contents at a Glance links to access them.
www.it-ebooks.info
iv
Contents at a Glance
About the Authors xv
About the Technical Reviewers xvi
Acknowledgments xvii
Introduction xix
Chapter 1: Introducing the Reporting Services Architecture 1
Chapter 2: Report Authoring: Designing Efficient Queries 19
Chapter 3: Introduction to Reporting Services Design with SQL Server Data Tools 39
Chapter 4: Laying Out a Report 61
Chapter 5: Implementing Dashboard-Style Report Objects 89
Chapter 6: Building Reports 125
Chapter 7:
Using Custom .NET Code with Reports
185
Chapter 8: Deploying Reports 213
Chapter 9: Rendering Reports from .NET Applications 243
Chapter 10: Managing Reports 279
Chapter 11: Securing Reports 329
Chapter 12: Delivering Business Intelligence with SSRS 361
Chapter 13:
Creating Reports Using Report Builder 1.0, 2.0, and 3.0
401
Index 483
www.it-ebooks.info
xix
Introduction
At its core, the process of designing reports hasn’t changed substantially in the past 20 years. The report
designer lays out report objects, which contain data from a known source of data, in a design application
such as Reporting Services, Business Objects Reports, or Microsoft Access. He or she then tests report
execution, verifies the accuracy of the results, and distributes the report to the target audience.
Sure, there are enough differences between design applications to mean that the designer must
become familiar with each particular environment. However, there’s enough crossover functionality to
make this learning curve small. For example, the SUM function is the same in Business Objects Reports as it
is in Microsoft Access as it is in Structured Query Language (SQL).
With Microsoft SQL Server 2012 Reporting Services (referred to as SSRS throughout the book),
there is, again, only a marginal difference in the way reports are designed from one graphical report
design application to another. So, if you do have previous reporting experience, your learning curve for
SSRS should be relatively shallow. This is especially true if you come from a .NET environment, because the
report designer application for SSRS 2012 is Visual Studio 2010 or the application included with SQL Server 2012,
SQL Server Data Tools (SSDT), formerly known as Business Intelligence Development Studio (BIDS). We use
BIDS and SSDT interchangeably throughout the book, with most references using BIDS. We have done this
mainly because of the role that Reporting Services plays in the Business Intelligence stack of products with SQL
Server, but also for readers who may be using prior versions of Reporting Services like SSRS 2008 R2.
Having said all this, several differences set SSRS apart from other reporting solutions:
• It provides a standard reporting platform based on Report Definition Language (RDL), which is
the XML schema that dictates the common structure of all SSRS reports. This allows for report
creation from any third-party application that supports the RDL schema.
• SSRS is an integral part of the SQL Server 2012 release.
• SSRS offers features out of the box that in other products would be expensive additions to a
basic deployment. These features include subscription services, report caching, report history,
and scheduling of report execution.
• SSRS can be extended with third party add-ons, custom code, and compiled DLL’s.
• SSRS, being a Web-based solution, can be deployed across a variety of platforms.
• SSRS also allows for easy integration with Microsoft’s Collaboration Software for the Enterprise:
SharePoint 2010.
This book was written in parallel with a real SSRS deployment for a health-care application, so it
covers almost every design and deployment consideration for SSRS, always from the standpoint of how
to get the job done effectively. You’ll find step-by-step guides, practical tips, and best practices, along with
code samples that you’ll be able to modify and use in your own SSRS applications.
www.it-ebooks.info
INTRODUCTION
xx
Who This Book Is For
We coauthored the book with the intention of demonstrating how to use SSRS from multiple vantage
points. As reporting architects and report developers, we go through the report design and deployment
processes using standard SSRS tools such as Report Designer in BIDS and Report Manager. We also
show how developers can extend SSRS by creating custom Windows and Web Forms applications.
Prerequisites
The core software that has been used in the examples throughout this book are:
• Microsoft SQL Server 2012
• Microsoft Visual Studio 2010 – used in chapters 7, 8, 9, and 10
• Microsoft SharePoint 2010 – used in chapter 12 with SSRS integration
• Microsoft SQL Server 2008 R2 – used in chapter 13 for ad hoc reporting using Report Models
Each of the aforementioned software is required if you, the reader, have the desire to follow
along with the examples throughout the book. Most of the examples were built using SQL Server 2012,
but with the exception of chapters 7, 8 and 9, they can be performed on SQL Server 2008 R2.
Downloading the Code
In this book, we use a subset of real databases designed for a health-care application that some of us
developed over the years. You can find all of the supporting materials (databases, the data mart
database, and cube file used in Chapter 12, the completed RDL files, queries, stored procedures, and
.NET application projects, as well as full installation instructions) in the Source Code/Download section
of the Apress Web site (www.apress.com). With so many other books with similar titles having existed over
the years, it may be easier to find this book by using its ISBN number. The 13-digit industry standard
ISBN number for this book is 978-1-4302-3810-2.
Contacting the Authors
Should you have any questions regarding any section in the book, please feel free to contact us via our
email or twitter accounts. We would love to hear that you have purchased our book, so please feel free to
tweet us. We sincerely hope that you get the enjoyment out of reading the book that we had in writing it
for you.
Brian K. McDonald
@briankmcdonald
Shawn McGehee
@SQLShawn
www.it-ebooks.info
INTRODUCTION
xxi
Rodney Landrum
@SQLBeat
www.it-ebooks.info
C H A P T E R 1
1
Introducing the
Reporting Services Architecture
Microsoft’s 2003 announcement that it was going to release SQL Server Reporting Services (SSRS) as a
SQL Server 2000 add-on stirred up a frenzy of excitement. The product was originally slated for release
with SQL Server 2005, so the early release was a welcome event for many. Our software development
company decided to embrace SSRS early on and was fortunate to work with Microsoft during the beta
phases. In January 2004, the month Microsoft’s released SSRS to manufacturing (RTM), we deployed it
immediately. We intended to migrate all of our existing reports (which we had developed on as many as
five reporting applications and platforms over the previous ten years) to SSRS. We can sum up the
reason for the seemingly rapid decision in one word: standardization.
Just as Microsoft wanted to create an industry standard with Report Definition Language (RDL), the
Extensible Markup Language (XML) schema that dictates the common structure of all SSRS reports, we
wanted to provide a standard reporting solution to our customers. Even in the first version of the
product, SSRS delivered almost all the features we needed. Thanks to its extensibility via SSRS’s Web
service, we could programmatically add other features that weren’t already directly supported. In
addition, Microsoft was committed to enhancing SSRS for years to come. Some of the features released
in the 2005 edition were client-side printing, interactive sorting capabilities, and an ability to define
multivalued parameters. There was also a move forward in the self-service business intelligence (BI)
arena with Microsoft’s first ad hoc Report Builder ClickOnce application.
Microsoft’s next release was SSRS 2008. The new release brought on many long-awaited
enhancements to include modifications of its architecture, completely revamped report designer, and
2008 R2 brought us significant design updates to the built-in Report Manager application. With the vast
updates implemented in the 2008 release, SSRS has taken its place as a key SQL Server component in
Microsoft’s business intelligence suite of products alongside SQL Server Integration Services (SSIS) and
SQL Server Analysis Services (SSAS). Nobody could now think of Reporting Services as just an add-on.
The new features in SSRS 2008 and SSRS 2008 R2 pushed the technology one step further into
becoming the reporting development environment of choice for programmers and designers, especially
those already skilled with Visual Studio (VS) and Visual Basic .NET (VB.NET). As they were for its
predecessors, SSRS 2005, SSRS 2008, and SSRS 2008 R2, the long-awaited features for SSRS 2012 are
mostly driven by direct feedback from the user community. Throughout the book, we will demonstrate
each of the new features released in 2008, 2008 R2, and 2012 as we show how to design professional
reports, applications, and solutions built on Microsoft’s BI initiatives. We will focus on SSRS as a whole,
building on features from each version from 2000 to 2012; however, we will point out which features are
new to SSRS 2008 R2 and SSRS 2012.
www.it-ebooks.info
CHAPTER 1 INTRODUCING THE REPORTING SERVICES ARCHITECTURE
2
Understanding the Benefits of SSRS
Our company based its decision to migrate immediately to SSRS on the following perceived benefits for
the company and for our customers:
Standard platform: As well as providing a standard realized with the RDL, our
development teams had been using VS .NET as their main development
environment. Because SSRS reports were currently developed within this
platform, we wouldn’t need to purchase additional development software. Our
clients would need to purchase only a low-cost edition of a designer—VB.NET,
for example—to gain the benefit of developing their own custom reports. In
SQL Server 2005, Microsoft included the Business Intelligence Development
Studio (BIDS) as a free, alternative report designer. This free development
environment has been available with SQL Server ever since, but Microsoft has
recently renamed it as SQL Server Data Tools (SSDT). Throughout this book, we
will use BIDS and SSDT interchangeably. The BIDS environment runs in the
shell of Visual Studio (devenv.exe) and, at the time of writing, is based on Visual
Studio—VS 2008 for 2008 and 2008 R2, and VS 2010 for the latest release, SQL
Server 2012. Anybody who learns to design reports with BIDS will have the
advantage of a consistent interface when they move to the full version of Visual
Studio, and will need no additional training.
Cost: SSRS is an integral part of SQL Server 2012 and is available in many
editions, from Express Advanced to Enterprise in 2008 and even Datacenter
edition in 2008 R2. However, because SQL Server 2012 has done away with
Datacenter edition, the most feature-rich edition will once again be Enterprise.
When you purchase SQL Server, you get SSRS as well. See a complete list of SQL
Server 2012 features at
Web-enabled: Because SSRS is a Web-based reporting solution; a single
deployed report is accessible to a variety of clients, from the browser to custom
Windows Forms. In addition, because reports are primarily accessed via
Hypertext Transfer Protocol (HTTP) or HTTP Secure (HTTPS), you can view
reports from any location that has access to the SSRS Web server. Unless you
have a thick client application that requires local reports to be deployed with
the application, you can have one central repository for reports to be consumed
across the organization.
Customizable: SSRS provides a .NET Web service as a front end,
programmatically accessible to extend the delivery of reports beyond the
browser. As .NET programmers, we knew we would want to build custom
applications to render reports where we could control the look and feel of the
report viewer. We show one such application in Chapter 7, which covers report
rendering.
Subscriptions: SSRS subscription abilities gave a huge advantage for our
company and our clients, as report delivery by e-mail or file-sharing, as well as
off-peak processing, were now possible. We show how to set up two different
kinds of subscriptions, standard and data-driven, in Chapter 8.
As you’ll see, SSRS is a full reporting solution that encompasses many levels of professional
expertise, from report design to database administration. In many organizations, especially small- to
medium-sized ones, information technology (IT) professionals are asked to perform many jobs. They
www.it-ebooks.info
CHAPTER 1 INTRODUCING THE REPORTING SERVICES ARCHITECTURE
3
write a query and design a report in the morning, perform database backups or restores in the afternoon,
and update all the systems before heading home in the late hours of the evening. Sometimes even until
the early hours of the next day! But we are sure that we’re not the only ones that take such pride in our
jobs and always striving to exceed the needs of the business.
Throughout each of our careers, we have all worn many hats in the companies which we have
poured our time and devotion to over the years. We have been entrenched in every deployment phase
from internal deployments to externally facing web application deployments to our clients, from simple
implementations to advanced ones which extended Reporting Services capabilities. By developing
efficient stored procedures, thoroughly testable security mechanisms, as well as building and
maintaining well designed reports, we have witnessed the day-to-day operation of SSRS from many
perspectives.
We have also been responsible for our company’s overall strategy for building solutions to analyze
and transform data gathered through both our own and third-party applications. To that end, an
essential part of our jobs over the years has been to integrate SSRS into the overall BI strategy that
incorporated the following:
• Disparate data sources such as Analysis Services Cubes and SQL Server relational
databases
• Applications and tools such as Microsoft Excel and Business Scorecards
• Document management systems such as Microsoft SharePoint Portal Server
We’ll dive into the details of such integration projects in Chapter 12, which is devoted to BI. We will
also explore one of the key advancements of SSRS 2008 R2 and 2012, which is a tighter integration with
SharePoint portal server, to the point that SSRS content can now be directly deployed, managed, and
viewed all within SharePoint. We’ll also show you how sections of reports can be created and served as
web parts.
SSRS represents another world, not often seen by an administrator using standard management
tools. This world is the domain of the software developer who can extend and control SSRS
programmatically, building custom report viewers and deployment applications. In this book, as you
work through each step of building a reporting solution for healthcare professionals, you’ll see how an
administrator can accomplish the task with built-in tools, as well as how a developer can create an
application to provide enhanced functionality.
SQL Server 2008 R2 and 2012 Reporting Services Enhancements
There have been many major additions to Reporting Services since its initial release in 2005, but let’s
look at some of the most significant enhancements made to the SSRS technology in SQL Server.
Report Builder/Data Modeler
The Report Builder application, a feature introduced in SSRS 2005, is a local ad hoc report-designing
application intended for use more by report consumers than by report developers. An administrator
familiar with the source data creates the business logic and underlying data structures as a data model.
With the Report Builder application, the user can create and publish reports based on available models.
Microsoft designed Report Builder 2.0, released in SSRS 2008, for Microsoft Ribbon technology, much
like Microsoft Word and Microsoft Excel, and it was a significant improvement on Report Builder 1.0.
Each enhancement provided a richer development environment and additional content sources, such as
Oracle and Analysis Services Cubes. As if that wasn’t enough, Report Builder 3.0 made its first
appearance with SSRS 2008 R2, with its new data visualization report items and cached result sets.
www.it-ebooks.info
CHAPTER 1 INTRODUCING THE REPORTING SERVICES ARCHITECTURE
4
Chapter 13 tells you how to build and deploy a data model, as well as how to create reports with the
Report Builder 1.0, Report Builder 2.0, and Report Builder 3.0 applications.
SSRS 2012 Integration with Microsoft Office SharePoint
While SharePoint integration was available with the use of SharePoint controls in previous versions of
SSRS, SSRS 2012 takes the integration several steps further. By using SSRS 2012 in SharePoint Integration
Mode, users can deploy, manage, and deliver reports and report objects, like web parts, data sources,
and models, even entire dashboards or portals, all within the SharePoint environment. In addition, the
deployed reports inherit the native features of SharePoint, such as workflow capabilities and the ability
to check in and check out reports, and report change notification. We will demonstrate this tighter
integration with SharePoint in Chapter 12.
Tablix Report Properties
As the name suggests, the Tablix properties first seen in SSRS 2008 combine two existing report controls,
Table and Matrix. This combination gives developers a more flexible tool when creating reports. The
availability of multiple columns and rows blends the static nature of the Table control with the dynamic
nature of the Matrix. Reports can now accommodate multiple parallel rows and column members at
each level, independent of each other but using the same aggregate calculations. In previous editions of
this book, we provided workarounds to combining tables and matrices by embedding one within the
other. In Chapter 4, we will explore the true power of the new Tablix control properties for the List,
Table, and Matrix controls.
Enhanced Charting and Report Item Visualizations
From the beginning, SSRS offered charts and visualizations natively in reports. These charts, while
versatile, were somewhat limited in scope. Much, if not all, of the functionality in the charting aspects of
previous versions of SSRS could be easily duplicated in Microsoft Excel. In fact, the charting was almost
identical. SSRS 2008 provided several charting and graphical data-visualization enhancements vital for
the sound BI reporting solution of which SSRS is a pivotal component. New charting elements such as
range, polar, radar, funnel, and pyramid are available, as well as many new “gauges” delivered with the
acquisition of Dundas reporting controls for SSRS.
SSRS 2008 R2 included several eagerly-awaited report item visualizations to enable the creation of a
more sophisticated dashboard look and feel. One is the Map control that can display data from a
geospatial data result set or an Environmental Systems Research Institute, Inc. (ESRI) shape file. Other
great additions include Data Bars, Sparklines, and Indicators. We will explore several of these new
visualizations as we incorporate them into reports in Chapter 5.
Enhanced Performance and Memory Management
Microsoft reengineered the report engine in SSRS 2008 to lessen the memory footprint for reports at the
server level, speeding delivery of reports to end-user applications. This enhancement also resolves the
contention that arose when long-running, large reports and smaller, non-memory-bound reports
processed simultaneously.
www.it-ebooks.info
CHAPTER 1 INTRODUCING THE REPORTING SERVICES ARCHITECTURE
5
Embeddable SSRS Controls
The ability to embed controls in custom applications makes it easier for developers to integrate SSRS
into their projects. Since the release of SQL Server 2005, the Visual Studio environment has included
distributable controls that you can use for Windows Forms development and ASP.NET Web Forms
development. These controls provide additional benefits to developers, such as the ability to render
reports while disconnected from the SSRS. We will cover updated SSRS controls in Chapter 9.
HTML Text Formatting
Aside from the change from dual to single service architecture and the ability to export to Microsoft
Word format, text formatting is probably one of the most significant advancements of SSRS 2008. In
previous versions of SSRS, in-line formatting of textual content, for example for a form letter, was not
possible. For example, if you wanted to have a single textbox contain some text in regular font, but
wanted to bold or italicize other sections of the text, you wouldn’t be able to do it. Textbox report items
in SSRS 2008, SSRS 2008 R2, and SSRS 2012 allow for normal and rich-text modes and allow formatting in
the same way as a word processor does. You can create a placeholder to allow a limited subset of some
HTML and style tags. The text formatting can combine both literal text and data source text for mail
merge and template reports. We will demonstrate the full use of this feature by creating a custom form
letter style report in Chapter 6.
Microsoft Word Rendering
Since the first version of SSRS, you could export any report to Microsoft Excel. While this was an
important capability, not being able to export to other Microsoft Office formats, such as Word, was a
limitation. Developers often want to create reports using the rich text formats found in today’s modern
word processors. By combining SSRS’s ability to design custom reports from multiple data sources with
Word’s ability to provide rich formatting, SSRS 2008 overcomes significant limitations of its
predecessors. Another limitation was that report users could not export into 2007 formats. Excel 2003
has a limitation of 65,536 rows and 256 columns, but one of SSRS 2012’s new rendering enhancements
enables us to export to Word and Excel 2007-2010 formats, so we can now store 1,048,576 records and
16,384 columns on one sheet of an Excel workbook.
Report Parts
If you’re like us, you have probably wanted to create little reusable objects that could be incorporated in
more than one report. Until SSRS 2008 R2, you could do this only by creating reports that could be
embedded into other reports as subreports. Now, you can publish individual sections of reports, like a
Tablix containing the top 10 employees by sales totals or a Sparkline showing the customer complaints
trend for the current year. Any report item like these can be deployed to a ReportServer or SharePoint
server and reused by end users using ad hoc tools like Report Builder or SharePoint. Furthermore, report
developers can use these report parts to reduce duplicate efforts for reports that need the data
represented in the same fashion. A very useful feature is that if the report part is modified by a user with
appropriate permissions, the consumers of that report part are notified about the update and they can
choose to refresh their report or to leave it as it was.
www.it-ebooks.info
CHAPTER 1 INTRODUCING THE REPORTING SERVICES ARCHITECTURE
6
Lookup Functions
Before 2008 R2, the need often arose to find a value in a different data region in the same report. Since
the data in both of the tables could be linked by a common field, one workaround was simply to gather
the data in the source query by joining the tables together. Often, this may perform better on the
backend, but sometimes you need to look up values in another data region, so Microsoft has added three
lookup functions to Reporting Services: Lookup, LookupSet and MultiLookup.
Shared Datasets
Before moving on from the upgrades released with SSRS 2008 R2 and 2012, let’s briefly talk about shared
datasets. This feature, added in 2008 R2, allows you to create a dataset that can be consumed among
other reports. Imagine you have created a project with 50 reports, about 10 of them with a parameter for
all of the countries throughout the world. Thinking of manageability, you designed this dataset to be
loaded by making a call to a stored procedure. In previous releases of SSRS, you would have needed to
create a dataset for every report that needed this parameter, so any change that affected them all would
have had to be made in them all, one at a time. From 2008 R2 onward, we can create a shared dataset
and use it across reports. A change in that single dataset updates all the reports that need that change.
SSRS and Business Intelligence
SSRS is just one component of Microsoft’s BI platform. We’ll now cover other new features and
enhancements since SQL Server 2008 that will form an integral part of your overall reporting solution.
Business Intelligence Development Studio and SQL Server Data
Tools
Business Intelligence Development Studio (BIDS) is a limited version of Visual Studio 2008, included
with the SQL Server 2008 base installation. In SQL Server 2012, the report designer takes on a new name,
SQL Server Data Tools (SSDT), and we now have the Visual Studio 2010 shell rather than VS 2008. With
SSDT and BIDS, developers can create entire projects for each of the supported components of SQL
Server 2012, including SSIS, SSAS, and of course SSRS. We will use SSDT throughout the book (except in
Chapter 13, where we use Report Builder to show you how to design and deploy SSRS reports and
Analysis Services projects). Note that SSDT and BIDS both use the devenv executable and as such, can be
used interchangeably.
SQL Server Management Studio (SSMS)
With the release of SQL Server 2008, Microsoft continued to build on its management platform with SQL
Server Management Studio (SSMS). Microsoft has taken a big step toward consolidating, in a single
environment, many of the tools that in previous versions of SQL Server would have been executed
individually. SSMS replaces Enterprise Manager and Query Analyzer, offering a much more elaborate set
of tools for creating and managing SQL Server objects and queries. In addition to managing SQL Server
and Analysis Services servers, administrators can use SSMS to manage instances of their SSRS reporting
servers. We have heard in the SQL Server community that Management Studio will run in the Visual
Studio shell, but for now, anyway, it still runs with ssms.exe. However, SSMS users will now be able to
undock windows and have them on multiple monitors as Visual Studio developers have done for some
years.
www.it-ebooks.info
CHAPTER 1 INTRODUCING THE REPORTING SERVICES ARCHITECTURE
7
Throughout the book, we will show you how to use both SSMS and Report Manager for various
tasks. For example, we will show you how to use SSMS to test query performance and the browser-based
Report Manager to view published reports, set security permissions, and create subscriptions. Although
the two applications share functionality for managing SSRS, Report Manager is often preferable to SSMS
because it can perform many more administrative tasks and does not require a local installation. You
can access Report Manager from a browser anywhere on your network, but you would need access to the
installed SQL Server 2012 client tools to use SSMS.
SSRS Architecture
You’ve probably heard the expression that the devil is in the details. You’ll be drilling into those details
throughout the book, right down to the data packets that SSRS constructs, as you explore each aspect of
SSRS from design to security. For now, let’s pull back to a broader vantage point—the 10,000-foot view if
you will—and look at the three main components that work together to make SSRS a true multi-tier
application: the client, the report server, and the SQL Server report databases. Figure 1-1 shows the
conceptual breakdown of the three component pieces.
The data source and the SSRS databases, ReportServer and ReportServerTempDB, are separate
entities. The data source is the origin of the data that will populate the reports, while the report server
databases store metadata and execution information about the reports. Both the data source and the
report server databases can physically be located on the same SQL Server, assuming the data source is a
SQL Server database. The data source can be any supported data provider, such as SQL Server, Oracle,
Lightweight Directory Access Protocol (LDAP), Microsoft SharePoint List, SQL Azure and Analysis
Services. It’s possible to configure a single server to act as both the SSRS report server web service and
report server database as well as the data source server. However, this isn’t recommended unless you
have a small user base. We’ll show you how to monitor the performance of the SSRS configuration and
build a small Web farm, post-installation, in Chapter 10.
www.it-ebooks.info
CHAPTER 1 INTRODUCING THE REPORTING SERVICES ARCHITECTURE
8
Figure 1-1. SSRS components
SSRS Databases
SSRS is added as an option during the SQL Server installation process. The SSRS native installation
creates two databases that are used to store report metadata and manage performance:
ReportServer: This is the primary database that stores all the information about
reports that was originally provided from the RDL files used to create and
publish the reports to the ReportServer database. In addition to report
properties (such as data sources) and report parameters, ReportServer also
stores folder hierarchy and report execution log information.
ReportServerTempDB: This database houses cached copies of reports that you
can use to increase performance for many simultaneous users. By caching
reports using a nonvolatile storage mechanism, you make sure they remain
available to users even if the report server is restarted.
www.it-ebooks.info
CHAPTER 1 INTRODUCING THE REPORTING SERVICES ARCHITECTURE
9
Database administrators can use standard tools to back up and restore these two databases. An
additional database might be added after the initial installation of SSRS: the RSExecutionLog database.
This stores more detailed information about report execution, such as the user who ran the report, the
time of execution, and performance statistics. We’ll cover creating the Pro_SSRSExecutionLog database
and discuss report execution logging in detail in Chapter 10.
Note When configuring Reporting Services to run in SharePoint integrated mode for 2012, an extra database is
installed for Alerting. Note also that the default database names are slightly different as they will have a unique
identifier appended to
ReportingService_, assigned when creating the instance of Reporting Services on the
SharePoint site. For example, in SharePoint integrated mode,
ReportServerTempDB becomes something like
ReportingService_14214aae2b5d4f0d888289011932bmcdTempDB. We’ll look at SharePoint integrated mode in
chapter 12.
The SSRS Report Server
The SSRS report server plays the most important role in the SSRS model. Working in the middle, it’s
responsible for every client request to render a report or to perform a management request, such as
creating a subscription. You can break down the report server into several subcomponents by function:
• Programming interface
• Authentication Layer (new in SSRS 2008)
• Report processing
• Data processing
• Report rendering
• Report scheduling and delivery
SSRS Web Service Interface
The programming interface, exposed as .NET Web service application programming interfaces (APIs)
and uniform resource locator (URL) access methods, handles all incoming report and management
requests from clients. Depending on the type of request, the programming interface either processes it
directly by accessing the ReportServer database or passes it off to another component for further
processing. If the request is for an on-demand report or a snapshot, the Web service passes it to the
Report Processor before delivering the completed request to the client or storing it in the ReportServer
database.
www.it-ebooks.info
CHAPTER 1 INTRODUCING THE REPORTING SERVICES ARCHITECTURE
10
Note On-demand reports are rendered and delivered directly to the client, while snapshots are reports that are
processed at a point in time and delivered to the client through e-mail or via file shares, or (if configured) directly
to a printer.
Authentication Layer
SSRS 2005 relied heavily on the authentication methodology of Internet Information Services (IIS), since
SSRS and IIS were interdependent. With the exception of SSRS in SharePoint integrated mode, no SSRS
versions since 2008 are tied to IIS. SSRS now uses Http.sys directly, as well as SQL Server’s native
network components, so SSRS’s architecture has been redesigned to include its own authentication
layer, which we will cover in Chapter 11.
The Report Processor
The Report Processor component is responsible for all report requests. Like the programming interface,
it communicates directly with the ReportServer database to receive the report definition information
that it then uses to combine with the data returned from the data source, which is accessed via one of
the data processing extensions.
Data Processing
Reporting Services supports twelve data processing extensions to connect to data sources. These are:
• SQL Server
• Oracle
• OLE DB
• OLEDB-MD
• ODBC
• XML
• SAP BI NetWeaver
• Hyperion Essbase
• Teradata
• Microsoft SQL Azure (SQL in the Cloud)
• Microsoft SQL Server Parallel Data Warehouse
• Microsoft SharePoint List
When the data processing component receives the request from the Report Processor, it initiates a
connection to the data source and passes it the source query. Data is returned and sent back to the
www.it-ebooks.info
CHAPTER 1 INTRODUCING THE REPORTING SERVICES ARCHITECTURE
11
Report Processor, which then combines the elements of the report with the data returned from the Data
Processor extension.
Report Rendering
The combined report and data is handed off to the rendering extension component to be stored in an
intermediate format called Report Page Layout (RPL). The RPL is then turned into one of several
supported or custom formats, based on the rendering type specified by the client (we cover rendering in
depth in Chapter 8):
• HTML: Default rendering format, supporting HTML versions 4.0 and 3.2.
• Portable Document Format (PDF): Format used to produce print-ready reports
using Adobe Acrobat Reader. SSRS doesn’t require that you have an Adobe license
to render in PDF, which is a great benefit to customers. All you need is a PDF
reader.
• Excel 2002 and 2003: Service Pack 1 of SSRS supports Excel 97 and later. As
discussed previously, SQL Server 2012 supports exporting in 2007-2010 (.xlsx)
compressed format to allow more rows and columns.
• XML: Other applications or services can use reports that are exported to XML.
• Comma-separated values (CSVs): By rendering to a CSV file, you can further
process the report by importing it into other CSV-supported applications such as
Microsoft Excel.
• MIME HTML (MHTML): You can use this format, also known as a Web archive, to
deliver reports directly in e-mail or to deliver them for storage, because the report
contents, including images, are embedded within a single file.
• Tagged Image File Format (TIFF): Rendering image files using TIFF guarantees a
standard view of the report, as it’s processed the same way for all users, whatever
their browser settings or versions.
• Microsoft Word: Standard Microsoft Word document export is now included in
SSRS 2008. Both 97-2003 (.doc) and 2007-2010 (.docx) compressed formats are
available in SSRS 2012.
• ATOM: This format can be consumed by ATOM-compliant client applications
such as PowerPivot and SharePoint.
• NULL: The NULL rendering extension isn’t actually a format like the others, but
can be used to cache results of reports. The next time the report is requested; it is
pulled from cache and rendered significantly quicker. This is especially useful if
you have a larger report that takes an abnormally long time to render. You will see
this extension as a delivery format when creating subscriptions.
Scheduling and Delivery
If the request from the client requires a schedule or delivery extension, such as a snapshot or
subscription, the programming interface calls the Scheduling and Delivery Processor to handle the
request. You can generate and deliver report snapshots, based on a user-defined or shared schedule, to
www.it-ebooks.info
CHAPTER 1 INTRODUCING THE REPORTING SERVICES ARCHITECTURE
12
one of two supported delivery extensions: an e-mail or a file share. Note that SSRS uses the SQL Server
Agent to create the scheduled job. If the SQL Server Agent isn’t running, the job won’t execute. We’ll
cover creating subscriptions and snapshots based on shared schedules in Chapter 10.
Client Applications
SSRS includes several client applications that use the SSRS programming interface, including Web
service APIs and URL access methods, to provide front-end tools for users to access both SSRS reports
and configuration tools. These tools provide report server management, security implementation, and
report-rendering functionality. The tools are as follows:
• Report Manager: This browser-based application ships with SSRS and provides a
graphical interface for users who need to view or print reports, or to manage
report objects for their workgroups or departments. We describe Report Manager
in detail in Chapter 10, which covers managing SSRS.
• BIDS or SSDT: This tool provides an integrated environment for developing SSRS
reports. We introduce BIDS or SSDT in Chapters 3-5 and step through building
reports in this environment in Chapter 6 and throughout the book.
• Command-line utilities: You can use several command-line tools to configure and
manage the SSRS environment, including rs, rsconfig, rskeymgmt and rsactivate.
• Report Builder 3.0: This enhanced application was primarily developed to give
business users the ability to create ad hoc reports. Nearly all of the features
available in BIDS are also available in Report Builder 3.0.
• Custom clients: These .NET Windows Forms and Web applications call the SSRS
Web service to perform such tasks as rendering reports and managing report
objects. SSRS includes sample application projects that you can compile and run
to extend the functionality provided by the main tools listed earlier. In Chapters 8
and 9, we show you how to develop your own custom applications: a report viewer
and a report publisher.
• Reporting Services Configuration Manager: SSRS for SQL Server 2008 included an
enhanced Reporting Services Configuration Manager designed specifically to
change many of these properties in a graphical environment, including setting up
the SSRS environment for offline or disconnected reporting.
When thinking of a Web-based application, the natural inclination is to think Web browser. Even
though other front-end tools, such as SSMS and Visual Studio, connect to the report server, a Web
browser plays an important role in providing the graphical interface for users, who can use Report
Manager to view or print reports or remotely manage the report server for their workgroups or
departments.
Report Manager
Within Report Manager, users can render reports, create report subscriptions, modify the properties of
report objects, and configure security, as well as perform a host of other tasks. Users can access Report
Manager by simply opening their Web browser and navigating to a URL of the form http:
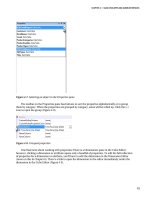
//Servername/Reports. Figure 1-2 shows Report Manager in action, with a listing of reports in a folder
deployed specifically for clinicians.
www.it-ebooks.info
CHAPTER 1 INTRODUCING THE REPORTING SERVICES ARCHITECTURE
13
Figure 1-2. The Web-based Report Manager application
Business Intelligence Development Studio (BIDS) and SQL Server
Data Tools (SSDT)
The browser is only one of several clients that can use the SSRS Web service. In fact, BIDS is a client
when it interacts with the Web service to deploy reports and data sources. BIDS offers a graphical design
environment for report developers to produce the RDL files that SSRS uses for deploying and rendering
reports.
Note Because RDL is a defined standard, you can use any design application that supports the creation of RDL
files. Other third-party report designers are available, and many more are said to be in development.
By defining the base URL and folder name in a BIDS report project, you can deploy created RDL files
directly to the report server while in design mode. The base URL is of the form
http://Servername/ReportServer. If you have SSRS configured to run under a port other than the
default, 80, specify http://ServerName:PortNumber/ReportServer. We’ll cover the entire BIDS design
environment in Chapters 3-5, including most available report objects. We’ll also describe the RDL
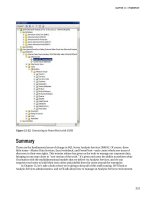
schema that defines every aspect of an SSRS report. Figure 1-3 shows the BIDS design environment, also
called an integrated development environment (IDE), with a report loaded in design mode.
www.it-ebooks.info
CHAPTER 1 INTRODUCING THE REPORTING SERVICES ARCHITECTURE
14
Figure 1-3. BIDS environment
Command-Line Utilities
In addition to graphical applications such as BIDS and SSMS, SSRS provides several command-line
utilities that are considered Web service clients. The tools have the added benefit of being automated by
using built-in task scheduling in Windows. SSRS includes four main command-line utilities:
• rs: Processes reporting services script (RSS) files that are written with VB.NET
code. Because you can access the full SSRS API via the code in the script, all SSRS
Web service methods are available.
• rsconfig: Configures the authentication methods and credentials for connecting
SSRS to the ReportServer database. The rsconfig utility also sets the unattended
SSRS execution credentials.
• rskeymgmt: Manages the encryption keys that SSRS uses to store sensitive data
securely, such as authentication credentials. Chapter 11 covers the use of
rskeymgmt.
• rsactivate: Adds another instance of Reporting Services to a Web Farm, and is
useful for replacing a corrupted instance.
Report Builder
The Report Builder application develops reports in an environment much like other Microsoft Office
products, with a ribbon style interface. Report Builder 3.0, released with SSRS 2008 R2, provides nearly
all of the capabilities of the Report Designer within BIDS. You can install it using standard ClickOnce
www.it-ebooks.info
CHAPTER 1 INTRODUCING THE REPORTING SERVICES ARCHITECTURE
15
technologies from within the browser or as a thick client application to make it available under the
Windows Start menu. Figure 1-4 shows an example of a report from Chapter 6, loaded in the Report
Builder.
Figure 1-4. Report Builder 3.0
Custom Clients
The final types of clients are those custom designed to access the SSRS Web services. Between all of the
authors of this book, we have built several such applications for many organizations, which use both the
report viewer and the report publisher. Third-party commercial applications provide extended
functionality, for instance RS Scripter, which assists in scripting and managing various report server
catalog items; it can extract RDLs from a server, and manage subscriptions, roles, and even migration
from one server to another.
Installing and Configuring
You can install Reporting Services—like Analysis Services, Integration Services, and Notification
Services—as part of the main SQL Server installation. Before you install Reporting Services 2012, you
must know whether you are going to run in native or SharePoint integrated mode. With earlier releases
of Reporting Services, you could change mode after installation by using the Reporting Services
www.it-ebooks.info
CHAPTER 1 INTRODUCING THE REPORTING SERVICES ARCHITECTURE
16
Configuration Manager, but with the 2012 release, you can only configure Reporting Services in
SharePoint integrated mode at SQL Server installation, as the application will be installed and
configured as a native SharePoint service.
The components installed depend on the mode your organization chooses to implement. For
instance, when installing in native mode, components include the Reporting Services Web service,
ReportServer databases, and Report Manager web application. Once you have installed Reporting
Services, you can disable some features if you do not need them. You might choose to do this, for
example, if you wanted to use a custom application to interface with the ReportServer rather than the
built in Report Manager web application. Installed client components include the administrative
command-line tools mentioned previously, such as rs and rsconfig, as well as documentation, samples,
and the Reporting Services Configuration Manager mentioned earlier.
If you use the default configuration settings for native mode during the installation of Reporting
Services, you will use the RS Configuration Manager to set up or change various other settings related to
the instance. Some tasks to perform are:
• Choosing security settings, such as whether the report server will use HTTP,
HTTPS, or both.
• Configuring a Simple Mail Transfer Protocol (SMTP) mail server to handle the
delivery of subscriptions.
• Backup and restore the encryption key used when you move a report server to a
new machine.
• Set up Web Service and Report Manager URLs and define the ports they run on.
This gives you the ability to run multiple reporting services instances on one
machine.
As mentioned, once you have installed SSRS, you can modify some of the configuration settings. For
example, after reviewing performance data, you might decide that the report server needs to connect to
an existing Web farm. You can perform this task using the rsconfig utility or by using the graphical
Reporting Services Configuration Manager. You can reconfigure the security settings or the mail server
by directly modifying the RSReportServer.config file. We’ll cover using these tools, modifying the
configuration file settings, and gathering performance measures in Chapters 10 and 11.
If you choose to use SharePoint integrated mode, the configuration settings are managed
completely within SharePoint’s Central Administration. We will cover more of SharePoint integration in
Chapter 12.
Deploying SSRS Securely
Security ranks as one of the highest priorities for businesses today. Providing customers and employees
with a secure and reliable computing environment is not only good practice, but also in many cases a
requirement, mandated by stringent federal regulations. In our case, this means adherence to the Health
Insurance Portability and Accountability Act (HIPAA). This requires policies and procedures to be in
place that guarantee confidential patient information is not only securely transmitted, but also
accessible only by those with the authority to view it. To that end, we have to ensure that the data we
transmit over a network connection, especially the Internet, is encrypted at its source.
SSRS is a role-based application that provides access to the objects it stores through the use of
defined roles, such as content browsers who may only view reports and report data. The roles are
associated with Windows-based login accounts, so SSRS relies on Windows as its primary source of
authentication. It is possible to extend the security model for SSRS to support other methods of
authentication, such as forms-based authentication, whereby users can log in with accounts maintained
www.it-ebooks.info
CHAPTER 1 INTRODUCING THE REPORTING SERVICES ARCHITECTURE
17
outside Windows to access the report server. Since SSRS has multiple authentication points—namely, at
the report server level through http.sys and the data-access level, SQL, or Windows authentication—
specific security risks exist when altering the default Windows roles-based security model. For one,
http.sys would need to be set up to allow explicit access and custom validation of a user’s credentials.
Another risk is that SSRS can support only one security extension at a time. In other words, a single SSRS
report server can be extended to support a non-default authentication model or remain as a default
Windows authentication, but cannot take advantage of both models simultaneously. Depending on your
level of need for custom security—say, for example, you need to deploy SSRS on an Internet-facing
server, or your application already supports forms authentication, and it would be too difficult to work
within the constraints of Windows authentication—then you might need to consider a custom security
extension. Our needs were such that we could easily incorporate SSRS into an existing Windows
authentication model.
Another method of dealing with security is through a Windows or Web-based application that has
its own authentication layer. Using the ReportViewer control within the Visual Studio designer for
Windows and Web forms, you can use an application as a portal into the report server. As long as the
application handles security, you can give the application server access to the needed objects within
Reporting Services by using an Active Directory computer account like DOMAIN\ServerName$.
In this book, we’ll cover two deployment scenarios:
• Intranet deployment using Virtual Private Network (VPN) and firewall
technologies to allow access to the SSRS report server
• An Internet-hosted application that uses Terminal Services to connect securely to
an SSRS report server
In Chapter 11, we’ll walk you through securing the SSRS deployment models with technologies that
provide the required encryption levels and user authentication. In addition to the two models that we
cover, we briefly discuss ways to integrate a forms-based authentication method allowing clients to
connect directly to SSRS via the Internet.
Summary
Having created and deployed numerous projects with SSRS for SQL Server 2005, 2008 and 2008 R2, we
have been anxiously awaiting, along with the rest of the SQL Server community, the release of SQL
Server 2012. As you work through the book, we will point out the enhancements released with SSRS 2008
R2 and SSRS 2012. However, our main aim, as with the other editions of the book, is to show you how to
take advantage of advanced features, providing useful examples, enabling you to put SSRS to work in a
real-world environment where the user of the reports and applications that you deploy will have the
final say on the solution’s success.
www.it-ebooks.info
C H A P T E R 2
19
Report Authoring:
Designing Efficient Queries
SSRS provides a platform for developing and managing reports in an environment that includes multiple
data sources of information. These data sources can include both relational data (for example, SQL
Server, Oracle, MySQL, and so on) and non-relational data (for example, Active Directory, LDAP stores,
and Exchange Server). Standards such as ODBC, OLE DB, and .NET facilitate the retrieval of data from
these disparate data stores, so SSRS can access the data as long as your system has the relevant drivers.
In the SSRS report design environment, configuring a dataset that drives the report content is the first
step of the design process.
However, before we introduce the many elements of the report design environment, it’s important
to begin with the heart of any data-driven report—whether it’s Business Objects Reports, SSRS, or
Microsoft Access—and that is the query. With any report design application, developing a query that
returns the desired data efficiently is the key to a successful report.
In this chapter, we will describe the following:
The healthcare database that is the target of the reporting queries in this book:
You must understand the design of the data before you can design efficient
queries. We’ll also describe an easy way to familiarize yourself with your data
when the full schema details are not available.
How to design basic but effective SQL queries for reporting purposes: We’ll create
queries based on real-world applications, the kind that report writers and
database administrators create every day.
How to use SSMS to gauge query performance: The initial query defines the
performance and value of the report, so it’s important to understand the tools
required to create and test the query to ensure that it’s both accurate and tuned
for high performance.
How to transform the optimized query into a parameterized, stored procedure:
This gives you the benefit of pre-compilation and cached execution plans for
faster performance and the benefit of the procedure being centrally updated
and secured on SQL Server.
Introducing the Sample Relational Database
Throughout the book, we’ll show you how to design and deploy a reporting solution and build custom
.NET SSRS applications for an SQL Server-based healthcare application, using relational tables and
stored procedures. The application was originally designed for home health and hospice facilities that
offer clinical care to their patients, typically in their homes. Our example for this book, the Online
www.it-ebooks.info
CHAPTER 2 REPORT AUTHORING: DESIGNING EFFICIENT QUERIES
20
Transactional Processing (OLTP) database, powers this application, capturing billing and clinical
information for home health and hospice patients. The database that we will use is called Pro_SSRS and
is available for download in the Source Code/Download area of the Apress Web site
(), together with instructions in the ReadMe.txt file on how to restore the database
in preparation for use in this and subsequent chapters.
Introducing the Schema Design
Over the years, developers have added features to the application and altered the database schema
many times to accommodate the new functionality and to capture required data. This data is needed not
only to perform operational processes such as creating bills and posting payments to the patient’s
account, but also to provide valuable reports that show how well the company is serving its patients.
Because these types of healthcare facilities offer long-term care, our customers need to know if their
patients’ conditions are improving over time and the overall cost of the care delivered to them.
The database designed for the application consists of more than 200 tables and has many stored
procedures. In this book, you’ll use a subset of that database to learn how to develop reports that show
the cost of care for patients. You’ll use eight main tables for the queries and stored procedures
throughout the book, and you’ll begin using some of them to build reports as you work through the next
three chapters. These tables are as follows:
Trx: The main transactional data table that stores detailed patient services
information. We use the term services to refer to items with an associated cost
that are provided for patient care.
Services: Stores the names and categories for the detailed line items found in
the Trx table. Services could be clinical visits such as a skilled nurse visit, but
could also include billable supplies, such as a gauze bandage or syringes.
ServiceLogCtgry: The main grouping of services that are similar and provide a
higher-level grouping. For example, all visits can be associated with a “Visits”
ServiceLogCtgry for reporting.
Employee: Stores records specific to the employee, in this case a clinician or
other staff member such as a chaplain visiting a hospice patient. An employee
is assigned to each visit stored in the Trx table.
Patient: Includes demographic information about the patient receiving the
care. This table, like the Employee table, links directly to the Trx table for
detailed transactional data.
Branch: Stores the branch name and location of the patient receiving the care.
Branches, in the sample reports, are cost centers from which visits and services
were delivered.
Chargelnfo: Contains additional information related to the individual Trx
records that is specific to charges. Charges have an associated charge, unlike
payments and adjustments, which are also stored in the Trx table.
Diag: Stores the primary diagnoses of the patient being cared for and links to a
record in the Trx table.
www.it-ebooks.info