planar graph drawing - t. nishizeki, m. rahman
Bạn đang xem bản rút gọn của tài liệu. Xem và tải ngay bản đầy đủ của tài liệu tại đây (16.54 MB, 309 trang )
ANAR
RAPH
RAWING
TEAM LinG - Live, Informative, Non-cost and Genuine !
LECTURE NOTES SERIES ON COMPUTING
Editor-in-Chief:
D
T
Lee
(Academia Sinica, Taiwan)
Published
Vol.
1:
VOl.
2:
VOl.
3:
VOl.
4:
VOl.
5:
Vol.
6:
VOl.
7:
Vol.
8:
VOl.
9:
VOl.
10:
Vol.
11:
Computing in Euclidean Geometry
Eds.
D-Z
Du
&
F
Hwang
Algorithmic Aspects
of
VLSl
Layout
Eds.
D T
Lee
&
M
Sarrafzadeh
String Searching Algorithms
G
A
Stephen
Computing in Euclidean Geometry (Second Edition)
Eds.
D-Z
Du
&
F
Hwang
Proceedings of the Conference on
Parallel Symbolic Computation
-
PASCO
'94
Ed.
H
Hong
VLSl
Physical Design Automation: Theory and Practice
S
M
Sait
&
H
Youssef
Algorithms: Design Techniques and Analysis
Ed.
M
H Alsuwaiyel
Computer Mathematics
Proceedings of the Fourth Asian Symposium (ASCM
2000)
Eds.
X-S
Gao
&
D
Wang
Computer Mathematics
Proceedings
of
the Fifth Asian Symposium (ASCM
2001)
Eds.
K
Yokoyama &
K
Shirayanagi
Computer Mathematics
Proceedings of the Sixth Asian Symposium (ASCM
2003)
Eds.
Z
Li
&
W
Sit
Geometric Computation
fds.
F
Chen
&
D Wang
TEAM LinG - Live, Informative, Non-cost and Genuine !
otes Series on Corn uting - Vol. 12
Tohoku University, Japan
Bangladesh University
of
Engineering
and
Technology, Bangiadesh
NEW
JERSEY
-
LONCON
SINGAPORE
@
BElJlNG SHANGHAI HOMG KONG
a
TAIPEI
*
CHENNAI
TEAM LinG - Live, Informative, Non-cost and Genuine !
Published by
World Scientific Publishing Co. Pte. Ltd.
5
Toh Tuck Link, Singapore 596224
USA
office:
27 Warren Street, Suite 401-402, Hackensack, NJ
07601
UK
office:
57 Shelton Street, Covent Garden, London WC2H 9HE
British Library Cataloguing-in-Publication Data
A
catalogue record for this book is available from the British Library.
PLANAR GRAPH DRAWING
Lecture Notes Series on Computing
-
Vol.
12
Copyright
0
2004 by World Scientific Publishing
Co.
Pte. Ltd.
All
rights reserved. This book,
or
parts
thereof;
may not be reproduced in any form
or
by any means,
electronic
or
mechanical, including photocopying, recording
or
any information storage and retrieval
system now known
or
to
be
invented, without written permission from the Publisher.
For
photocopying
of
material
in
this volume, please pay a copying fee through the Copyright
Clearance Center, Inc., 222 Rosewood Drive, Danvers,
MA
01923,
USA.
In this case permission to
photocopy is not required from the publisher.
ISBN 981-256-033-5
Printed by FuIsland Offset Printing
(S)
Pte Ltd, Singapore
TEAM LinG - Live, Informative, Non-cost and Genuine !
Preface
Motivation
This
book
deals with theories and algorithms for drawing planar graphs.
Graph drawing has appeared as
a
lively area in computer science due to
its applications in almost all branches of science and technology. Many
researchers have concentrated their attention on drawing planar graphs for
the following reasons:
0
drawings of planar graphs have no edge crossings, and look nice;
drawings of planar graphs have practical applications in
VLSI
floor-
planning and routing, architectural floorplanning, displaying
RNA
structures in bioinformatics, etc.; and
algorithms for drawing planar graphs can be successfully used for
drawing a nonplanar graph by transforming it into
a
similar planar
graph.
During the last two decades numerous results have been published on
drawing planar graphs. For example, in
1990
it was shown that every pla-
nar graph of
n
vertices has
a
straight-line drawing on
a
grid of area
O(n2).
This result solved the open question for about four decades whether
a
pla-
nar graph has
a
straight line drawing on a grid of
a
polynomial area. Many
algorithms have been developed to produce drawings of planar graphs with
different styles to fulfill different application needs. While developing these
algorithms, many elegant theories on the properties
of
planar graphs have
been discovered, which have applications in solving problems on planar
graphs other than graph drawing problems.
For
example, Schnyder intro-
duced
a
“realizer” to produce straight line drawings of planar graphs, but
later
a
realizer is used to solve the “independent spanning tree problem”
V
TEAM LinG - Live, Informative, Non-cost and Genuine !
vi
Planar
Graph
Drawing
of
a
certain class of planar graphs.
A
“canonical ordering” which was in-
troduced by de Fraysseix
et
al.
is later used to solve a “graph partitioning
problem.” On the other hand, many established graph theoretic results
have been successfully used to solve graph drawing problems. For exam-
ple, the problem of orthogonal drawings of plane graphs with the minimum
number of bends is solved by reducing the problem to a network flow prob-
lem.
Recently, it appeared to us that
a
systematic and organized
book
con-
taining these many results on planar graph drawings can help students and
researchers of computer science to apply the results in appropriate areas.
For example, we observed that people working with
VLSI
floorplanning by
rectangular dual did not notice Thomassen’s result on rectangular drawings
of plane graphs. In our opinion the theory and algorithms are complemen-
tary to each other in the research of planar graph drawings. We have thus
tried to include in the book most of the important theorems and algorithms
that are currently known for planar graph drawing. Furthermore, we have
tried to provide constructive proofs for theorems, from which algorithms
immediately follow.
Organization
of
the
Book
This book is organized as follows.
Chapter
1
is the introduction of graph drawing. It introduces different
drawing styles of planar graphs, and presents properties
of
graph drawing
and some applications of graph drawing.
Chapter
2
deals with graph theoretic fundamentals.
Chapter
3
provides algorithmic fundamentals.
Chapter
4
describes straight line drawings of planar graphs on an integer
grid. We present both the famous results of de Fraysseix
et
al.
and Schnyder
on straight-line drawings of planar graphs in this chapter.
Chapter
5
focuses on convex drawings of planar graphs. In this chapter
we present the results of Tutte, Thomassen and Chiba
et
al.
on charac-
terization of planar graphs with convex drawings. We also include recent
results on convex grid drawings by Kant and Chrobak, and Miura
et
al.
Chapter
6
deals with rectangular drawings of planar graphs. In this
chapter we present
a
technique of Miura
et
al.
for reducing a rectangular
drawing problem to
a
matching problem. We present Thomassen’s result
on rectangular drawings of plane graphs, and describe
a
generalization of
TEAM LinG - Live, Informative, Non-cost and Genuine !
Preface
vii
Thomassen’s result given by Rahman
et
al.
We also present
a
necessary
and sufficient condition for
a
planar graph to have
a
rectangular drawing.
Several algorithms for rectangular drawings are included in this chapter.
Chapter
7
deals with box-rectangular drawings of plane graphs. In this
chapter we present
a
necessary and sufficient condition for
a
plane graph to
have
a
box-rectangular drawing, and present
a
linear algorithm for finding
a
box-rectangular drawing of
a
plane graph.
Chapter
8
discusses orthogonal drawings of plane graphs. In this chapter
we present the results of Tamassia for solving the problem of finding
a
bend-
minimum orthogonal drawing of
a
plane graph by reducing the problem to
a
network flow problem. We explain a linear algorithm for finding
a
bend-
minimum orthogonal drawing of a triconnected cubic plane graph. In this
chapter we also include
a
necessary and sufficient condition for a plane
graph to have
a
no-bend orthogonal drawing.
Chapter
9
deals with octagonal drawings
of
plane graphs with prescribed
face areas. In this chapter we show that every “good slicing graph” has an
octagonal drawing where each face is drawn as
a
rectilinear polygon of
at
most eight corners and the area of each inner face is equal to
a
prescribed
value. We also present
a
linear algorithm for finding such
a
drawing.
Appendix
A
presents planarity testing and embedding algorithms.
Use
of
the
book
This book is suitable for use in advanced undergraduate and graduate level
courses on Algorithms, Graph Theory, Graph Drawing, Information Visu-
alization, and Computational Geometry. This book will serve as
a
good
reference book for the researchers in the field of graph drawing. In this
book many fundamental graph drawing algorithms are described with il-
lustrations, which are helpful for software developers, particularly in the
area of information visualization, VLSI design and CAD.
Acknowledgments
It is
a
pleasure to record our gratitude to those to whom we are indebted,
directly or indirectly, in writing this book.
A
book as this one owes a great
deal, of course, to many previous researchers and writers. Without trying
to be complete, we would like
to
mention the books of Nishizeki and Chiba,
Di Battista
et
al.,
and the tutorial edited by Kaufmann and Wagner. We
TEAM LinG - Live, Informative, Non-cost and Genuine !
Vlll
Planar
Graph
Drawing
also acknowledge
T.
C.
Biedl, M. Chrobak,
H.
de Fraysseix,
A.
Garg, G.
Kant,
R.
Tamassia,
C.
Thomassen,
J.
Pach,
T.
H.
Payne,
R.
Pollack, W.
Schnyder and W.
T.
Tutte; some of their results are covered in this book.
A
substantial part of this book is based on
a
series of the authors’
own investigations. We wish to thank the coauthors of our joint papers:
Norishige Chiba, Shubhashis Ghosh, Hiroki Haga, Kazuyuki Miura, Shin-
ichi Nakano, and Mahmuda Naznin.
This book is based on our graph drawing research project supported by
Japan Society for the Promotion of Science (JSPS) and Tohoku University.
We also acknowledge Bangladesh University of Engineering and Technology
(BUET) for providing the second author necessary leave to write this book.
We thankfully mention the names of our colleagues Yasuhito Asano and
Xiao Zhou
at
Tohoku university and Md. Shamsul Alam, Mohammad
Kaykobad and Md. Abul Kashem Mia
at
BUET
for their encouraging
comments on the book. The second author wishes to thank his parents for
supporting him throughout his life and for encouraging him to stay in
a
foreign country for the sake of writing this book.
We must thank the series editor
D.
T.
Lee for his positive decision for
publishing the book from World Scientific Publishing
Co.
We also thank
Yubing Zhai and Steven
Patt
of World Scientific Publishing
Co.
for their
helpful cooperation.
Finally, we would like to thank our wives Yuko Nishizeki and Mossa.
Anisa Khatun for their patience and constant support.
Taka0
Nishizeki
Md. Saidur Rahman
TEAM LinG - Live, Informative, Non-cost and Genuine !
Contents
Preface
V
1
.
Graph Drawing
1
1.1
Introduction
1
1.2 Historical Background
2
1.3
Drawing Styles
3
1.3.1
Planar Drawing
4
1.3.2 Polyline Drawing
5
1.3.3 Straight Line Drawing
5
1.3.4 Convex Drawing
6
1.3.5
Orthogonal Drawing
6
1.3.6 Box-Orthogonal Drawing
7
1.3.7 Rectangular Drawing
8
1.3.8 Box-Rectangular Drawing
8
1.3.9 Grid Drawing
8
1.3.10 Visibility Drawing
9
1.4 Properties
of
Drawings
10
1.5 Applications of Graph Drawing
11
1.5.1 Floorplanning
12
1.5.2 VLSI Layout
13
1.5.3 Software Engineering
14
1.6 Scope of This Book
15
1.5.4 Simulating Molecular Structures
15
2
.
Graph Theoretic Foundations 19
2.1 Basic Terminology
19
ix
TEAM LinG - Live, Informative, Non-cost and Genuine !
X
Planar
Graph Drawing
2.1.1 Graphs and Multigraphs
19
2.1.2 Subgraphs
20
2.1.3 Paths and Cycles
21
2.1.4 Chains
21
2.1.5 Connectivity
22
2.1.6 Trees and Forests
22
2.1.7 Complete Graphs
23
2.1.8 Bipartite Graphs
24
2.1.9 Subdivisions
24
2.2 Planar Graphs
24
2.2.1 Plane Graphs
26
2.2.2 Euler’s Formula
29
2.2.3 Dual Graph
30
2.3 Bibliographic Notes
31
3
.
Algorithmic Foundations
33
What is an Algorithm?
3.2 Machine Model and Complexity
34
3.2.1 The
O(
)
notation
34
3.2.2 Polynomial Algorithms
35
3.2.3 NP-complete Problems
35
3.3 Data Structures and Graph Representation
36
3.4 Exploring
a
Graph
3.4.1 Depth-First Search
38
3.4.2 Breadth-First Search
39
3.5 Data Structures for Plane Graphs
42
3.6 Bibliographic Notes
44
3.1
33
38
4
.
Straight Line Drawing
4.1
Introduction
4.2
Shift Method
4.2.1 Canonical Ordering
4.2.2 Shift Algorithm
4.2.3 Linear-Time Implementation
4.3 Realizer Method
4.3.1 Barycentric Representation
4.3.2 Schnyder Labeling
4.3.3 Realizer
45
45
46
46
50
54
58
58
62
66
TEAM LinG - Live, Informative, Non-cost and Genuine !
Contents
xi
4.3.4 Drawing Algorithm with Realizer
69
4.4 Compact Grid Drawing
72
4.4.1 Four-Canonical Ordering
74
4.4.2 Algorithm Four-Connected-Draw
77
4.4.3 Drawing
G'
79
4.5 Bibliographic Notes
87
5
.
Convex Drawing 89
5.1 Introduction
89
5.3 Convex Testing 94
5.2 Convex Drawing
90
5.3.1 Definitions
95
5.3.2 Condition
I1
98
5.3.3 Testing Algorithm
101
5.4 Convex Grid Drawings
of
3-Connected Plane Graphs
105
5.4.1 Canonical Decomposition
105
5.4.2 Algorithm
for
Convex Grid Drawing
110
5.5.1 Four-Canonical Decomposition
117
5.5.2 Algorithm
119
5.5.2.1 How to Compute 2-Coordinates
119
5.5.2.2 How to Compute y-Coordinates
123
5.6 Bibliographic Notes
127
5.5 Convex Grid Drawings
of
4-Connected Plane Graphs
117
6
. Rectangular Drawing 129
6.1 Introduction
129
6.2 Rectangular Drawing and Matching
130
6.3 Linear Algorithm
for
Rectangular Drawings
of
Plane Graphs 135
6.3.1 Thomassen's Theorem
135
6.3.2 Sufficiency
137
6.3.3 Rectangular Drawing Algorithm
152
6.3.4 Rectangular Grid Drawing
156
6.5 Rectangular Drawings
of
Planar Graphs
161
6.5.1 Case for
a
Subdivision
of
a Planar 3-connected Cubic
Graph
163
6.5.2 The Other Case
169
6.6 Bibliographic Notes
173
6.4 Rectangular Drawings without Designated Corners
159
TEAM LinG - Live, Informative, Non-cost and Genuine !
xii
Planar Graph Drawing
7
.
Box-Rectangular Drawing
7.1
Introduction
7.2
Preliminaries
7.3
Box-Rectangular Drawings with Designated Corner Boxes
.
7.4
Box-Rectangular Drawings without Designated Corners
.
.
7.4.1
Box-Rectangular Drawings of
G
with
A
5
3
7.4.2
Box-Rectangular Drawings of G with
A
2
4
7.5
Bibliographic Notes
8
. Orthogonal Drawing
8.1
Introduction
8.2.1
Orthogonal Representation
8.2.2
Flow Network
8.2
Orthogonal Drawing and Network Flow
8.2.3
Finding Bend-Optimal Drawing
8.3
Linear Algorithm for Bend-Optimal Drawing
8.3.1
Genealogical Tree
8.3.2
Assignment and Labeling
8.3.3
Feasible Orthogonal Drawing
8.3.4
Algorithm
8.4
Orthogonal Grid Drawing
Orthogonal Drawings without Bends
8.6
Bibliographic Notes
8.5
9
.
Octagonal Drawing
9.1
Introduction
9.2
Good Slicing Graphs
9.3
Octagonal Drawing
9.3.1
Algorithm Octagonal-Draw
9.3.2
Embedding
a
Slicing Path
9.3.3
Correctness and Time Complexity
9.4
Bibliographic Notes
Appendix A Planar Embedding
A.l
Introduction
A.2
Planarity Testing
A.2.1
&Numbering
A.2.2
Bush Form and PQTree
175
175
175
178
182
183
193
195
197
197
198
198
201
202
208
211
213
217
224
227
229
231
233
233
235
238
239
243
249
250
253
253
254
255
259
TEAM LinG - Live, Informative, Non-cost and Genuine !
Contents
XI11
A.2.3 Planarity Testing Algorithm
A.3 Finding Planar Embedding
266
Algorithm for Extending
A,
into Adj
A.3.2 Algorithm
for
Constructing
A,
271
A.4 Bibliographic
Notes
277
263
267
A.3.1
Bibliography
281
Index
291
TEAM LinG - Live, Informative, Non-cost and Genuine !
This page intentionally left blank
TEAM LinG - Live, Informative, Non-cost and Genuine !
Chapter
1
Graph
Drawing
1.1
Introduction
A
graph consists of
a
set of vertices and a set of edges, each joining two
vertices.
A
drawing of
a
graph can be thought of as
a
diagram consisting of
a
collection of objects corresponding to the vertices of the graph together
with some line segments corresponding to the edges connecting the objects.
People are using diagrams from ancient time to represent abstract things
like ideas, concepts, etc. as well as concrete things like maps, structures of
machines, etc.
A
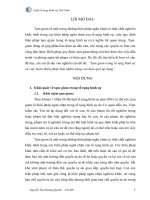
diagram of a computer network is depicted in Fig.
1.1,
where each component
of
the network is drawn by
a
small circle and
a
con-
nection between
a
pair
of
components is drawn by
a
straight line segment.
We can consider this diagram as
a
drawing of
a
graph which represents
information regarding interconnections of the computer network. The ver-
tices
of
the graph represent components
of
the network and are drawn as
small circles in the diagram, while the edges of the graph represent inter-
connection relationship among the components and are drawn
by
straight
line segments.
A
graph may be used to represent any information, like
interconnection information of
a
computer network, which can be modeled
as objects and relationship between those objects. A drawing of
a
graph is
a
sort of visualization of information represented by the graph.
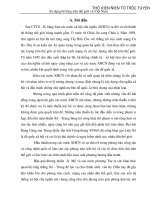
The graph in Fig. 1.2(a) repre-
sents eight components and their interconnections in an electronic circuit,
and Fig. 1.2(b) depicts
a
drawing of the graph. Although the graph in
Fig. l.2(a) correctly represents the circuit, the representation is messy and
hard to trace the circuit for understanding and troubleshooting. Further-
more, in this representation one cannot lay the circuit on
a
single layered
PCB (Printed Circuit Board) because of edge crossings. On the other hand,
We now consider another example.
1
TEAM LinG - Live, Informative, Non-cost and Genuine !
2
Planar Graph Drawing
STATION
STATION
STATION
STATION STATION
’’
J
STATION
Fig.
1.1
A
diagram
of
a
computer network.
the drawing of the graph in Fig. 1.2(b) looks better and it is easily traceable.
Furthermore one can use the drawing to lay the circuit on a single layered
PCB,
since it has no edge crossing. Thus the objective of graph drawing
is to obtain a nice representation of a graph such that the structure of the
graph is easily understandable, and moreover the drawing should satisfy
some criteria that arises from the application point of view.
1.2
Historical
Background
The origin of graph drawing
is
not well known. Although Euler (1707-1783)
is credited with originating graph theory in 1736 [BW76], graph drawings
were in limited use during centuries before Euler’s time. A known exam-
ple of ancient graph drawings is
a
family tree that decorated the atria of
patrician roman villas [KMBW02].
The industrial need for graph drawing algorithms arose in the late 1960’s
when
a
large number of elements in complex circuit designs made hand-
TEAM LinG - Live, Informative, Non-cost and Genuine !
Graph
Drawing
3
6
1
2
3
Fig.
1.2
An example
of
graph drawing in circuit schematics.
drawing too complicated [Bie97, Kan93, Rah99, Sug021. Algorithms were
developed to aid circuit design; an overview can be found in the book of
Lengauer [LenSO]. The field of graph drawing with the objective of pro-
ducing aesthetically pleasing pictures became of interest in the late 1980’s
for presenting information of engineering and production process [CON85,
TDB881.
The field of graph drawing has been flourished very much in the last
decade. Recent progress in computational geometry, topological graph
theory, and order theory has considerably affected the evolution of this
field, and has widened the range of issues being investigated. A compre-
hensive bibliography on graph drawing algorithms [DETT94] cites more
than 300 papers written before 1993. From 1993, an international sym-
posium on graph drawing is being held annually in different countries
and the proceedings
of
the symposium are published by Springer-Verlag
in the LNCS series [TT95, Bra96, Nor97, Dib97, Whi98, Kra99, MarO1,
GK02, Li0041. Several special issues of journals dedicated to graph draw-
ing have been recently assembled
[CE95,
DT96, DT98, DM99, LWOO,
Kau021.
1.3
Drawing
Styles
In this section we introduce some important drawing styles and related
terminologies.
TEAM LinG - Live, Informative, Non-cost and Genuine !
4
Planar Graph Drawing
Various graphic standards are used for drawing graphs. Usually, vertices
are represented by symbols such as points or boxes, and edges are repre-
sented by simple open Jordan curves connecting the symbols that represent
the associated vertices. From now
on,
we assume that vertices are repre-
sented
by
points if not specified.
We
now introduce the following drawing
styles.
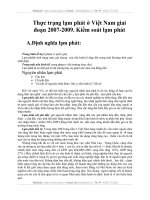
1.3.1
Planar Drawing
A
drawing of
a
graph
is
planar
if no two edges intersect in the drawing.
Figure 1.3 depicts
a
planar drawing and
a
non-planar drawing of the same
graph. It is preferable to find
a
planar drawing of
a
graph if the graph has
such
a
drawing.
Unfortunately not all graphs admit planar drawings.
A
graph which admits
a
planar drawing is called
a
planar graph.
b
d
Fig.
1.3
(a) A planar drawing, and
(b)
a
non-planar drawing of the same graph.
If
one wants to find
a
planar drawing of
a
given graph, first he/she needs
to test whether the given graph is planar or not. If the graph is planar,
then he/she needs to find
a
planar embedding of the graph, which is
a
data
structure representing adjacency lists: in each list the edges incident to
a
vertex are ordered, all clockwise or all counterclockwise, according to the
planar embedding. Kuratowski [KurSO] gave the first complete character-
ization of planar graphs. (See Theorem 2.2.1.) Unfortunately the char-
acterization does not lead to an efficient algorithm for planarity testing.
Linear-time algorithms for this problem have been developed by Hopcroft
and Tarjan [HT74], and Booth and Lueker [BL76]. Chiba
et
al.
[CNA085]
and Mehlhorn and Mutzel [MM96] gave linear-time algorithms for finding
a
planar embedding of
a
planar graph. Shih and Hsu [SH99] gave
a
simple
TEAM LinG - Live, Informative, Non-cost and Genuine !
Graph
Drawing
5
linear-time algorithm which performs planarity testing and finds
a
planar
embedding
of
a
planar graph simultaneously. For the interested reader,
algorithms for planarity testing and embeddings are given in Appendix
A.
A
planar graph with
a
fixed planar embedding is called
a
plane graph.
1.3.2
Polyline Drawing
A
polyline drawing
is
a
drawing of
a
graph in which each edge of the graph
is represented by
a
polygonal chain.
A
polyline drawing of
a
graph is shown
in Fig.
1.4.
A
point
at
which an edge changes its direction in
a
polyline
drawing is called
a
bend.
Polyline drawings provide great flexibility since
they can approximate drawings with curved edges. However, it may be
difficult to follow edges with more than two or three bends by the eye.
Several interesting results on polyline drawings can be found in
[BSM02,
DDLW03,
GM98].
Fig. 1.4
A
polyline drawing
of
a
graph
1.3.3
Straight Line Drawing
A
straight line drawing
is
a
drawing of
a
graph in which each edge of the
graph is drawn as
a
straight line segment, as illustrated in Fig.
1.5.
A
straight line drawing is
a
special case of
a
polyline drawing, where edges
TEAM LinG - Live, Informative, Non-cost and Genuine !
6
Planar Graph Drawing
are drawn without bend.
Fig.
1.5
(a)
A
straight line drawing, and
(b)
a
convex drawing.
Wagner [Wag36], FBry [Far481 and Stein [Ste51] independently proved
that every planar graph has
a
straight line drawing. Many works have been
done on straight line drawings of planar graphs [DETT94].
1.3.4
Convex Drawing
A straight line drawing of
a
plane graph
G
is called
a
convex drawing
if
the
boundaries of all faces of
G are drawn as convex polygons, as illustrated in
Fig. 1.5(b). Although not every plane graph has
a
convex drawing, every
3-connected plane graph has such
a
drawing [TutGO]. Several algorithms
are known for finding
a
convex drawing of
a
plane graph [CK97, CON85,
CYN84, Kan961.
1.3.5
Orthogonal Drawing
An
orthogonal drawing
is
a
drawing of
a
plane graph in which each edge
is drawn as
a
chain of horizontal and vertical line segments, as illus-
trated in Fig. 1.6(a). Orthogonal drawings have attracted much attention
due to their numerous applications in circuit layouts, database diagrams,
entity-relationship diagrams, etc. Many results have been published in re-
cent years on both planar orthogonal drawings [Bie96a, Bie96b, Kan96,
RNN99, RNNO3, Sto84, Tam87, TTVSl] and non-planar orthogonal draw-
ings [BK98, PT95, PT971. An orthogonal drawing is called an
octagonal
drawing
if the outer cycle is drawn as
a
rectangle and each inner face is
drawn as
a
rectilinear polygon of
at
most eight corners [RMN04].
TEAM LinG - Live, Informative, Non-cost and Genuine !
Graph
Drawing
r
1.3.6
Box-Orthogonal
Drawing
Conventionally, each vertex in an orthogonal drawing is drawn as
a
point,
as illustrated in Fig. 1.6(a). Clearly
a
graph having
a
vertex
of
degree five
or
more has no orthogonal drawing, because
at
most
four
edges can be incident
to
a
vertex in an orthogonal drawing.
A
box-orthogonal drawing
of a graph
is
a
drawing such that each vertex is drawn as
a
(possibly degenerate)
rectangle, called
a
box,
and each edge is drawn
as
a
sequence
of
alternate
horizontal and vertical line segments, as illustrated in Fig. 1.6(b). Every
plane graph has a box-orthogonal drawing. Several results are known
for
box-orthogonal drawings [BK97, FKK97,
PTOO].
I
Fig.
1.6
drawing, and (d)
a
box-rectangular drawing.
(a) An orthogonal drawing, (b)
a
box-orthogonal drawing, (c)
a
rectangular
TEAM LinG - Live, Informative, Non-cost and Genuine !
8
Planar
Graph
Drawing
1.3.7
Rectangular Drawing
A
rectangular drawing
of
a
plane graph
G
is a drawing of
G
in which each
vertex is drawn as
a
point, each edge is drawn as
a
horizontal or vertical line
segment without edge-crossings, and each face is drawn as
a
rectangle, as
illustrated in Fig. 1.6(c). Not every plane graph has
a
rectangular drawing.
Thomassen [Tho841 and Rahman
et al.
[RNNO2] established necessary and
sufficient conditions for
a
plane graph of the maximum degree three to
have a rectangular drawing. Linear-time algorithms for finding rectangular
drawings of such plane graphs are also known [BS88, RNN98, RNNO21.
Recently Miura
et al.
reduced the problem of finding
a
rectangular drawing
of
a
plane graph
of
the maximum degree four to
a
perfect matching problem
[MHN04].
A
planar graph
G
is said to have
a
rectangular drawing if
at
least one of
the plane embeddings of
G
has
a
rectangular drawing. Recently Rahman
et al.
[RNG04] gave
a
linear time algorithm to examine whether
a
planar
graph of the maximum degree three has
a
rectangular drawing and to find
a
rectangular drawing if it exists.
1.3.8
Box-Rectangular Drawing
A
box-rectangular drawing
of
a
plane graph
G
is
a
drawing of
G
on the plane
such that each vertex is drawn as
a
(possibly degenerate) rectangle, called
a
box,
and the contour of each face is drawn as
a
rectangle,
as
illustrated in
Fig. 1.6(d). If
G
has multiple edges or
a
vertex of degree five or more, then
G
has no rectangular drawing but may have
a
box-rectangular drawing.
However, not every plane graph has
a
box-rectangular drawing. Rahman
et al.
[RNNOO] gave
a
necessary and sufficient condition for
a
plane graph
to have
a
box-rectangular drawing. Linear-time algorithms are also known
for finding
a
box-rectangular drawing of a plane graph if it exists [HeOl,
RNNOO].
1.3.9
Grid Drawing
A
drawing of
a
graph in which vertices and bends are located
at
grid points
of an integer grid as illustrated in Fig. 1.7 is called
a
grid drawing.
Grid
drawing approach overcomes the following problems in graph drawing with
real number arithmetic.
(i) When the embedding has to be drawn on
a
raster device, real vertex
TEAM LinG - Live, Informative, Non-cost and Genuine !
Graph
Drawing
9
~~
. .
.
.
.
.
. . . . . . . . . .
. . . . . . . . . . . . . . .
.
.
Fig.
1.7
(a)
A
straight line grid drawing, and
(b)
a
rectangular grid drawing.
coordinates have to be mapped to integer grid points, and there is no
guarantee that
a
correct embedding will be obtained after rounding.
(ii) Many vertices may be concentrated in
a
small region of the drawing.
Thus the embedding may be messy, and line intersections may not be
detected.
(iii) One cannot compare area requirement for two or more different draw-
ings using real number arithmetic, since any drawing can be fitted in
any small area using magnification.
The
size
of an integer grid required for
a
grid drawing is measured by
the size of the smallest rectangle on the grid which encloses the drawing.
The
width
W
of the grid is the width of the rectangle and the
height
H
of
the grid
is
the height
of
the rectangle. The grid size is usually described as
W
x
H.
The grid size is sometimes described by the
half perimeter
W
+
H
or the
area
W
.
H
of the grid.
It
is
a
very challenging problem to draw
a
plane graph on
a
grid of the
minimum size. In recent years, several works are devoted to this field
[CN98,
FPP90,
SchSO]; for example, every plane graph of
n
vertices has
a
straight
line grid drawing on
a
grid of size
W
x
H
5
(n
-
1)
x
(n
-
1).
1.3.10
Visibility
Drawing
A
visibility drawing
of
a
plane graph
G
is
a
drawing
of
G
where each vertex
is drawn as a horizontal line segment and each edge is drawn as
a
vertical
line segment. The vertical line segment representing an edge must connect
TEAM LinG - Live, Informative, Non-cost and Genuine !
10 Planar Graph Drawing
points on the horizontal line segments representing the end vertices [Kan97].
Figure 1.8(b) depicts
a
visibility drawing of the plane graph G in Fig.
1.8(a).
Fig.
1.8
of
G.
(a)
A
plane graph
G,
(b)
a
visibility drawing
of
G,
and
(c)
a
2-visibility drawing
A
%visibility drawing
is
a
generalization
of
a
visibility drawing where
vertices are drawn as boxes and edges are drawn as either
a
horizontal
line segment or
a
vertical line segment [FKK97]. Figure 1.8(c) depicts
a
2-visibility drawing of the plane graph G in Fig. 1.8(a).
1.4
Properties
of
Drawings
There are infinitely many drawings of
a
graph. When drawing
a
graph,
we would like to consider
a
variety of properties. For example, if
a
graph
corresponds to
a
VLSI circuit, then we may be interested in
a
planar orthog-
onal drawing of the graph such that the number of bends in the drawing
is as small as possible, because bends increase the manufacturing cost of
a
VLSI chip.
To
avoid wasting valuable space in the chip, it is important
to keep the area of the drawing small. Even if we are motivated to obtain
only
a
nice drawing, we cannot precisely define
a
nice drawing, and hence
we consider some properties of graph drawings [Bie97]. In this section we
introduce some properties of graph drawings which we generally consider.
Area.
A
drawing is useless if it is unreadable. If the used area of the
drawing is large, then we have to use many pages,
or
we must decrease
resolution,
so
either way the drawing becomes unreadable. Therefore
one major objective is to ensure
a
small area. Small drawing area is
also preferable in application domains like VLSI floorplanning.
TEAM LinG - Live, Informative, Non-cost and Genuine !