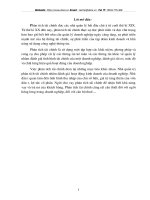
Phân tích tình hình tài chính Johnson & Johnson
Bạn đang xem bản rút gọn của tài liệu. Xem và tải ngay bản đầy đủ của tài liệu tại đây (1.32 MB, 10 trang )
DUC CHIEN NGO
Dear Flcircle,
I send you the file
Basic information to analysis the ratios:
No.
Criteria
(Dollars in Millions)
2009 2010 2011 2012 2013
1
Cash & Current
marketable securities
19,425 27,658 32,261 21,089 29,206
2 Inventory 6,285 7,495 7,878
3 Receivables 10,581 11,309 11,713
4 Fixed asset 14,739 16,097 16,710
5 Total asset 94,682 102,908 113,644 121,347 132,683
6 Short - term debt 6,658 4,676 4,852
7 Long - term debt 12,969 11,489 13,328
8 Total Debt 14,541 16,773 19,627 16,165 18,180
9 Shareholder’s equity 50,588 56,579 57,080 64,826 74,053
10 Net sales 61,897 61,587 65,030 67,224 71,312
11 Profit before tax 15,755 16,947 12,361 13,775 15,471
12 Profit after tax 12,266 13,334 9,672 10,853 13,831
13 ROA 13% 13% 8.5% 8.9% 10.4%
1. Liquidity Ratio:
No. Criteria 2009 2010 2011 2012 2013
1
Cash & Current
marketable securities
19,425 27,658 32,261 21,089 29,206
2 Inventory 6,285 7,495 7,878
3 Receivables 10,581 11,309 11,713
4 Short - term debt 6,658 4,676 4,852
5
= (1+2+3)/4
Current Liquidity
Ratio
7.38 8.53 10.06
6
= (1+3)/4
Quick Liquidity
Ratio
6.43 6.93 8.43
7
= 1/4
Cash Liquidity Ratio 4.85 4.51 6.02
Johnson & Johnson Page 1
DUC CHIEN NGO
Overall, all the Liquidity Ratio are increased, because the Cash & Current marketable securities,
Inventor and Receivables are increased from 2011 to 2013, While, the Short - term debt are
reduced.
Cash is increased about 50% from 2009 to 2013. Inventory is increased about 25.35% and
Receivables is increased about 10.70% from 2011 to 2013.
Opposed, the Short - term debt is reduced about 27.13% from 2011 to 2013.
So, all the Liquidity Ratio are increased from 2011 to 2013. And the Current Liquidity Ratio is
the most increased because it is the sum of Cash & Current marketable securities, Inventor and
Receivables divided Short - term debt.
2. Asset Ratio:
No.
Criteria
(Dollars in Millions)
2009 2010 2011 2012 2013
1 Fixed asset 14,739 16,097 16,710
2 Total asset 94,682 102,908 113,644 121,347 132,683
3 Total Debt 14,541 16,773 19,627 16,165 18,180
4 Net sales 61,897 61,587 65,030 67,224 71,312
5 Profit after tax 12,266 13,334 9,672 10,853 13,831
6
= 4/1
Sales – to – Fixed
Assets Ratio
22.66% 23.95% 23.43%
7
= 4/2
Sales – to – Total
Assets Ratio
152.97% 167.09% 174.76% 180.51% 186.06%
8 ROA 13% 13% 8.5% 8.9% 10.4%
9 Total debt/Total asset 15.36% 16.30% 17.27% 13.32% 13.70%
Johnson & Johnson Page 2
DUC CHIEN NGO
=3/2
All the Asset Ratio are increased, because the net sales is increased about 15.21% from 2009 to
2013.
The Fixed asset have increased more slightly than the net sales, so Sales – to – Fixed Assets
Ratio is increased about 3.4% from 2011 to 2013.
But, the Total debt/Total asset is reduced about 10.81% from 2009 to 2013 because the Total
asset is increased about 40.14% and the Total Debt is only increased about 25.03% from 2009 to
2013.
Specially, the ROA is reduced about 34.62% from 2009 to 2011 but it is increased about 22.35%
from 2011 to 2013. Because, in the period from 2009 to 2011, the Profit after tax is reduced
about 21.15% and the Total asset is increased about 20.03%. While, in the period from 2011 to
2013, the Profit after tax is increased about 43.0% and the Total asset is increased more slightly
than the Profit after tax, it is increased about 16.75%.
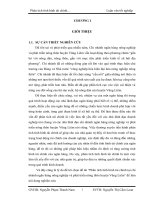
2.1. Sales – to – Fixed Assets Ratio (2011 – 2013):
2.2. Sales – to – Total Assets Ratio (2009 – 2013):
2.3. ROA (2009 – 2013):
Johnson & Johnson Page 3
DUC CHIEN NGO
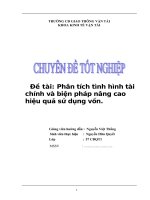
2.4. Total debt/Total asset (2009 – 2013):
3. Other:
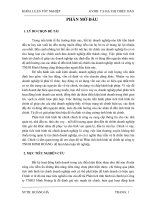
3.1. Asset:
No.
Criteria
(Dollars in Millions)
2011 2012 2013
1 Current asset 54,316 46,116 56,407
2 Property, plant & equipment, net 14,739 16,097 16,710
3 Intangible assets, net & Goodwill 34,276 51,176 50,745
4 Other non-current assets 10,313 7,958 8,821
5 Total asset 113,644 121,347 132,683
In 2011, the Current asset has the highest value of total assets.
But, in 2012, the Intangible assets, net & Goodwill is increased, it become the highest value
of total assets.
And, in 2013, the Current asset and the Intangible assets, net & Goodwill are the main
component in total assets.
Total assets have increased from 2011 to 2013, due to the composition of the assets have
increased
Chart 1
Johnson & Johnson Page 4
DUC CHIEN NGO
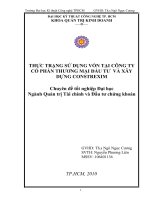
Chart 2
Total Asset (2009 – 2013)
No.
Criteria
(Dollars in Millions)
2009 2010 2011 2012 2013
1 Total asset 94,682 102,908 113,644 121,347 132,683
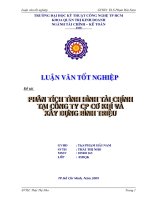
Assets (Percent) (2011 -2013)
Johnson & Johnson Page 5
DUC CHIEN NGO
No. Criteria (%) 2011 2012 2013
1 Current asset 47.79% 38.00% 42.51%
2 Property, plant & equipment, net 12.97% 13.27% 12.59%
3 Intangible assets, net & Goodwill 30.16% 42.17% 38.25%
4 Other non-current assets 9.07% 6.56% 6.65%
5 Total asset 100% 100% 100%
Assets (Percent) – 2011
Assets (Percent) – 2012
Assets (Percent) – 2013
Johnson & Johnson Page 6
DUC CHIEN NGO
In 2011, the Current asset has the highest value of total assets, it accounts for about 47.79%
But, in 2012, the Intangible assets, net & Goodwill is increased, it become the highest value
of total assets, it accounts for about 42.17%
And, in 2013, the Current asset and the Intangible assets, net & Goodwill are the main
component in total assets. They account for about 80.76%
3.2. Capital structure (2009 – 2013):
No.
Criteria
(Dollars in Millions)
2009 2010 2011 2012 2013
1 Total debt 14,541 16,773 19,627 16,165 18,180
2 Equity 50,588 56,579 57,080 64,826 74,053
3
= 1 + 2
Total capital 65,129 73,352 76,707 80,991 92,233
2
= 1/3
Total debt/Total
capital (%)
22.3% 22.9% 25.6% 20.0% 19.7%
5
= 2/3
Equity/Total capital
(%)
77.7% 77.1% 74.4% 80.0% 80.3%
Chart 1
Johnson & Johnson Page 7
DUC CHIEN NGO
Chart 2
Capital (Percent) – 2009
Capital (Percent) – 2010
Johnson & Johnson Page 8
DUC CHIEN NGO
Capital (Percent) – 2011
Capital (Percent) – 2012
Johnson & Johnson Page 9
DUC CHIEN NGO
Capital (Percent) – 2013
Johnson & Johnson Page 10