Forex Trend line Strategy (chiến lược đường xu hướng trong Forex)
Bạn đang xem bản rút gọn của tài liệu. Xem và tải ngay bản đầy đủ của tài liệu tại đây (4.36 MB, 82 trang )
ForexTrendLineStrategy.com
All rights reserved. No part of this publication may be reproduced, stored in a retrieval
system, or transmitted, in any form or by any means, electronic, mechanical, photocopying,
recording or otherwise, without the permission of Kelvin Lee.
Copyright © 2010 by Kelvin Lee
Disclaimer
No income guarantees or promises of any type are being made. Your results will vary due to
circumstances that are outside of our control. While utmost care has been taken to endure
that all information provided has been tested up to the time of writing, all websites, products
and services mentioned are provided, as is, without warranty of any kind. The author does
not warrant, guarantee or make any representations about the use or results of the use of the
websites, product, services or resources in this book. The reader acknowledges that the
content provided here is for informational purposes and that risk of business failure is based
on the strategies and plans devised and executed by the readers themselves. The entire risk
as to the results and performance of these websites, product and services are assumed by
the reader. The reader thus agrees that the author and publisher are not responsible for the
success or failure of readers’ business decisions relating to any information provided.
This covers all information in this book, and no further information provided within this book
or through correspondence with the author or publisher on any platform is intended to
supersede this disclaimer
Copyright © Kelvin Lee
2
ForexTrendLineStrategy.com
There is a free lifetime update for
this book whenever there is a
new revision of this book.
Please spend 5 minutes of your time
to sign up for this
update here.
Copyright © Kelvin Lee
3
ForexTrendLineStrategy.com
Introduction
Trend line forms the foundation to a good technical analysis. The purpose of drawing trend
line is to show you areas of support and resistance where the bulls and bears fought with
each other. With this information, you can better decide whether you should buy or sell a
currency pair. Being a technical trader, you must definitely know how to draw a proper trend
line that can help you in your trading. Similarly drawing an incorrect trend line can prove to
be a disaster for your trading as well.
Some of you may find trend line drawing too basic to learn but it is usually things that appear
to be basic which cause you your hard earn money. Most people thought that trend line is all
about connecting various swing highs or swing lows. In fact, there are a lot of ways you can
make use of trend line in your trading and this is exactly what you are going to learn in this
book.
It took me years of trading and learning to know there are so many ways you can trade with
trend lines and you are going to have this valuable information within the next few hours of
reading. First of all let me ask you the following questions:
Have you ever experienced this before?
• You enter a trade after a trend line break but the price suddenly reverses after a few
candles
Copyright © Kelvin Lee
4
ForexTrendLineStrategy.com
• You enter a trade after seeing trend line break but the price did not move to your
target profit and then reverse to take back all your profit
If you ever have any one of the above experiences, it is usually due to your problem with
drawing trend lines and your ability to do proper price projection.
In this book, I will be going through with you the following
Section 1: Trend Line Analysis
• How To Draw Conventional Trend Line
• Rules For Drawing Conventional Trend Lines
• Types of Conventional Trend Lines
• How To Draw Tom Demark Trend Line
• How To Determine The Strength of Your Trend Line
• How To Verify a Valid Trend Line Break
• How To Do Proper Price Projection
Copyright © Kelvin Lee
5
ForexTrendLineStrategy.com
Section 2: Trend Line Trading System
• How To Trade Using Multiple Trend Lines
• How To Trade Support Turn Resistance
Section 3: Trading Examples
• EUR/USD Currency Pair
• GBP/USD Currency Pair
With the following knowledge, you will be able to draw the best trend line and then trade
profitably with it.
Copyright © Kelvin Lee
6
ForexTrendLineStrategy.com
Section 1
Trend Line Analysis
Copyright © Kelvin Lee
7
ForexTrendLineStrategy.com
1.1 What are Trend Lines?
A trend line represents a supply and demand among traders. According to Wikipedia, A trend
line is a bounding line for the price movement of a security.
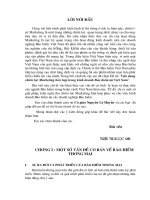
A support trend line is drawn by connecting several swing lows and a resistance trend line is
drawn by connecting several swing highs.
Example of Support Trend Line:
A resistance trend line is drawn by connecting several swing highs
Example of Resistance Trend Line:
Copyright © Kelvin Lee
8
ForexTrendLineStrategy.com
So first of all, let me go through with you how to locate a swing high and swing low before we
start to draw a trend line.
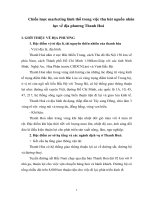
Swing high is basically an N-shaped formation with several candles on the left and right side
of a single high candle.
Swing low is basically a V-shaped formation with several candles on the left and right side of
a single low candle.
Copyright © Kelvin Lee
9
ForexTrendLineStrategy.com
However we are not interested in all swing highs and lows when drawing a trend line, we are
only looking out for those that have more weightage as this will produce trend line that is
more significant. Below is the level of weightage for each formation
Once you have identified all the medium to big swing highs or lows, you can start to plot your
trend line. There are 2 types of trend lines you can draw and we will be going through all of
them in this book. They are
- Conventional Trend Line
- Tom Demark Trend Line
You need to have a good knowledge of these 2 different trend line drawing methods as you
will need to combine them to have a better trading experience.
Copyright © Kelvin Lee
10
ForexTrendLineStrategy.com
1.1.1 Conventional Trend Line
A conventional trend line is also known as a common sense trend line. The conventional
trend line consists of 3 types of lines mainly
- Long Term Trend Line (BLACK)
The long term trend line is drawn over a longer period of time. Due to the higher weightage of
each swing high or low, the long term trend line will usually have more power than the
medium and short term trend line. This means that the price will most probably bounce off
the long term trend line for the first few times before it can break through it.
- Medium Term Trend Line
(BLUE)
Copyright © Kelvin Lee
11
ForexTrendLineStrategy.com
The medium term trend line is simply part of the long term trend line. From the last point of
contact of the long term trend line with the price, you can draw a medium term trend line. As
compared with the long term trend line, the medium term trend line passes through lesser
candles and thus has lesser weightage.
- Short Term Trend Line
(RED)
The short term trend line is the most recent trend line and you will be using it to trade most of
the time.
Some of you may think that the long term trend line must be drawn from a higher time frame
and short term trend line is drawn on a lower time frame. In fact, all the long to short term
trend lines are drawn on the same chart.
Copyright © Kelvin Lee
12
ForexTrendLineStrategy.com
The difference between the various types of trend lines lies in the number of candlesticks or
period that the line passes through. For long term trend line, it has to be drawn over a longer
period of time while the short term trend line is usually drawn over a shorter period of time.
As for the period to draw, there is no specific guideline you should follow.
Rules for Conventional Trend Line
̈ The Best Trend Line Is One That Connects The Most Swing Highs or Lows
̈ Once The Support Trend Line Is Broken, It Will Turn Into Resistance Trend Line
̈ Once The Resistance Trend Line Is Broken, It Will Turn Into Support Trend Line
Steps to Drawing Your 3 Types of Conventional Trend Line
Step 1: Shrink your selected time frame to a smaller size until you see the start of your current trend.
If the currency pair you are trading is currently in an up trend, you simply have to shrink your chart
until you can see the beginning of the up trend.
Example: (EURJPY 15 Minutes Chart)
Copyright © Kelvin Lee
13
ForexTrendLineStrategy.com
Step 2: If you are in a down trend, look for major swing highs and if you are in an up trend, you should
look at the major swing lows. (To draw a strong trend line, you need to have at least 3 points of
contacts which means that you need at least 3 swing highs or lows)
Step 3: Connect at least 3 swing highs or swing lows to form your long term trend line
Copyright © Kelvin Lee
14
ForexTrendLineStrategy.com
Step 4: Expand your selected time frame and look for major swing high or low after the last point of
contact for the long term trend line.
Step 5: Connect those swing highs and lows that you have found in step 4 and you will get your
medium term trend line
Copyright © Kelvin Lee
15
ForexTrendLineStrategy.com
Step 6: Look at your recent candlesticks and draw the necessary trend line and that will be your short
term trend line
Copyright © Kelvin Lee
16
ForexTrendLineStrategy.com
1.1.2 Tom Demark
TM
Trend Line
The Tom Demark
TM
trend line is in fact created by a professional trader name Tom Demark.
He has written a book to talk about it and you can find it at the last page of this book. When
he is trading, he used to communicate with his partner through the phone and every time
when they talk about trend line; he finds it very hard for them to be talking about the same
trend line as the conventional trend line is very subjective. Every trader can draw different
conventional trend line as everyone of us sees thing in a different way.
Therefore he tries to study ways to draw trend line that does not depend on the individual
point of view and he came out with Tom Demark
TM
(TD) trend line. It is a very dynamic trend
line as it will change with the market movement and this gives the trader the most recent line
to trade with.
Compared to the conventional trend lines, this TD
TM
trend line is more systematic and not
based on common sense or personal judgement.
Steps to Drawing Your TD
TM
Trend Line:
Step 1: Pick 2 most recent swing highs or lows (For TD
TM
trend line, the swing high and low needs
not be major. It is simply the most recent swing highs and lows)
Copyright © Kelvin Lee
17
ForexTrendLineStrategy.com
Step 2: Connect them and you will have your most recent TD
TM
trend line
As more new candles are formed, the TD
TM
trend line will change and you have to constantly
follow up to get the best result.
More Examples on TD
TM
Trend Line
Copyright © Kelvin Lee
18
ForexTrendLineStrategy.com
New Swing Low
With the Tom Demark
TM
trend line, it’s time to combine it with the Conventional trend line to
get better result. The TD
TM
trend line is only used to draw the short term trend line but the
way to draw the medium and long term ones stay the same. Do note that the TD
TM
trend line
will constantly change as new swing high or low is being formed. Although it is pretty tedious
to have constantly draw new trend line, it can give you the best and most recent trend line to
trade with.
Copyright © Kelvin Lee
19
ForexTrendLineStrategy.com
1.2 How to Determine The Strength of Your Trend Lines?
Knowing the strength of the trend line that you have drawn can be beneficial to your trading.
If the trend line that you have drawn is strong, there is a high chance that the market will
respect it and get repelled by it when it touches the line.
Drawing trend lines that are insignificance is equivalent to not drawing any trend line. You will
find that the price usually does not respect these levels and therefore it cannot be used to
help you in your trade.
Below is how you can determine the strength of the trend line
Number of times the trend line has been touched The strength of the trend line
The more time the trend line has been tested by the price, the stronger is the line and the
more likely it will be able to hold!
Example: (Strong Trend Line)
Copyright © Kelvin Lee
20
ForexTrendLineStrategy.com
The strong trend lines are usually used as exit or entry position. Most traders enter a trade
when the price successfully breaks through the strong trend line (Do take note of fake out
which is very common in trading, I will go through with you in the later section of the book on
how you can minimise the impact of fake out to your trading account) and exit their position
when the price hits the strong trend line.
Example of Fake out:
In both of the examples, you can see the price breaking
out of the trend line making you think that the breakout
has occurred.
After a few candles later, the price reverses and stops
you out.
Example of Fake out:
Copyright © Kelvin Lee
21
ForexTrendLineStrategy.com
1.3 How to Confirm a Trend Line Break
The best way you can validate a breakout of trend line is through the use of MACD indicator.
The MACD indicator is made up of a MACD line, a Trigger line and a histogram that shows
the difference between these 2 lines. For the confirmation of trend line, you simply have to
make use of the default MACD setting in your trading platform and you can adjust the
sensitivity to suit your trading style.
In order to validate a breakout, you must make use of the histogram of this indicator. When
you see the price breaking below a trend line, you should check your MACD to see if the
histogram flips to the downside. If it did not, this is usually an indication that the breakout is a
fake out and you should refrain from entering a trade. If the breakout is validated by the
MACD flipping to the other side, you can then enter a trade. Do not rush into a trade when
you see the histogram flips to the other side and you should always wait for the second bar
to be formed on the MACD before confirming the flip over. There are times where the
histogram may flip to the other side but eventually flip back up in the end invalidating your
breakout.
Example of Validated Breakout: (GBPJPY 30 Minutes Chart)
Copyright © Kelvin Lee
22
ForexTrendLineStrategy.com
After the trend line break has been validated, the price moves back to retest the support
trend line and then moves up.
Example of Validated Breakout: (GBPJPY 30 Minutes Chart)
Copyright (c)
Example of Real Breakout:
Breakout Confirmed By MACD
Histogram Flip Over
Copyright © Kelvin Lee
23
ForexTrendLineStrategy.com
Example of Fake out Captured by MACD: (GBPJPY 30 Minutes Chart)
You can also apply this technique to triangle breakout or any other breakout strategy. Fake
out is sometime that is very common in trading and you must definitely try to minimise your
losses due to it. Although this method is able to help you minimise your losses due to fake
out, it is not possible to be accurate 100% of the time. There is nothing 100% about trading
and you simply have to accept losses as part of the game.
Copyright © Kelvin Lee
24
ForexTrendLineStrategy.com
1.4 How to Do Proper Price Projection
Now that you know how to draw conventional trend line and Tom Demark
TM
trend line, you
are now able to plan your entry using the trend line. However a trading plan is never
complete without a properly planned exit strategy, you can have the best entry technique but
you will continue to struggle in your trading if you do not know when the best time to exit your
strategy is.
From the moment you enter a position until you exit it, it is a complete cycle and you have to
make sure that you have it all plan out if you want to win most of your trades. The main
reason why most traders are losing despite them having a good strategy is because of their
lousy exit plan. This is one section that most traders tend to neglect and this is what we are
going to talk about in this section of the book.
The beauty of trend line is that it allows you to do some price projection which can help you
to know when you should exit your position. There are a total of 2 price projection techniques
that I will go through here so that you can make full use of all of them to perfect your trading
plan.
First of all, let us go through the price projection technique that I always use for trend line
break trading.
Here are the steps:
Step 1: Draw a TD
TM
trend line
Step 2: For a downward breakout, you should project a vertical line from the top of the highest candle
within the trend line to the trend line. For an upward breakout, you should project a vertical line from
the bottom of the lowest candle within the trend line to the trend line.
Step 3: From the point of breakout, place the line you have projected on Step 2 to see the projected
movement of the price.
Copyright © Kelvin Lee
25