applied quantitative methods for trading and investment- dunis 2003
Bạn đang xem bản rút gọn của tài liệu. Xem và tải ngay bản đầy đủ của tài liệu tại đây (8.81 MB, 432 trang )
Applied Quantitative Methods
for Trading and Investment
Applied Quantitative Methods for Trading and Investment. Edited by C.L. Dunis, J. Laws and P. Na
¨
ım
2003 John Wiley & Sons, Ltd ISBN: 0-470-84885-5
Wiley Finance Series
Applied Quantitative Methods for Trading and Investment
Christian L. Dunis, Jason Laws and Patrick Na
¨
ım
Country Risk Assessment: A Guide to Global Investment Strategy
Michel Henry Bouchet, Ephraim Clark and Bertrand Groslambert
Credit Derivatives Pricing Models: Models, Pricing and Implementation
Philipp J. Sch
¨
onbucher
Hedge Funds: A resource for investors
Simone Borla
The Simple Rules: Revisiting the art of financial risk management
Erik Banks
Option Theory
Peter James
Risk-adjusted Lending Conditions
Werner Rosenberger
Measuring Market Risk
Kevin Dowd
An Introduction to Market Risk Management
Kevin Dowd
Behavioural Finance
James Montier
Asset Management: Equities Demystified
Shanta Acharya
An Introduction to Capital Markets: Products, Strategies, Participants
Andrew M. Chisholm
Hedge Funds: Myths and Limits
Francois-Serge Lhabitant
The Manager’s Concise Guide to Risk
Jihad S. Nader
Securities Operations: A guide to trade and position management
Michael Simmons
Modeling, Measuring and Hedging Operational Risk
Marcelo Cruz
Monte Carlo Methods in Finance
Peter J
¨
ackel
Building and Using Dynamic Interest Rate Models
Ken Kortanek and Vladimir Medvedev
Structured Equity Derivatives: The Definitive Guide to Exotic Options and Structured Notes
Harry Kat
Advanced Modelling in Finance Using Excel and VBA
Mary Jackson and Mike Staunton
Operational Risk: Measurement and Modelling
Jack King
Interest Rate Modelling
Jessica James and Nick Webber
Applied Quantitative Methods
for Trading and Investment
Edited by
Christian L. Dunis
Jason Laws
and
Patrick Na
¨
ım
Copyright 2003 John Wiley & Sons Ltd, The Atrium, Southern Gate, Chichester,
West Sussex PO19 8SQ, England
Telephone (+44) 1243 779777
Email (for orders and customer service enquiries):
Visit our Home Page on www.wileyeurope.com or www.wiley.com
All Rights Reserved. No part of this publication may be reproduced, stored in a retrieval system or
transmitted in any form or by any means, electronic, mechanical, photocopying, recording, scanning or
otherwise, except under the terms of the Copyright, Designs and Patents Act 1988 or under the terms of a
licence issued by the Copyright Licensing Agency Ltd, 90 Tottenham Court Road, London W1T 4LP, UK,
without the permission in writing of the Publisher. Requests to the Publisher should be addressed to the
Permissions Department, John Wiley & Sons Ltd, The Atrium, Southern Gate, Chichester, West Sussex PO19
8SQ, England, or emailed to , or faxed to (+44) 1243 770620.
This publication is designed to provide accurate and authoritative information in regard to the subject matter
covered. It is sold on the understanding that the Publisher is not engaged in rendering professional services. If
professional advice or other expert assistance is required, the services of a competent professional should be
sought.
Other Wiley Editorial Offices
John Wiley & Sons Inc., 111 River Street, Hoboken, NJ 07030, USA
Jossey-Bass, 989 Market Street, San Francisco, CA 94103-1741, USA
Wiley-VCH Verlag GmbH, Boschstr. 12, D-69469 Weinheim, Germany
John Wiley & Sons Australia Ltd, 33 Park Road, Milton, Queensland 4064, Australia
John Wiley & Sons (Asia) Pte Ltd, 2 Clementi Loop #02-01, Jin Xing Distripark, Singapore 129809
John Wiley & Sons Canada Ltd, 22 Worcester Road, Etobicoke, Ontario, Canada M9W 1L1
Wiley also publishes its books in a variety of electronic formats. Some content that appears
in print may not be available in electronic books.
Library of Congress Cataloging-in-Publication Data
Applied quantitative methods for trading and investment / edited by Christian Dunis, Jason
Laws, and Patrick Na
¨
ım
p. cm. — (Wiley finance series)
Includes bibliographical references and index.
ISBN 0-470-84885-5 (cased : alk. paper)
1. Finance—Mathematical models. 2. Investments—Mathematical models. 3.
Speculation—Mathematical models. I. Dunis, Christian. II. Laws, Jason. III. Na
¨
ım,
Patrick. IV. Series
HG106.A67 2003
332.6
01
5195—dc21
2003049721
British Library Cataloguing in Publication Data
A catalogue record for this book is available from the British Library
ISBN 0-470-84885-5
Typeset in 10/12pt Times by Laserwords Private Limited, Chennai, India
Printed and bound in Great Britain by TJ International, Padstow, Cornwall
This book is printed on acid-free paper responsibly manufactured from sustainable forestry
in which at least two trees are planted for each one used for paper production.
Contents
About the Contributors xi
Preface xv
1 Applications of Advanced Regression Analysis for Trading and
Investment 1
Christian L. Dunis and Mark Williams
Abstract 1
1.1 Introduction 1
1.2 Literature review 3
1.3 The exchange rate and related financial data 4
1.4 Benchmark models: theory and methodology 10
1.5 Neural network models: theory and methodology 20
1.6 Forecasting accuracy and trading simulation 31
1.7 Concluding remarks 36
References 39
2 Using Cointegration to Hedge and Trade International Equities 41
A. Neil Burgess
Abstract 41
2.1 Introduction 41
2.2 Time series modelling and cointegration 42
2.3 Implicit hedging of unknown common risk factors 45
2.4 Relative value and statistical arbitrage 47
2.5 Illustration of cointegration in a controlled simulation 50
2.6 Application to international equities 54
2.7 Discussion and conclusions 66
References 68
vi Contents
3 Modelling the Term Structure of Interest Rates: An Application
of Gaussian Affine Models to the German Yield Curve 71
Nuno Cassola and Jorge Barros Lu´ıs
Abstract 71
3.1 Introduction 71
3.2 Background issues on asset pricing 77
3.3 Duffie–Kan affine models of the term structure 78
3.4 A forward rate test of the expectations theory 83
3.5 Identification 84
3.6 Econometric methodology and applications 87
3.7 Estimation results 106
3.8 Conclusions 126
References 126
4 Forecasting and Trading Currency Volatility: An Application of
Recurrent Neural Regression and Model Combination 129
Christian L. Dunis and Xuehuan Huang
Abstract 129
4.1 Introduction 129
4.2 The exchange rate and volatility data 132
4.3 The GARCH (1,1) benchmark volatility forecasts 135
4.4 The neural network volatility forecasts 137
4.5 Model combinations and forecasting accuracy 142
4.6 Foreign exchange volatility trading models 145
4.7 Concluding remarks and further work 149
Acknowledgements 150
Appendix A 150
Appendix B 152
Appendix C 155
Appendix D 156
Appendix E 157
Appendix F 158
Appendix G 159
References 160
5 Implementing Neural Networks, Classification Trees, and Rule
Induction Classification Techniques: An Application to Credit
Risk 163
George T. Albanis
Abstract 163
5.1 Introduction 163
5.2 Data description 165
5.3 Neural networks for classification in Excel 166
5.4 Classification tree in Excel 172
Contents vii
5.5 See5 classifier 178
5.6 Conclusions 191
References 191
6 Switching Regime Volatility: An Empirical Evaluation 193
Bruno B. Roche and Michael Rockinger
Abstract 193
6.1 Introduction 193
6.2 The model 194
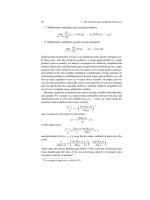
6.3 Maximum likelihood estimation 195
6.4 An application to foreign exchange rates 197
6.5 Conclusion 206
References 206
Appendix A: Gauss code for maximum likelihood for variance
switching models 208
7 Quantitative Equity Investment Management with Time-Varying
Factor Sensitivities 213
Yves Bentz
Abstract 213
7.1 Introduction 213
7.2 Factor sensitivities defined 215
7.3 OLS to estimate factor sensitivities: a simple, popular but
inaccurate method 216
7.4 WLS to estimate factor sensitivities: a better but still
sub-optimal method 222
7.5 The stochastic parameter regression model and the Kalman
filter: the best way to estimate factor sensitivities 223
7.6 Conclusion 236
References 237
8 Stochastic Volatility Models: A Survey with Applications to
Option Pricing and Value at Risk 239
Monica Billio and Domenico Sartore
Abstract 239
8.1 Introduction 239
8.2 Models of changing volatility 244
8.3 Stochastic volatility models 246
8.4 Estimation 250
8.5 Extensions of SV models 261
8.6 Multivariate models 263
8.7 Empirical applications 265
8.8 Concluding remarks 284
Appendix A: Application of the pentanomial model 284
viii Contents
Appendix B: Application to Value at Risk 286
References 286
9 Portfolio Analysis Using Excel 293
Jason Laws
Abstract 293
9.1 Introduction 293
9.2 The simple Markovitz model 294
9.3 The matrix approach to portfolio risk 301
9.4 Matrix algebra in Excel when the number of assets increases 303
9.5 Alternative optimisation targets 308
9.6 Conclusion 310
Bibliography 311
10 Applied Volatility and Correlation Modelling Using Excel 313
Fr´ed´erick Bourgoin
Abstract 313
10.1 Introduction 313
10.2 The Basics 314
10.3 Univariate models 315
10.4 Multivariate models 324
10.5 Conclusion 331
References 332
11 Optimal Allocation of Trend-Following Rules: An Application
Case of Theoretical Results 333
Pierre Lequeux
Abstract 333
11.1 Introduction 333
11.2 Data 333
11.3 Moving averages and their statistical properties 335
11.4 Trading rule equivalence 336
11.5 Expected transactions cost under assumption of random walk 338
11.6 Theoretical correlation of linear forecasters 340
11.7 Expected volatility of MA 341
11.8 Expected return of linear forecasters 342
11.9 An applied example 344
11.10 Final remarks 346
References 347
12 Portfolio Management and Information from Over-the-Counter
Currency Options 349
Jorge Barros Lu´ıs
Abstract 349
12.1 Introduction 349
Contents ix
12.2 The valuation of currency options spreads 353
12.3 RND estimation using option spreads 355
12.4 Measures of correlation and option prices 359
12.5 Indicators of credibility of an exchange rate band 361
12.6 Empirical applications 365
12.7 Conclusions 378
References 379
13 Filling Analysis for Missing Data: An Application to Weather
Risk Management 381
Christian L. Dunis and Vassilios Karalis
Abstract 381
13.1 Introduction 381
13.2 Weather data and weather derivatives 383
13.3 Alternative filling methods for missing data 385
13.4 Empirical results 393
13.5 Concluding remarks 395
Appendix A 396
Appendix B 397
References 398
Index 401
About the Contributors
George T. Albanis is currently working at Hypovereinsbank – HVB Group. He obtained
his PhD from City University Business School, London and holds a BSc in Economics
from the University of Piraeus, Greece and Master’s degrees in Business Finance and
in Decision Modelling and Information Systems from Brunel University, London. An
experienced programmer, his interests are applications of advanced nonlinear techniques
for financial prediction in fixed income and credit derivatives markets, and quantification
of risk in financial modelling.
Yves Bentz is Vice President with Cr
´
edit Suisse First Boston, specialising in high fre-
quency equity trading strategies and statistical arbitrage. He was previously a quantitative
trader with Morgan Stanley and with Beaghton Capital Management in London where he
developed automated equity and derivatives trading strategies. Yves holds a PhD from
the University of London (London Business School). He has published several research
papers on factor modelling and nonlinear modelling, in particular stochastic parameter
models and nonparametric statistics and their applications to investment management.
Monica Billio is Associate Professor of Econometrics at Universit
`
a Ca’ Foscari of Venice.
She graduated in Economics at Universit
`
a Ca’ Foscari di Venezia and holds a PhD degree
in Applied Mathematics from the Universit
´
e Paris IX Dauphine. Her fields of interest are
simulation-based methods and the econometrics of finance.
Fr
´
ed
´
erick Bourgoin is an Associate Portfolio Manager in the Active Fixed Income Port-
folio Management Team at Barclays Global Investors in London where he is involved
in the development of the active bond and currency strategies, as well as the risk man-
agement systems. Prior to joining BGI, he was a risk manager and quantitative analyst
at Portman Asset Management. Fr
´
ed
´
erick holds a Post-Graduate Degree in Finance from
ESSEC Business School and an MSc in Econometrics and Mathematical Economics from
Panth
´
eon-Sorbonne University in Paris.
Neil Burgess is a Vice President in the Institutional Equity Division at Morgan Stanley
where he works in the area of quantitative programme trading, leading and coordinating
new developments in trading systems and strategies for equities and equity derivatives
between Europe and the USA. He obtained his PhD from London University. He has
published widely in the field of emerging computational techniques and has acted as a
xii About the Contributors
programme committee member for international conferences: Forecasting Financial Mar-
kets, Computational Finance and Intelligent Data Engineering and Learning.
Nuno Cassola holds a PhD in Economics from the University of Kent at Canterbury. He
worked as an Associate Professor at the Technical University of Lisbon from 1992 until
1994. He then joined the Research Department of the Banco de Portugal in 1994 where
he became Head of the Monetary and Financial Division in 1996. In 1999 he joined the
European Central Bank in Frankfurt where he is currently Principal Economist in the
Monetary Policy Stance Division of the Monetary Policy Directorate.
Christian L. Dunis is Girobank Professor of Banking and Finance at Liverpool Business
School, and Director of its Centre for International Banking, Economics and Finance
(CIBEF). He is also a consultant to asset management firms, a Visiting Professor of Inter-
national Finance at Venice International University and an Official Reviewer attached to
the European Commission for the Evaluation of Applications to Finance of Emerging
Software Technologies. He is an Editor of the European Journal of Finance and has pub-
lished widely in the field of financial markets analysis and forecasting. He has organised
the Forecasting Financial Markets Conference since 1994.
Xuehuan Huang graduated from Liverpool Business School with an MSc in International
Banking and Finance and from China’s Shenzen University with a BA in Business Man-
agement. After working as an auditor with Ernst & Young, she is currently a financial
analyst at Bayer DS European headquarters.
Vassilios Karalis is an Associate Researcher at the Centre for International Banking,
Economics and Finance of Liverpool Business School (CIBEF). Vassilios holds an MSc
in International Banking and Finance from Liverpool Business School and a BSc in
Mathematics with specialisation in probabilities, statistics and operational research from
the University of Ioannina, Hellas.
Jason Laws is a Lecturer in International Banking and Finance at Liverpool John
Moores University. He is also the Course Director for the MSc in International Banking,
Economics and Finance at Liverpool Business School. He has taught extensively in the
area of investment theory and derivative securities at all levels, both in the UK and in
Asia. Jason is also an active member of CIBEF and has published in a number of academic
journals. His research interests are focused on volatility modelling and the implementation
of trading strategies.
Pierre Lequeux joined the Global Fixed Income division of ABN AMRO Asset Man-
agement London in 1999. As Head of Currency Management, he has responsibility for
the quantitative and fundamental currency investment process. He was previously Head
of the Quantitative Research and Trading desk at Banque Nationale de Paris, London
branch, which he joined in 1987. Pierre is also an Associate Researcher at the Centre for
International Banking, Economics and Finance of Liverpool Business School (CIBEF)
and a member of the editorial board of Derivatives Use, Trading & Regulation.
Jorge Barros Lu
´
ıs is Head of Credit Risk Modelling with Banco Portugu
ˆ
es de Investi-
mento. Previous positions include Economist at the European Central Bank and Banco de
Portugal, Chief-Economist at Banif Investimento and Adviser to the Minister of Finance
and to the Secretary of State for the Treasury of the Portuguese Government. Jorge holds
About the Contributors xiii
a PhD in Economics from the University of York and has published several papers on
yield curve modelling and information extraction from option prices.
Patrick Na
¨
ım is an engineer of the Ecole Centrale de Paris. He is the founder and
chairman of Elseware, a company specialised in the application of nonlinear methods to
financial management problems. He is currently working for some of the largest French
institutions and coordinating research projects in the field at a European level.
Bruno B. Roche is Head of Research in the Global Management Research group of a
major multinational company where he leads a specialist team whose role is to provide
world class expertise, methodologies, technologies and knowledge management in mul-
tiple areas which have a global critical impact (e.g. financial markets, risk management
and advertising effectiveness). He is also a Researcher at the Solvay Business School at
the University of Brussels.
Michael Rockinger is Professor of Finance at the HEC School of Business of the Univer-
sity of Lausanne. He has been scientific consultant at the French Central Bank for many
years. He is also affiliated with CEPR and FAME. Previously, Michael taught Finance at
all levels at HEC-Paris. His research interests are various, one of them is the modelling
of asset prices. Michael earned his PhD in Economics at Harvard University. He is also
a graduate in Mathematics from the Swiss Federal Institute of Technology (EPFL) and
holder of a Master’s degree from the University of Lausanne.
Domenico Sartore is Full Professor of Econometrics at Universit
`
a Ca’ Foscari di Venezia.
Previously he taught at the University of Milan and the University of Padua. At present,
he is President of the economics and finance consultancy GRETA (Gruppi di Ricerca
Economica Teorica ed Applicata) in Venice. His field of interest is the econometrics of
finance, where he has published many papers.
Mark Williams is an Associate Researcher at the Centre for International Banking,
Economics and Finance of Liverpool Business School (CIBEF). Mark holds an MSc
in International Banking and Finance from Liverpool Business School and a BSc in
Economics from Manchester Metropolitan University.
Preface
Applied Quantitative Methods for Trading and Investment is intended as a quantitative
finance textbook very much geared towards applied quantitative financial analysis, with
detailed empirical examples, software applications, screen dumps, etc. Examples on the
accompanying CD-Rom detail the data, software and techniques used, so that contrary to
what frequently happens with most textbook examples, they clarify the analysis by being
reasonably easily reproducible by the reader.
We expect this book to have a wide spectrum of uses and be adopted by financial
market practitioners and in universities. For the former readership, it will be of interest
to quantitative researchers involved in investment and/or risk management, to fund man-
agers and quantitative proprietary traders, and also to sophisticated private investors who
will learn how to use techniques generally employed by market professionals in large
institutions to manage their own money. For the latter, it will be relevant for students
on MSc, MBA and PhD programmes in Finance where a quantitative techniques unit is
part of the course, and to students in scientific disciplines wishing to work in the field of
quantitative finance.
Despite the large number of publications in the field of computational finance in recent
years, most of these have been geared towards derivatives pricing and/or risk manage-
ment.
1
In the field of financial econometrics, most books have been subject specific,
2
with
very few truly comprehensive publications.
3
Even then, these books on financial econo-
metrics have been in reality mostly theoretical, with empirical applications essentially
focused on validating or invalidating economic and financial theories through econometric
and statistical methods.
What distinguishes this book from others is that it focuses on a wide spectrum of meth-
ods for modelling financial markets in the context of practical financial applications.On
top of “traditional” financial econometrics, the methods used also include technical analy-
sis systems and many nonparametric tools from the fields of data mining and artificial
intelligence. Although we do not pretend to have covered all possible methodologies,
1
See, for instance, Wilmott, P. (1998), Derivatives: The Theory and Practice of Financial Engineering, John
Wiley, Chichester and Alexander, C. (2001), Market Models, John Wiley, Chichester.
2
See, for instance, Dunis, C., A. Timmermann and J. Moody (2001), Developments in Forecast Combination
and Portfolio Choice, John Wiley, Chichester.
3
See Campbell, J. Y., A. W. Lo and A. C. MacKinlay (1997), The Econometrics of Financial Markets, Prince-
ton University Press, Princeton and Gouri
´
eroux, C. and J. Jasiak (2002), Financial Econometrics, Princeton
University Press, Princeton.
xvi Preface
we believe that the wide breadth of potential methods retained in this manual is highly
desirable and one of its strengths. At the same time, we have been careful to present even
the most advanced techniques in a way that is accessible to most potential readers, mak-
ing sure that those interested in the practical utilisation of such methods could skip the
more theoretical developments without hindering comprehension, and concentrate on the
relevant practical application: in this respect, the accompanying CD-Rom should prove
an invaluable asset.
An applied book of this nature, with its extensive range of methodologies and applica-
tions covered, could only benefit from being a collaborative effort of several people with
the appropriate experience in their field. In order to retain the practitioner’s perspective
while ensuring the methodological soundness and, should we say, academic respectability
of the selected applications at the same time, we have assembled a small team of quantita-
tive market professionals, fund managers and proprietary traders, and academics who have
taught applied quantitative methods in finance at the postgraduate level in their respective
institutions and also worked as scientific consultants to asset management firms.
As mentioned above, the range of applications and techniques applied is quite large.
The different applications cover foreign exchange trading models with three chapters,
one using technical analysis, one advanced regression methods including nonparametric
Neural Network Regression (NNR) models and one a volatility filter-based system relying
on Markov switching regimes; one chapter on equity statistical arbitrage and portfolio
immunisation based on cointegration; two chapters on stock portfolio optimisation, one
using Kalman filtering techniques in the presence of time-varying betas and the other using
matrix algebra and Excel Solver to derive an optimal emerging stock market portfolio;
one chapter on yield curve modelling through the use of affine models; one chapter on
credit classification with decision trees, rule induction and neural network classification
models; two chapters on volatility modelling and trading, one using Excel to compute both
univariate and multivariate GARCH volatility and correlation in the stock market, the other
using straddle strategies based on GARCH and Recurrent Network Regression (RNR) to
build a forex volatility trading model; one chapter on Value at Risk (VaR) and option
pricing in the presence of stochastic volatility; one chapter on the information contained
in derivatives prices through the use of risk-neutral density functions and, finally, one
chapter on weather risk management when confronted with missing temperature data.
The first part of the book is concerned with applications relying upon advanced mod-
elling techniques. The applications include currencies, equities, volatility, the term struc-
ture of interest rates and credit classification. The second part of the book includes
three chapters where the applications on equities, VaR, option pricing and currency trad-
ing employ similar methodologies, namely Kalman filter and regime switching. In the
final part of the book there are five chapters where a variety of financial applications
ranging from technical trading to missing data analysis are predominantly implemented
using Excel.
In the following we provide further details on each chapter included in the book.
1. “Applications of Advanced Regression Analysis for Trading and Investment” by
C. L. Dunis and M. Williams: this chapter examines the use of regression models
in trading and investment with an application to EUR/USD exchange rate forecast-
ing and trading models. In particular, NNR models are benchmarked against some
other traditional regression-based and alternative forecasting techniques to ascertain
Preface xvii
their potential added value as a forecasting and quantitative trading tool. In addition
to evaluating the various models out-of-sample from May 2000 to July 2001 using
traditional forecasting accuracy measures, such as root-mean-squared errors, models
are also assessed using financial criteria, such as risk-adjusted measures of return.
Transaction costs are also taken into account. Overall, it is concluded that regression
models, and in particular NNR models, do have the ability to forecast EUR/USD
returns for the period investigated, and add value as a forecasting and quantitative
trading tool.
2. “Using Cointegration to Hedge and Trade International Equities” by A. N. Burgess:
this chapter analyses how to hedge and trade a portfolio of international equities,
applying the econometric concept of cointegration. The concepts are illustrated with
respect to a particular set of data, namely the 50 equities which constituted the
STOXX 50 index as of 4 July 2002. The daily closing prices of these equities are
investigated over a period from 14 September 1998 to 3 July 2002 – the longest
period over which continuous data is available across the whole set of stocks in this
particular universe. Despite some spurious effects due to the non-synchronous closing
times of the markets on which these equities trade, the data are deemed suitable for
illustration purposes. Overall, depending on the particular task in hand, it is shown
that the techniques applied can be successfully used to identify potential hedges for
a given equity position and/or to identify potential trades which might be taken from
a statistical arbitrage perspective.
3. “Modelling the Term Structure of Interest Rates: An Application of Gaussian Affine
Models to the German Yield Curve” by N. Cassola and J. B. Lu
´
ıs: this chapter shows
that a two-factor constant volatility model describes quite well the dynamics and the
shape of the German yield curve between 1986 and 1998. The analysis supports the
expectations theory with constant term premiums and thus the term premium structure
can be calculated and short-term interest rate expectations derived from the adjusted
forward rate curve. The analysis is carried out in Matlab and the authors include all
of the files with which to reproduce the analysis. Their findings will be of interest
to risk managers analysing the shape of the yield curve under different scenarios and
also to policy makers in assessing the impact of fiscal and monetary policy.
4. “Forecasting and Trading Currency Volatility: An Application of Recurrent Neural
Regression and Model Combination” by C. L. Dunis and X. Huang: this chapter
examines the use of nonparametric Neural Network Regression (NNR) and Recurrent
Neural Network (RNN) regression models for forecasting and trading currency volatil-
ity, with an application to the GBP/USD and USD/JPY exchange rates. The results of
the NNR and RNN models are benchmarked against the simpler GARCH alternative
and implied volatility. Two simple model combinations are also analysed. Alterna-
tive FX volatility forecasting models are tested out-of-sample over the period April
1999–May 2000, not only in terms of forecasting accuracy, but also in terms of trad-
ing efficiency: in order to do so, a realistic volatility trading strategy is implemented,
using FX option straddles once mispriced options have been identified. Allowing
for transaction costs, most trading strategies retained produce positive returns. RNN
models appear as the best single modelling approach, yet model combination which
has the best overall performance in terms of forecasting accuracy fails to improve
the RNN-based volatility trading results.
xviii Preface
5. “Implementing Neural Networks, Classification Trees, and Rule Induction Classifi-
cation Techniques: An Application to Credit Risk” by G. T. Albanis: this chapter
shows how to implement several classification tools for data mining applications in
finance. Two freely available softwares on classification neural networks and deci-
sion trees, respectively, and one commercial software for constructing decision trees
and rule induction classifiers are demonstrated, using two datasets that are available
in the public domain. The first dataset is known as the Australian credit approval
dataset. The application consists of constructing a classification rule for assessing the
quality of credit card applicants. The second dataset is known as the German credit
dataset. The aim in this application is to construct a classification rule for assess-
ing the credit quality of German borrowers. Beyond these examples, the methods
demonstrated in this chapter can be applied to many other quantitative trading and
investment problems, such as the determination of outperforming/underperforming
stocks, bond rating, etc.
6. “Switching Regime Volatility: An Empirical Evaluation” by B. B. Roche and M.
Rockinger: this chapter describes in a pedagogical fashion, using daily observations
of the USD/DEM exchange rate from October 1995 to October 1998, how to estimate
a univariate switching model for daily foreign exchange returns which are assumed to
be drawn in a Markovian way from alternative Gaussian distributions with different
means and variances. The application shows that the USD/DEM exchange rate can
be modelled as a mixture of normal distributions with changes in volatility, but not
in mean, where regimes with high and low volatility alternate. The usefulness of
this methodology is demonstrated in a real life application, i.e. through the profit
performance comparison of simple hedging strategies.
7. “Quantitative Equity Investment Management with Time-Varying Factor Sensitivities”
by Y. Bentz: this chapter describes three methods used in modern equity investment
management for estimating time-varying factor sensitivities. Factor models enable
investment managers, quantitative traders and risk managers to model co-movements
among assets in an efficient way by concentrating the correlation structure into a small
number of factors. Unfortunately, the correlation structure is not constant but evolves
in time and so do the factor sensitivities. As a result, the sensitivity estimates have to
be constantly updated in order to keep up with the changes. The first method, based
on rolling regressions, is the most popular but also the least accurate. The second
method is based on a weighted regression approach which overcomes some of the
limitations of the first method by giving more importance to recent observations.
Finally, a Kalman filter-based stochastic parameter regression model is shown to
optimally estimate nonstationary factor exposures.
8. “Stochastic Volatility Models: A Survey with Applications to Option Pricing and
Value at Risk” by M. Billio and D. Sartore: this chapter analyses the impact on Value
at Risk and option pricing of the presence of stochastic volatility, using data for the
FTSE100 stock index. Given the time-varying volatility exhibited by most financial
data, there has been a growing interest in time series models of changing variance in
recent years and the literature on stochastic volatility models has expanded greatly:
for these models, volatility depends on some unobserved components or a latent
structure. This chapter discusses some of the most important ideas, focusing on the
simplest forms of the techniques and models available. It considers some motivations
for stochastic volatility models: empirical stylised facts, pricing of contingent assets
Preface xix
and risk evaluation, and distinguishes between models with continuous and discrete
volatility, the latter depending on a hidden Markov chain. A stochastic volatility
estimation program is presented and several applications to option pricing and risk
evaluation are discussed.
9. “Portfolio Analysis Using Excel” by J. Laws analyses the familiar Markovitz model
using Excel. This topic is taught on Finance degrees and Master’s programmes all
over the world, increasingly through the use of Excel. The author takes time out to
explain how the spreadsheet is set up and how simple short-cuts can make analysis of
this type of problem quick and straightforward. In the first section of the chapter the
author uses a two-variable example to show how portfolio risk and return vary with
the input weights, then he goes on to show how to determine the optimal weights,
in a risk minimisation sense, using both linear expressions and matrix algebra. In
the second part of the chapter the author extends the number of assets to seven
and illustrates that using matrix algebra within Excel, the Markovitz analysis of an
n-asset portfolio is as straightforward as the analysis of a two-asset portfolio. The
author takes special care in showing how the correlation matrix can be generated
most efficiently and how within the same framework the optimisation objective can
be modified without fuss.
10. “Applied Volatility and Correlation Modelling Using Excel” by F. Bourgoin. The
originality of this chapter lies in the fact that the author manages to implement
a range of univariate and multivariate models within the software package, Excel.
This is extremely useful as a large proportion of finance practitioners, students and
researchers are familiar with this package. Using S&P500 return data the author
generates one-step-ahead forecasts of volatility using the J.P. Morgan RiskMetrics
model, the J.P. Morgan RiskMetrics model with optimal decay, a GARCH(1,1) model
with and without a variance reduction technique and finally using the GJR model to
account for asymmetric reaction to news. A comparison of forecasts is made and
some useful insights into the efficacy of the models highlighted. In the second part
of the chapter the author uses return data on the DAX30 and CAC40 to model the
correlation structure using a number of models. As with the univariate approach
this includes the J.P. Morgan RiskMetrics model with and without optimal decay, a
GARCH model with and without variance reduction and finally the so-called “Fast
GARCH” model of which the author has previously made significant contributions
to the literature.
11. “Optimal Allocation of Trend-Following Rules: An Application Case of Theoretical
Results” by P. Lequeux uses sophisticated Excel modelling tools to determine what
should be the optimal weighting of trading rules to maximise the information ratio.
The trading rules utilised in the chapter are moving average trading rules ranging in
order from 2 to 117 days and they are applied to a sample of five currency pairs
(USD–JPY, EUR–USD, GBP–USD, USD–CAD and AUD–USD) over the period
15/02/1996 to 12/03/2002. The analysis could however be applied to any financial
asset and any linear trading rule. In the applied example the author attempts to
determine ex-ante what would be the optimal weighting between moving averages
of order 2, 3, 5, 9, 32, 61 and 117 to maximise the delivered information ratio.
To assist in understanding, the model has been programmed into a spreadsheet to
give the reader the possibility to experiment. The results show that in four currency
xx Preface
pairs out of five the optimal weighting procedure is superior, when measured by the
information ratio, to an equally weighted basket of trading rules.
12. “Portfolio Management and Information from Over-the-Counter Currency Options”
by J. B. Lu
´
ıs: this chapter looks at the informational content of risk-reversals and
strangles derived from OTC at-the-money forward volatilities. Three empirical appli-
cations of the literature are presented: one on the EUR/USD, followed by the analysis
of implied correlations and the credibility of the Portuguese exchange rate policy dur-
ing the transition to the EMU, and of the Danish exchange rate policy around the
euro referendum in September 2000. This chapter is supported by the necessary Excel
files to allow the reader to validate the author’s results and/or apply the analysis to a
different dataset.
13. “Filling Analysis for Missing Data: An Application to Weather Risk Management” by
C. L. Dunis and V. Karalis: this chapter analyses the use of alternative methods when
confronted with missing data, a common problem when not enough historical data or
clean historical data exist, which will typically be the case when trying to develop a
decision tool either for a new asset in a given asset class (say a recently issued stock
in a given company sector) or for a new asset class as such (for instance weather
derivatives). The application to weather data derives from the fact that most weather
derivatives pricing methodologies rely heavily on clean data. The statistical imputation
accuracy of different filling methods for missing historical records of temperature data
is compared: the Expectation Maximisation (EM) algorithm, the Data Augmentation
(DA) algorithm, the Kalman Filter (KF), Neural Networks Regression (NNR) models
and, finally, Principal Component Analysis (PCA). Overall, it is found that, for the
periods and the data series concerned, the results of PCA outperformed the other
methodologies in all cases of missing observations analysed.
Overall, the objective of Applied Quantitative Methods for Trading and Investment is not
to make new contributions to finance theory and/or financial econometrics: more simply,
but also more practically, it is to enable its readers to make competent use of advanced
methods for modelling financial markets.
We hope that, with the numerous files and software programs made available on the
accompanying CD-Rom, it will constitute a valuable reference textbook for quantitative
market professionals, academics and finance graduate students.
Many of the authors of chapters contained in this book have an affiliation to the Fore-
casting Financial Markets (FFM) conference which has been held each May since 1993.
The editors of the text and several of the authors are members or associates of the Centre
for International Banking, Economics and Finance (CIBEF) at Liverpool John Moores
University. Details of both the conference and CIBEF may be found at www.cibef.com.
February 2003
1
Applications of Advanced Regression
Analysis for Trading and Investment
∗
CHRISTIAN L. DUNIS AND MARK WILLIAMS
ABSTRACT
This chapter examines and analyses the use of regression models in trading and investment
with an application to foreign exchange (FX) forecasting and trading models. It is not
intended as a general survey of all potential applications of regression methods to the
field of quantitative trading and investment, as this would be well beyond the scope of
a single chapter. For instance, time-varying parameter models are not covered here as
they are the focus of another chapter in this book and Neural Network Regression (NNR)
models are also covered in yet another chapter.
In this chapter, NNR models are benchmarked against some other traditional regression-
based and alternative forecasting techniques to ascertain their potential added value as a
forecasting and quantitative trading tool.
In addition to evaluating the various models using traditional forecasting accuracy
measures, such as root-mean-squared errors, they are also assessed using financial criteria,
such as risk-adjusted measures of return.
Having constructed a synthetic EUR/USD series for the period up to 4 January 1999, the
models were developed using the same in-sample data, leaving the remainder for out-of-
sample forecasting, October 1994 to May 2000, and May 2000 to July 2001, respectively.
The out-of-sample period results were tested in terms of forecasting accuracy, and in
terms of trading performance via a simulated trading strategy. Transaction costs are also
taken into account.
It is concluded that regression models, and in particular NNR models do have the ability
to forecast EUR/USD returns for the period investigated, and add value as a forecasting
and quantitative trading tool.
1.1 INTRODUCTION
Since the breakdown of the Bretton Woods system of fixed exchange rates in 1971–1973
and the implementation of the floating exchange rate system, researchers have been moti-
vated to explain the movements of exchange rates. The global FX market is massive with
∗
The views expressed herein are those of the authors, and not necessarily those of Girobank.
Applied Quantitative Methods for Trading and Investment. Edited by C.L. Dunis, J. Laws and P. Na
¨
ım
2003 John Wiley & Sons, Ltd ISBN: 0-470-84885-5
2 Applied Quantitative Methods for Trading and Investment
an estimated current daily trading volume of USD 1.5 trillion, the largest part concerning
spot deals, and is considered deep and very liquid. By currency pairs, the EUR/USD is
the most actively traded.
The primary factors affecting exchange rates include economic indicators, such as
growth, interest rates and inflation, and political factors. Psychological factors also play a
part given the large amount of speculative dealing in the market. In addition, the movement
of several large FX dealers in the same direction can move the market. The interaction
of these factors is complex, making FX prediction generally difficult.
There is justifiable scepticism in the ability to make money by predicting price changes
in any given market. This scepticism reflects the efficient market hypothesis according
to which markets fully integrate all of the available information, and prices fully adjust
immediately once new information becomes available. In essence, the markets are fully
efficient, making prediction useless. However, in actual markets the reaction to new infor-
mation is not necessarily so immediate. It is the e xistence of market inefficiencies that
allows forecasting. However, the FX spot market is generally considered the most efficient,
again making prediction difficult.
Forecasting exchange rates is vital for fund managers, borrowers, corporate treasurers,
and specialised traders. However, the difficulties involved are demonstrated by the fact
that only three out of every 10 spot foreign exchange dealers make a profit in any given
year (Carney and Cunningham, 1996).
It is often difficult to identify a forecasting model because the underlying laws may
not be clearly understood. In addition, FX time series may display signs of nonlinearity
which traditional linear forecasting techniques are ill equipped to handle, often producing
unsatisfactory results. Researchers confronted with problems of this nature increasingly
resort to techniques that are heuristic and nonlinear. Such techniques include the use of
NNR models.
The prediction of FX time series is one of the most challenging problems in forecasting.
Our main motivation in this chapter is to determine whether regression models and, among
these, NNR models can extract any more from the data than traditional techniques. Over
the past few years, NNR models have provided an attractive alternative tool for researchers
and analysts, claiming improved performance over traditional techniques. However, they
have received less attention within financial areas than in other fields.
Typically, NNR models are optimised using a mathematical criterion, and subsequently
analysed using similar measures. However, statistical measures are often inappropriate
for financial applications. Evaluation using financial measures may be more appropriate,
such as risk-adjusted measures of return. In essence, trading driven by a model with a
small forecast error may not be as profitable as a model selected using financial criteria.
The motivation for this chapter is to determine the added value, or otherwise, of NNR
models by benchmarking their results against traditional regression-based and other fore-
casting techniques. Accordingly, financial trading models are developed for the EUR/USD
exchange rate, using daily data from 17 October 1994 to 18 May 2000 for in-sample
estimation, leaving the period from 19 May 2000 to 3 July 2001 for out-of-sample fore-
casting.
1
The trading models are evaluated in terms of forecasting accuracy and in terms
of trading performance via a simulated trading strategy.
1
The EUR/USD exchange rate only exists from 4 January 1999: it was retropolated from 17 October 1994 to
31 December 1998 and a synthetic EUR/USD series was created for that period using the fixed EUR/DEM
conversion rate agreed in 1998, combined with the USD/DEM daily market rate.
Applications of Advanced Regression Analysis 3
Our results clearly show that NNR models do indeed add value to the forecast-
ing process.
The chapter is organised as follows. Section 1.2 presents a brief review of some of the
research in FX markets. Section 1.3 describes the data used, addressing issues such as
stationarity. Section 1.4 presents the benchmark models selected and our methodology.
Section 1.5 briefly discusses NNR model theory and methodology, raising some issues
surrounding the technique. Section 1.6 describes the out-of-sample forecasting accuracy
and trading simulation results. Finally, Section 1.7 provides some concluding remarks.
1.2 LITERATURE REVIEW
It is outside the scope of this chapter to provide an exhaustive survey of all FX applica-
tions. However, we present a brief review of some of the material concerning financial
applications of NNR models that began to emerge in the late 1980s.
Bellgard and Goldschmidt (1999) examined the forecasting accuracy and trading per-
formance of several traditional techniques, including random walk, exponential smoothing,
and ARMA models with Recurrent Neural Network (RNN) models.
2
The research was
based on the Australian dollar to US dollar (AUD/USD) exchange rate using half hourly
data during 1996. They conclude that statistical forecasting accuracy measures do not
have a direct bearing on profitability, and FX time series exhibit nonlinear patterns that
are better exploited by neural network models.
Tyree and Long (1995) disagree, finding the random walk model more effective than the
NNR models examined. They argue that although price changes are not strictly random,
in their case the US dollar to Deutsche Mark (USD/DEM) daily price changes from 1990
to 1994, from a forecasting perspective what little structure is actually present may well
be too negligible to be of any use. They acknowledge that the random walk is unlikely
to be the optimal forecasting technique. However, they do not assess the performance of
the models financially.
The USD/DEM daily price changes were also the focus for Refenes and Zaidi (1993).
However they use the period 1984 to 1992, and take a different approach. They developed
a hybrid system for managing exchange rate strategies. The idea was to use a neural
network model to predict which of a portfolio of strategies is likely to perform best
in the current context. The evaluation was based upon returns, and concludes that the
hybrid system is superior to the traditional techniques of moving averages and mean-
reverting processes.
El-Shazly and El-Shazly (1997) examined the one-month forecasting performance of
an NNR model compared with the forward rate of the British pound (GBP), German
Mark (DEM), and Japanese yen (JPY) against a common currency, although they do not
state which, using weekly data from 1988 to 1994. Evaluation was based on forecasting
accuracy and in terms of correctly forecasting the direction of the exchange rate. Essen-
tially, they conclude that neural networks outperformed the forward rate both in terms of
accuracy and correctness.
Similar FX rates are the focus for Gen¸cay (1999). He examined the predictability of
daily spot exchange rates using four models applied to five currencies, namely the French
franc (FRF), DEM, JPY, Swiss franc (CHF), and GBP against a common currency from
2
A brief discussion of RNN models is presented in Section 1.5.
4 Applied Quantitative Methods for Trading and Investment
1973 to 1992. The models include random walk, GARCH(1,1), NNR models and nearest
neighbours. The models are evaluated in terms of forecasting accuracy and correctness of
sign. Essentially, he concludes that non-parametric models dominate parametric ones. Of
the non-parametric models, nearest neighbours dominate NNR models.
Yao et al. (1996) also analysed the predictability of the GBP, DEM, JPY, CHF, and
AUD against the USD, from 1984 to 1995, but using weekly data. However, they take an
ARMA model as a benchmark. Correctness of sign and trading performance were used
to evaluate the models. They conclude that NNR models produce a higher correctness
of sign, and consequently produce higher returns, than ARMA models. In addition, they
state that without the use of extensive market data or knowledge, useful predictions can
be made and significant paper profit can be achieved.
Yao et al. (1997) examine the ability to forecast the daily USD/CHF exchange rate
using data from 1983 to 1995. To evaluate the performance of the NNR model, “buy and
hold” and “trend following” strategies were used as benchmarks. Again, the performance
was evaluated through correctness of sign and via a trading simulation. Essentially, com-
pared with the two benchmarks, the NNR model performed better and produced greater
paper profit.
Carney and Cunningham (1996) used four data sets over the period 1979 to 1995
to examine the single-step and multi-step prediction of the weekly GBP/USD, daily
GBP/USD, weekly DEM/SEK (Swedish krona) and daily GBP/DEM exchange rates.
The neural network models were benchmarked by a na
¨
ıve forecast and the evaluation
was based on forecasting accuracy. The results were mixed, but concluded that neural
network models are useful techniques that can make sense of complex data that defies
traditional analysis.
A number of the successful forecasting claims using NNR models have been pub-
lished. Unfortunately, some of the work suffers from inadequate documentation regarding
methodology, for example El-Shazly and El-Shazly (1997), and Gen¸cay (1999). This
makes it difficult to both replicate previous work and obtain an accurate assessment of
just how well NNR modelling techniques perform in comparison to other forecasting
techniques, whether regression-based or not.
Notwithstanding, it seems pertinent to evaluate the use of NNR models as an alternative
to traditional forecasting techniques, with the intention to ascertain their potential added
value to this specific application, namely forecasting the EUR/USD exchange rate.
1.3 THE EXCHANGE RATE AND RELATED FINANCIAL DATA
The FX market is perhaps the only market that is open 24 hours a day, seven days a
week. The market opens in Australasia, followed by the Far East, the Middle East and
Europe, and finally America. Upon the close of America, Australasia returns to the market
and begins the next 24-hour cycle. The implication for forecasting applications is that in
certain circumstances, because of time-zone differences, researchers should be mindful
when considering which data and which subsequent time lags to include.
In any time series analysis it is critical that the data used is clean and error free since
the learning of patterns is totally data-dependent. Also significant in the study of FX time
series forecasting is the rate at which data from the market is sampled. The sampling
frequency depends on the objectives of the researcher and the availability of data. For
example, intraday time series can be extremely noisy and “a typical off-floor trader
Applications of Advanced Regression Analysis 5
would most likely use daily data if designing a neural network as a component of an
overall trading system” (Kaastra and Boyd, 1996: 220). For these reasons the time series
used in this chapter are all daily closing data obtained from a historical database provided
by Datastream.
The investigation is based on the London daily closing prices for the EUR/USD
exchange rate.
3
In the absence of an indisputable theory of exchange rate determina-
tion, we assumed that the EUR/USD exchange rate could be explained by that rate’s
recent evolution, volatility spillovers from other financial markets, and macro-economic
and monetary policy expectations. With this in mind it seemed reasonable to include,
as potential inputs, other leading traded exchange rates, the evolution of important stock
and commodity prices, and, as a measure of macro-economic and monetary policy expec-
tations, the evolution of the yield curve. The data retained is presented in Table 1.1
along with the relevant Datastream mnemonics, and can be reviewed in Sheet 1 of the
DataAppendix.xls Excel spreadsheet.
Table 1.1 Data and Datastream mnemonics
Number Variable Mnemonics
1 FTSE 100 – PRICE INDEX FTSE100
2 DAX 30 PERFORMANCE – PRICE INDEX DAXINDX
3 S&P 500 COMPOSITE – PRICE INDEX S&PCOMP
4 NIKKEI 225 STOCK AVERAGE – PRICE INDEX JAPDOWA
5 FRANCE CAC 40 – PRICE INDEX FRCAC40
6 MILAN MIB 30 – PRICE INDEX ITMIB30
7 DJ EURO STOXX 50 – PRICE INDEX DJES50I
8 US EURO-$ 3 MONTH (LDN:FT) – MIDDLE RATE ECUS$3M
9 JAPAN EURO-$ 3 MONTH (LDN:FT) – MIDDLE RATE ECJAP3M
10 EURO EURO-CURRENCY 3 MTH (LDN:FT) – MIDDLE RATE ECEUR3M
11 GERMANY EURO-MARK 3 MTH (LDN:FT) – MIDDLE RATE ECWGM3M
12 FRANCE EURO-FRANC 3 MTH (LDN:FT) – MIDDLE RATE ECFFR3M
13 UK EURO-£ 3 MONTH (LDN:FT) – MIDDLE RATE ECUK£3M
14 ITALY EURO-LIRE 3 MTH (LDN:FT) – MIDDLE RATE ECITL3M
15 JAPAN BENCHMARK BOND-RYLD.10 YR (DS) – RED. YIELD JPBRYLD
16 ECU BENCHMARK BOND 10 YR (DS) ‘DEAD’ – RED. YIELD ECBRYLD
17 GERMANY BENCHMARK BOND 10 YR (DS) – RED. YIELD BDBRYLD
18 FRANCE BENCHMARK BOND 10 YR (DS) – RED. YIELD FRBRYLD
19 UK BENCHMARK BOND 10 YR (DS) – RED. YIELD UKMBRYD
20 US TREAS. BENCHMARK BOND 10 YR (DS) – RED. YIELD USBD10Y
21 ITALY BENCHMARK BOND 10 YR (DS) – RED. YIELD ITBRYLD
22 JAPANESE YEN TO US $ (WMR) – EXCHANGE RATE JAPAYE$
23 US$TOUK£ (WMR) – EXCHANGE RATE USDOLLR
24 US $ TO EURO (WMR) – EXCHANGE RATE USEURSP
25 Brent Crude-Current Month, fob US $/BBL OILBREN
26 GOLD BULLION $/TROY OUNCE GOLDBLN
27 Bridge/CRB Commodity Futures Index – PRICE INDEX NYFECRB
3
EUR/USD is quoted as the number of USD per euro: for example, a value of 1.2657 is USD1.2657 per euro.
The EUR/USD series for the period 1994–1998 was constructed as indicated in footnote 1.
6 Applied Quantitative Methods for Trading and Investment
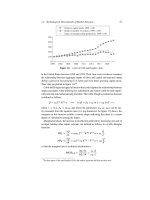
All the series span the period from 17 October 1994 to 3 July 2001, totalling 1749
trading days. The data is divided into two periods: the first period runs from 17 October
1994 to 18 May 2000 (1459 observations) used for model estimation and is classified
in-sample, while the second period from 19 May 2000 to 3 July 2001 (290 observa-
tions) is reserved for out-of-sample forecasting and evaluation. The division amounts to
approximately 17% being retained for out-of-sample purposes.
Over the review period there has been an overall appreciation of the USD against
the euro, as presented in Figure 1.1. The summary statistics of the EUR/USD for the
examined period are presented in Figure 1.2, highlighting a slight skewness and low
kurtosis. The Jarque–Bera statistic confirms that the EUR/USD series is non-normal at the
99% confidence interval. Therefore, the indication is that the series requires some type of
transformation. The use of data in levels in the FX market has many problems, “FX price
movements are generally non-stationary and quite random in nature, and therefore not very
suitable for learning purposes Therefore for most neural network studies and analysis
concerned with the FX market, price inputs are not a desirable set” (Mehta, 1995: 191).
To overcome these problems, the EUR/USD series is transformed into rates of return.
Given the price level P
1
,P
2
, ,P
t
, the rate of return at time t is formed by:
R
t
=
P
t
P
t−1
− 1 (1.1)
An example of this transformation can be reviewed in Sheet 1 column C of the
oos
Na
¨
ıve.xls Excel spreadsheet, and is also presented in Figure 1.5. See also the comment
in cell C4 for an explanation of the calculations within this column.
An advantage of using a returns series is that it helps in making the time series sta-
tionary, a useful statistical property.
Formal confirmation that the EUR/USD returns series is stationary is confirmed at the
1% significance level by both the Augmented Dickey–Fuller (ADF) and Phillips–Perron
(PP) test statistics, the results of which are presented in Tables 1.2 and 1.3.
The EUR/USD returns series is presented in Figure 1.3. Transformation into returns
often creates a noisy time series. Formal confirmation through testing the significance of
95 96 97 98
17 October 1994 to 3 July 2001
EUR/USD
99 00 01
0.60
0.70
0.80
0.90
1.00
1.10
1.20
1.30
1.40
1.50
1.60
Figure 1.1 EUR/USD London daily closing prices (17 October 1994 to 3 July 2001)
4
4
Retropolated series for 17 October 1994 to 31 December 1998.
Applications of Advanced Regression Analysis 7
0
50
100
150
200
0.9 1.0 1.1 1.2 1.3
Series:USEURSP
Sample 1 1749
Observations 1749
Mean
Median
Maximum
Minimum
Std. Dev.
Skewness
Kurtosis
1.117697
1.117400
1.347000
0.828700
0.136898
−0.329711
2.080124
Jarque–Bera
Probability
93.35350
0.000000
Figure 1.2 EUR/USD summary statistics (17 October 1994 to 3 July 2001)
Table 1.2 EUR/USD returns ADF test
ADF test statistic −18.37959 1% critical value
a
−3.4371
5% critical value −2.8637
10% critical value −2.5679
a
MacKinnon critical values for rejection of hypothesis of a unit root.
Augmented Dickey–Fuller Test Equation
Dependent Variable: D(DR
−
USEURSP)
Method: Least Squares
Sample(adjusted): 7 1749
Included observations: 1743 after adjusting endpoints
Variable Coefficient Std. error t-Statistic Prob.
DR
−
USEURSP(−1) −0.979008 0.053266 −18.37959 0.0000
D(DR
−
USEURSP(−1)) −0.002841 0.047641 −0.059636 0.9525
D(DR
−
USEURSP(−2)) −0.015731 0.041288 −0.381009 0.7032
D(DR
−
USEURSP(−3)) −0.011964 0.033684 −0.355179 0.7225
D(DR
−
USEURSP(−4)) −0.014248 0.024022 −0.593095 0.5532
C −0.000212 0.000138 −1.536692 0.1246
R-squared 0.491277 Mean dependent var. 1.04E-06
Adjusted R-squared 0.489812 S.D. dependent var. 0.008048
S.E. of regression 0.005748 Akaike info. criterion −7.476417
Sum squared resid. 0.057394 Schwarz criterion −7.457610
Log likelihood 6521.697 F -statistic 335.4858
Durbin–Watson stat. 1.999488 Prob(F -statistic) 0.000000