Integrated Waste Management Volume II Part 2 pot
Bạn đang xem bản rút gọn của tài liệu. Xem và tải ngay bản đầy đủ của tài liệu tại đây (2.95 MB, 35 trang )
Integrated Waste Management – Volume II
26
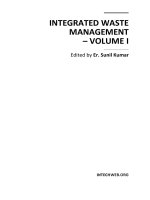
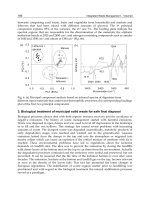
Fig. 7. Solid waste accumulated in the entrance of a manhole of a drainage system
Number of
Household
Sampled
Collectors and Disposal agents Collection Frequency
Private agent
Self
Cart Pushers
Local Govt
Council
LAWMA
Daily
Once a week
Twice a
week
Once in 2
wks
Once a
month
110 76 5 29 Nil Nil Nil 57 25 28 Nil
Percentage 69.1 4.6 26.4 51.9 22.7 25.5
Table 4. Household responses on collection of solid waste from their homes for disposal in
Lagos metropolis
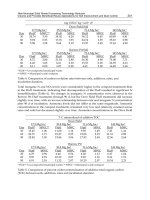
8.5 Solid waste source segregation
In developing countries solid waste source segregation awareness is very poor. In Lagos and
Benin metropolises solid waste source segregation is not practiced by residents and
commercial operators. A pilot study carried out in Benin metropolis showed that the residents
have poor attitude to solid waste source sorting. The results shown in table 5 indicated that in
the week one of the study, 43% of the participants achieved 100% source segregation of
biodegradable waste. In weeks 2 and 3 the number of households that achieved 100% source
segregation of food waste increased to about 52% and 60%, respective. This was as a result of
serious sensitization of the households on the benefits that will be realized from source sorting
of solid waste. In this case no personal benefit accrued to the generators, may be in the form of
discount on solid waste disposal charges. Thereafter, there was a decline in the numbers of
households that achieved 100% segregation of the waste and the participant started asking for
what were their benefits from the work and declined on further participation. This implies that
for sustainability of the process there must be mutual benefit from the waste for the managers
of the solid waste and the generator of the waste.
It is believed that if discounts are granted on disposal service charges, more generators will
achieve 100% separation of biodegradables and plastic waste at source as the discount will
Status of Waste Management
27
represent the benefit of the generator on the segregation exercise. Considering the results
from the pilot study on source segregation, two waste bin source segregation of
biodegradable waste and other waste (metal, paper, plastics etc) will be much more effective
at the start of the system. This will gradually be increased to three waste bins for
biodegradable, plastics and other waste with time.
Week
% of households with 100% separation
Food waste Plastic waste
Week 1 43.48 0.00
Week 2 52.17 0.00
Week 3 60.87 34.78
Week 4 50.12 31.45
Week 5 38.10 28.26
Week 6 46.08 28.5
Table 5. Percentage Cooperation of households in each waste Bin in Benin metropolis solid
waste management
8.6 Land fill site
Landfill is the common practice in the Benin and Lagos metropolis. Closed mining sites were
converted to solid waste dumpsite without preparation for use as solid waste landfill site.
There are three approved dump sites in the Lagos metropolis. These land fill sites have weight
bridges at the gate house of the site. When vehicles carrying solid waste get to the gate their
weights were taken at entry and exit. The difference between their weights on entry and exit
were determined and recorded. Table 6 shows the records of weekly average solid waste
delivered at the three approved waste dumpsite in the Lagos metropolis in 2006. The table
showed that an average of 12,940.15 metric tons of solid waste was delivered at the three
approved dumpsite per week. The 2006 national census puts the population of Mushin Local
government area at 633,009 people. This population will therefore result to the generation of
360.8 metric tons of solid waste per day and 2525.7 metric tons per week of domestic solid
waste alone from the Mushin Local Government. This value is a far cry compare to the total
average weekly solid waste (commercial and domestic) of about 1753 metric tons delivered at
the approved dump site from Mushin LGA. This therefore explains why solid waste is
eventually dumped at illegal waste dump and thrown around in street corners.
In contrast the Benin metropolis had eight approved dump sites. At the time of this study but
only two were operational – Iguomo and Uzebu land fill site. There were neither gate houses
nor measuring instruments at the sites. Solid waste was dump indiscriminately at the site.
However an experiment was carried out to determine the solid waste delivered at these
dumpsites during the period of the study. The result from the experiment showed that a daily
average of 33.61 metric tons of solid waste was delivered at the Iguomo dump site and 226.40
metric tons of solid waste was delivered at the Uzebu dump site. Table 5 shows the result of
the site-specific studies in Benin metropolis and the result revealed that an average of 0.425Kg
per person per day is generated from Benin metropolis. The population census put the
population in the Benin metropolis at 1085676 people in 2006. This will give a total solid waste
Integrated Waste Management – Volume II
28
generated from residential site of about 461.41 metric tons per day. When this value is
compare with the total of 260.00 metric tons obtained from the experimental determination of
solid waste delivered at the dump site, we have a short fall of 201.41 metric tons of solid waste
from residential site. It should be noted that solid waste is delivered to the dump site from all
the source of solid waste – domestic, commercial and industrial sites in the metropolis. This
therefore explains the reason why solid waste also is seen littered all around in the metropolis.
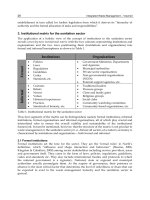
The current method of solid waste management at the landfill site is simple. The waste
disposal trucks and other vehicle that deliver waste to the site drive into the dumpsite
through the access road and dump their waste. The workers at the site use shovel to
manually push the waste from the road and try to spread them as much as their strength
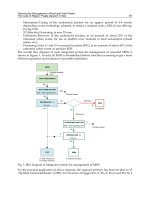
can go. This, of course is a Herculean task. Thereafter, scavengers descend on the waste to
pickup recyclable materials for sale and, open air incineration without pollution control is
also carried out on the waste for volume reduction (see fig. 8)
Environmental health is very important in location of landfill sites. One of the two
functional landfill sites in Benin metropolis is located by a stream of water. This of course
can cause eutrophication. Hence there is a serious indication of adverse effect on people in
the metropolis as the stream is one of the sources of water to the people nearby.
Date/ Period
Abule-Egba
(Metric tones)
Soulous
(Metric tones)
Olushosun
(Metric tones)
Weekly Total
(Metric tones)
Week 1 246 1459 8871.6 10,576.6
Week 2 320 1946 9224 11,490
Week 3 690 2051 10608 13,349
Week 4 1354 2058 13541 16,345
Monthly Total 2610 7514 42244.6 51760.6
(Source: LAWMA Solid waste Record)
Table 6. Average Weekly solid waste delivered at the approved dumpsite by the waste
management agents in 2006.
Fig. 8.a Open air incineration of solid waste at dump site.
Status of Waste Management
29
Fig. 8.b Open air incineration and scavenging activities at the dumpsites
Period
Solid waste(Metric tones)
Week 1 1,749
Week 2 1,595
Week 3 1,848
Week 4 1,815
Monthly Total 7,007
(Source: LAWMA Solid waste Record)
Table 7. Average Weekly metric tons of solid waste delivered at the approved dumpsites
From Mushin LGA by the waste management agents.
Number of
Household Sampled
Collectors and Disposal agents Collection Frequency
Private agent
Self
Cart Pushers
Local Govt Council
LAWMA
Daily
Once a week
Twice a week
Once in 2 wks
Once a month
110 76 5 29 Nil Nil Nil 57 25 28 Nil
Percentage 69.10 4.55 26.36 51.81 22.73 25.46
Table 8. Household responses on collection of solid waste from their homes for disposal
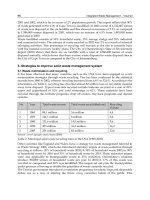
8.7 The solid waste chain in Nigeria
Solid waste management in Lagos and Benin metropolis revealed a serious deviation from
the solid waste chain shown in fig. 2. Solid waste was seen in huge heaps in illegal solid
Integrated Waste Management – Volume II
30
waste dump site, in the open market place, around home and in drainage systems. And this
has resulted to serious community environmental health crisis in the metropolis such as
water flooding and diseased epidemic. The solid waste chain obtained from the studies is
represented in fig.9.
Fig. 9. Solid waste chain in large towns and cities in Nigeria
8.8 Terms in the solid waste chain
8.8.1 Generation
Generation refers to the source of solid waste. In Nigeria municipal solid waste is generally
made up of waste generated from domestic and commercial activities.
8.8.2 Internal storage
Internal storage refers to storage of waste within the house or office at source. The study
revealed that small waste bin such as perforated bins, small plastic bags, empty paint
drums, plastic and metal buckets etc were used for storing waste internally at source. The
wastes are usually stored in the internal waste bins until the bins are filled up and then
transferred to the external waste bins.
8.8.3 Re-use
In most cases, the generator keeps solid waste items such as bottles and beverage cans for
storing liquids (kerosene, cooking oil etc), salt and other food items. In addition other solid
waste items such as paint cans, buckets and drums were also kept for storing water in the
Status of Waste Management
31
home and commercial unit. After a while, the items find their ways back to the waste stream
when they become broken or old.
8.8.4 External storage
External storage is the temporary storage of the wastes in bins usually located outside the
house for domestic source and outside the premises for commercial source. The types of
external waste bins in use in Lagos and Benin metropolis include: Metal and plastic drums,
Bins constructed with blocks, Pits, Sacks, etc.
8.8.5 Collection
This refers to the collection of the solid waste from the generators for disposal by the waste
disposal agents. The preliminary study showed that solid wastes were left in the external
storage bin for a period of one to four week before collection by the disposal agent in Lagos
and Benin metropolis.
8.8.6 Environment
Environment in this context means the surroundings of houses and business premises in the
metropolis. These include road sides, drainage system, market areas, etc. Large amount of
solid waste are thrown and made to lie around the environment in the metropolis.
8.8.7 Illegal dumpsites
These are unauthorized solid waste dumpsites where solid wastes were dumped
indiscriminately by residents in the metropolis. Many unused lands are converted to solid
waste dumps illegally. In fact, the waste control agencies are unable to enforce the
environmental laws and hence resident do whatever they like with their waste including
illegal dumping in the metropolis.
8.8.8 Approved dumpsite
These are authorized landfill sites where solid wastes are dumped and managed by the waste
management agencies. At the time of this study, there were eight approved dumpsites in the
metropolis, but only two were functional due to neglect by the authorities in charge. Hence,
there was indiscriminate dumping of solid waste at the site by disposal agents.
8.8.9 Sales
The generators sell some of their solid waste such as waste bottles which buyers use for
various purposes such as storage of vegetable oil and other cooking items. Some item were
also picked up by scavengers at the illegal dumpsites and external waste bins for sale.
Bottles used for packaging medicine were also sold.
8.8.10 Recycling
Recycling is the process of adding value to the waste to make it economically useful. Some
recyclable waste such as nylon and plastic/rubber bags were sorted and sent for recycling in
the metropolis. Recycling is at low ebb. The facility used for recycling plastic bags installed in
the metropolis was not very functional. A study of the recycling facilities showed that the
power consumption of the facility is about 225hp of electrical power. This is too high for small
and medium scale enterprises (SME). And the system was poorly designed.
Integrated Waste Management – Volume II
32
8.8.11 Burning
This is the process of setting the waste on fire and allowing it to burn to aches. This study
revealed that uncontrolled open burning of solid waste was practiced by generator and
waste management agents around houses, business areas and at the dumpsites in the
metropolis.
8.8.12 Burying
Burying is the process of covering the waste in a hole with sand in the ground. Burying of
solid waste is wildly practiced in Nigeria. This study revealed that residents dig hole behind
their houses to get sand for filling the foundation of their building to damp proof course
(DPC) levels during construction. When they move in to live in the houses they bury their
solid waste in such holes dug behind their houses during construction.
8.8.13 Use as source of heat energy
Residents of the metropolis burn solid waste to generate heat energy for cooking purpose. For
example, some residents in the metropolis go to the wood sawmill industry for collection of
wood sawdust which they burn to get heat for cooking their meals. In addition, during the
corn season, the boiled corn seller burns the corn curb to get heat for cooking corn for sale.
9. Feasible suggestion for improved solid waste management
1. There is need to pay more attention to the prevention of blocking of water ways. Not
only is this an unpleasant sight, it results in flooding of homes, breeding of pathogens
and pest. There must be improved litter control in the large town, cities and metropolis.
A very good way to promote this is by providing more public waste bins throughout
the metropolis and replacing the existing ones when they become old or when they are
damaged. If bins are available, then at least people will have the option of using them.
Without available waste bins, the only option that the people will have is to throw
waste on the ground which is the current practices.
2. It is obvious that funding is a major constraint in solid waste management; hence
special attention should be paid to financial planning by the Waste management
authorities in the metropolis. The government should create special charges that will be
paid by residents and business operators in the metropolis. And these charges should
be dedicated to management of solid waste in general in the metropolis. The collection
of these charges should be planned is such a way that the difficulties associated with
the collection of levies and charges currently will be eliminated.
3. Many officers in charge of solid waste management, particularly at the local and State
Waste Management authorities and other agencies handling the issues of waste, have
little or no technical background or training in environmental engineering or
management. In fact all the problems that the solid waste Management system is faced
with are exacerbated by the lack of trained personnel. This includes workers in all
ranks, from the administrators to the refuse men. There is no formal training
programme and communication is poor. Training for personnel is important.
Adequately trained managers, supervisors and foremen in both collection and final
disposal site positions are important for a smooth running operation and operational
data collection. New policies should be created for the management of solid waste in
the metropolis which will indicate the training requirement for various positions in the
Status of Waste Management
33
solid waste management system and these new policies should be officially
implemented by the responsible body
4. Presently, public awareness on solid waste issues is very poor. Public awareness needs
to be improved. This can be achieved using various means such as integration of
environmental education with emphasis on solid waste into school curricula beginning
with primary/elementary school. Other factor that could be applied includes news
releases, letters to the editor, news articles, newsletter articles, speeches, guest on the
radio and local TV programmes, messages in churches and mosque, notices in church
and mosque bulletins. These are plausible and financially feasible methods that can be
used for increasing public awareness on solid waste management.
5. Presently, landfill appears to be a method that will continue to be employed, hence
funding should therefore be improved for provision of landfill liners. Effort should also be
made to obtain liners from foreign sources as donations even if they are not the best ones.
This should also apply to leachate and gas collection system even if they are older
technology. It is better to have older technology than no technology at all (Zavodska,
2003).
6. Interview with the workers of the solid waste disposal agents indicated that protective
gears were not provided for them. Protective gears should be made available for the
solid waste collection workers and workers at the landfill sites. Heavy boots and heavy-
duty hand gloves should be provided to all as the biggest risk that they are exposed to
is stepping onto object that could penetrate their legs and also sharp objects could
scratch their hands when picking them up.
10. Conclusion
This has been primarily concerned with the assessment of the status of municipal solid waste
with particular reference to Nigeria. The municipal solid waste load assessment in terms of
types and quantity generated was carried out in Lagos and Benin metropolises in Nigeria. This
is what is termed as characterization of municipal solid waste. This is the case due to the fact
that knowing the expected waste load is the first step in any solid waste management design
project. The study showed that 0.425kg of solid waste is generated per person per day (ppd) in
Benin metropolis and 0.57kg per person per day is generated in Lagos metropolis. The study
also showed that over 20% of recyclable solid waste is generated in from domestic source of
solid waste in Nigeria. Assessment of the Solid waste management in Lagos and Benin
metropolis revealed a serious deviation from the conventional solid waste chain. The landfill
situation is in bad state as they were not prepared for sanitary landfill.Considering the results
obtained from the study there is need for urgent attention to be paid to the issues of solid
waste in Nigeria as it poses serious environmental threat.
11. References
Alam, R. Chowdhury, M.A.I, Hasan, G.M.J, Karanjit, B., Srestha, L.R. (2006): Solid waste
management in Katmandu, Capital City of Nepal Journal of Solid Waste
Technology and Management Department of Civil Engineering Widener
University Chester, U.S.A. Vol. 29, No. 4
Audu, T.O.K (2007): Recycling of Municipal Solid waste, A seminar paper delivered in the
Seminar lecture series, University of Benin. Nigeria
Integrated Waste Management – Volume II
34
Beukering, P. Van, Sarka, M., Gerlagh, R., Kumar, V. (1999), Analysing Urban Solid waste in
developing countries; a perspective on Bangalore, India, CREED working paper
series, No. 24, IIED, London and Institute for Environment Studies, Amsterdam.
Chidubem, U (2008): Municipal Solid Waste Treatment And Recycling Technologies For
Developing Countries—A Typical Nigerian Case Study Journal of Solid Waste
Technology and Management Department of Civil Engineering Widener
University Chester, U.S.A. Vol. 29, No. 4
Cointreau, Sandra J. 1982. “Environmental management of urban solid wastes in developing
countries: a project guide.” Urban Development Dept, World Bank.
Davis, M.L. and Masten, S.J. 2004: Principles of Environmental Engineering and Science,
McGraw Hill New York
Doan, Peter L. 1998. “Institutionalizing household waste collection: the urban environmental
management project in Cote d’Ivoire.” Habitat International. 22(1): 27-39.
F.R.N, (1999): Constitution of the federal Republic of Nigeria
Gerardo, B., et al (2001): Solid Waste Characterisation Study in Guadalajara Metropolitan
Zone, Mexico. Waste Management and Research, UK.
Hisashi, O and Kuala, L.M 1997: Sustainable Solid Waste Management in Developing
Countries, 7th ISWA International Congress and Exhibition, Parallel Session 7,
"International Perspective.
Hoornweg, D (1999) : What a waste, Solid Waste management in Asia, The International
Bank for Reconstruction/word Bank, Washington, USA.
Ikelegbe, O.O and Ogeah, F.N. (2003) : Perception and Response to the challenges of
Environmental sanitation Problems in Benin City and its Environs, Benin Journal
of Social Science, Vol 12, No. 2, Dec. 2003.
Lindsey, L.L & Beach, S (2000) : Sociology, Social Life and Social Issues, Prentice Hall.
Melissa Shinn, (2005): WASTE, E U Environmental Policy Hand book, pp 77-119
Ogweleka, T.C. (2003): Analysis urban solid waste in Nsuka , Nigeria. The journal of Solid
Waste technology and Management, Department of Civil Engineering Widener
University, Chester, U.S.A. Vol. 29, No. 4
Ola Oresanya (2006): Solid Waste Management In Lagos State: Problems, Prospects And
Possibilities. Paper presented as G.M. LAWMA
Palmer, P (1992) : Green Product by Design 4, U.S. Congress, Office of Technology
Assessment Washington D.C.
Rao, C.S (2006) Environmental Pollution Control Engineering. New Age International (P)
Limited, New Delhi.
Sashi, S. (2003): The urban Solid waste Mangement problem in Indian – An Economic
Approach and Frame Work for Policy. The journal of Solid Waste technology and
Management, Department of Civil Engineering Widener University Chester, U.S.A.
Vol. 29, No. 1
Seo, S, Toshiya A, Yongwoo H, and Keisuke H , 2004.: “Environmental impact of solid waste
treatment methods in Korea. Journal of Environmental Engineering. 130(1): 81-89
USEPA, (2000): Municipal solid waste in the United States, 2000 Facts and Figures.
www.epa.gov
Zavodska, A (2003): A study of residential solid waste composition and management in a
selected developing country – Guyana, The Journal of solid waste management
and technology, Department of Civil Engineering Widener University, Chester,
U.S.A. Vol.29, No. 1
3
Municipal Solid Waste
Management in Developing Countries:
Future Challenges and Possible Opportunities
Imad A. Khatib
Palestine Polytechnic University, Hebron
Palestine
1. Introduction
Most developing and least developed countries are currently facing serious development
challenges that may enhanced if same old traditional development plans are still in
persistence. In the wake of the recently emerged global economic crises development
challenges are expected to increasing as a result of the adverse impact on the capabilities of
developed countries to offer needed assistance to developing countries. Since the 1992 Rio
Earth Summit and later the adoption of the Rio Declaration and Agenda 21 and following the
declaration and adoption of the millennium development goals (MDG) in 2000 things on the
ground have not significantly improved. The United Nations’ recently released a report that
shows that most developing and least developed countries are far from reaching the MDG
targets set for the year 2015 (UN, 2010). The impacts are expected to exceed the continuous
widening of the gap between the developed and developing countries to the extent that might
badly affect sustainable development. After more than two decades from the adoption of the
notion “sustainable development”, it could be claimed the notion was portrayed in different
ways when comparing developed to developing countries. Developed countries treat
Sustainable development as an environmental concept placing the emphasis on inter-
generational equity focusing on future needs (Carter, 2001), while most developing countries
are placing emphasis on intra-generational equity focusing at present needs which are often
social and economic ones. Such different portrays played significant role in shaping the
capabilities of developing countries to meet the sustainable development challenges they are
facing and consequently in widening the gap between developing and developed nations.
In this context it is important to shed lights on major challenges facing sustainable
development in several developing countries. These could be summarized as follows:
Population growth: the Population Reference Bureau (PRB) projected the 2050 world
population to a range from 9.15 – 9.51 billion with different decrease in fertility rates in
many developing and least developed countries (Bremner et al, 2010). The largest
percentage increase by 2050 will be in Africa where population is expected to jump to
more than 2 billion. Asia with 4.2 billion will likely experience smaller proportional
increase than Africa, however this depends on China and India, where both
populations accounts for about 60% of total Asia’s pollution. Latin America and the
Caribbean are expected to experience the smallest proportional growth due to fertility
Integrated Waste Management – Volume II
36
declines in several of its largest countries, such as Brazil and Mexico. The age structure
of most countries in Africa, Asia, and Latin America favors young population at
working age that, if well managed, could be the driving force behind economic growth
prosperity or, if improperly managed, could adversely impact socio-economic growth.
The expected decrease in fertility and increase in youth will lead to the “demographic
dividend” where youth populations become older and have fewer children of that
previous generations leading to a bulge in the working age population. This represent a
window of opportunity for developing countries to save money on healthcare and
social services and to invest more on technology and capacity buildings to strengthen
economy and to cope with future aging of the population.
Public health: The World Health Organization report on World Health and MDG
(WHO, 2010) showed that over the last decades average annual mortality rate in
children under 5 years old in most developing countries has fallen by a range of
percentages from 1.7% (in Eastern Mediterranean Region), 1.8% (in Africa) to 3.8% in
south and east Asia region. Despite these encouraging trends, the report indicated
several health problems that still in persistence such as maternal mortality and
HIV/AIDS. The estimated number of death caused by malaria in 2008 is 863000 with
243 million estimated cases. Health implications due to poor sanitation facilities are
considered very serious. The same report estimated that in 2008 over 2.5 billion people
were not using proper sanitation facilities resulting in high level of environmental
contamination and exposure to risks of microbial infections. Death caused by non-
communicable diseases or injuries in developing countries totaled in 2004 to 33 million.
The absence of adequate healthcare systems will still adversely affect the public health
conditions. Health problems caused by poor hygienic and sanitation conditions require
improving and upgrading infrastructure for waste management and introducing the
integrated management approaches.
Vulnerability to climate change: the Intergovernmental Panel on Climate Change
(IPCC, 2007) defined vulnerability of people as their propensity to be harmed due to
their exposure to stresses including climate stress. It is believed that the continuous
increase emissions of greenhouse gases (GHG) several decades ago due to human
anthropogenic activities resulted in the global climate change, which turned to be the
most serious challenge facing development in the 21st century. The accumulation of
GHG emissions in the atmosphere, in particular carbon dioxide (CO
2
) and Methane
(CH
4
) is believed to be responsible for the global warming and the associate frequent
occurrence of extreme climate events. CO
2
concentration in the atmosphere has risen to
391 ppm by end 2010
1
; an increase of about 6% compared to records of 2000. The 2010
world energy statistics (BP, 2010) show that 44% of total CO
2
emission comes from 17%
of the world total population (developed nations) while the rest 83% of the world
population (developing and least developed) contributes to the rest half of the total
emissions (figure 1). climate events such as floods, storms, droughts, hurricanes, etc.,
and the rise of sea level resulted from melting of the glacier covers are also observed
(IPCC, 2007). As vulnerability to climate change is shaped by factors such as the
population dynamics and economic status as well as adaptation measures such as
appropriate norms and codes, it is likely that people in developing and least developed
countries will be more vulnerable compared to those in developed countries. Adverse
1
In
Municipal Solid Waste Management in Developing
Countries: Future Challenges and Possible Opportunities
37
direct impacts on health, land-use, agricultural productivity, water resources
availability, etc. may further heightened and indirectly impact population, economy,
and social-economic growths butting extra burdens of development processes on
developing countries.
Fig. 1. Comparison of World Population and CO
2
emission
Human development and the economical growth: the 1990 Human Development
Report states that “People are the real wealth of the nation.” (UNDP, 1990) putting
people at the center of the development process, which objective is to create an enabling
environment for people to enjoy long, healthy and creative lives. The UNDP recently
released the 2010 human development report (UNDP, 2010) which indicated that
developed countries have recorded considerable economical growth in the last four
decades compared to developing countries. The un-attainable convergence in income
between the developed and developing nations resulted in setbacks, particularly in
service such as health and education and consequently on human development and on
the sustainable development process as a whole.
2. Solid waste in developed and least developed countries in the context of
development
The last three decades witnessed the development in urban areas over rural ones in a
process called urbanization. Growth of urbanization is much more in developing countries
than the developed countries (figure 2) to the extent that it became a trend characterizing
several developed and even least developed countries. Growth in urbanization is coupled
with the growth of population living in urban areas. In e.g. China, urbanization led to
increase in urban population to about 35% percent of its total population with annual
growth in urban population of about 4%. Similarly, it is anticipated that by 2025 Asian
urban population will reach 50% of the total population; and probably more. This expected
increase will cause major shift in the distribution of the countries’ populations and will lead
to the expansion of urban boundaries (World Bank, 2003).
Integrated Waste Management – Volume II
38
Fig. 2. Population and urbanization grwoth (1990-2010)
The reality is that the growth in urbanization does not always mean improving situations,
including sectors developments. In the recently published 2010 human development report
(UNDP, 2010), indicators that describe the accessibility to water and sanitations in
developing and least developed countries are not encouraging at all. It is found that an
average of about 45% of countries’ populations are lacking proper sanitation infrastructures,
and an average of 20% are lacking proper accessibility to water. In addition, the report
showed that the percentage of populations living on degraded land is increasing to an
average that exceeds 15%. Hence, the consequence of the unplanned urbanization growth
will definitely lead to huge problems on governments especially for meeting the increasing
demand for proper and healthy municipal services. The growth will result in increase in the
quantity and complexity of the generated wastes and overburdens, including solid wastes,
and in particular municipal solid waste (MSW). MSW includes materials discarded for
disposal by households, including single and multifamily residences, and industrial waste
from canteens/restaurants and hotels and motels and from commercial and industrial
entities essentially the same as waste normally generated by households and collected and
disposed by normal municipal solid waste collection services. Such MSW is considered a
problem that having impacts on the environment and the public health if not properly
managed. Comparing conditions related to MSW management in developed and
developing countries brings indicators that quantify the problem. Considering the MSW
generated in general, its main constituents are to some extent similar throughout the world,
but the quantity generated, the density and the proportion of streams vary widely from
country to country depending mainly on the level of income and lifestyle, culture and
tradition, geographic location and dominant weather conditions. Low income countries with
yearly per capita GDP that does not exceed US$ 5000 have the lowest MSW generation rates,
which are in the range 0.3 – 0.9 kg/capita/day. The increase in per capita daily generated
waste is found linearly proportion to the per capita GDP. In high income countries it reaches
a range of 1.4 – 2.0 kg/capita/day. Figure 3 shows the linearly coupled GDP to Waste
generation rate diagram with examples from countries of low, medium, and high incomes.
Another element that characterizes differences between the generated MSW in low and high
income countries (developed and most developing countries) is the percentage composition
of MSW constituents. There, the lifestyle of peoples decisively characterizes the percentage
composition where organic waste stream and overburden form more than 50% of the total
Municipal Solid Waste Management in Developing
Countries: Future Challenges and Possible Opportunities
39
generated MSW. This is the opposite in high income countries, where lifestyle favors fewer
homes cooking, relying mainly on the readymade backed food. This is reflected in the
figures that represent the percentage of organic waste stream which does not exceed an
average of 30% of the total generated waste and that more packing material characterizes
the MSW. Figure 4 shows the differences in parentage compositions of MSW between high
income countries (developed and some developing), medium income countries (most
developing) and low incomes countries (some developing and least developed countries).
Fig. 3. Countries income and the rate of generated MSW (UNDESA, 2010)
Fig. 4. Charactersitisc of MSW streams depending on income (UNDESA, 2010)
Integrated Waste Management – Volume II
40
In urban areas of most developing and least developed countries generated MSW is at
best collected and dumped in arbitrary dump sites that mostly lack the appropriate
norms. Such disposal requires collecting, transport and dumping into the nearest open
space area. In other countries MSW is dumped into water bodies and wetland and part of
the waste is burned to reduce its volume. Such practices have their adverse environmental
impacts ranging from polluting the natural resources and the ecology to the creation of
health problems which might turn into long-term public health problems. Studies
conducted in the last decade in several developing countries showed that same old non-
environmental sound practise are still used. Although lots of significant efforts have been
done in the last few decades in many developing countries supported technically and
financially by developed countries and international organizations, substantial reforms in
the management of MSW are still not attained. This is due to the fact that frameworks
recommended where mostly similar to that adopted in developed countries but without
seriously addressing the socio-economic differences between the developed and
developing countries.
In the Middle East there are countries of high income (e.g. Saudi Arabia, UAE, Kuwait,
Qatar, and Israel) and other of middle and low income countries. The per capita rate of
generated MSW shown in figure 5 (Kanbour, 1997, Mashaa’n et al, 1997, Al-Yousfi, 2002,
METAP, 2004, Israel MEP, 2010) is rather diverse but reflects the country’s income level.
However, when looking at the percentage composition of MSW constituencies shown in
figure 6 (WH, 1995, Al-Yousfi, 2003,METAP, 2004, Israel MEP, 2010 ), it could be realized
that the major MSW stream in Arab countries of the Middle East is organic. This is
primarily due to the fact that these countries share a common lifestyle and eating habits.
Fig. 5. MSW generation rates in countries in the Middle East
Municipal Solid Waste Management in Developing
Countries: Future Challenges and Possible Opportunities
41
Fig. 6. Percentage compostion of MSW in some Middle East countries
Countries of medium and low income in southeast Asia have simillar per capita rate of
generation of MSW but they have different percentage composition of generated MSW
streatms. Figure 7 (Glawe, et al, 2005) shows the diversity compostion of MSW where
organic overburden dominates in most countries.
Fig. 7. Percentage compostion of MSW in some Asian countries
It is clear that most of the generated MSW constituencies in most developing countries
are decomposable and recyclable. If properly managed, such MSW would provide high
opportunities for the development of the socio-economy of the countries. However, the fact
Integrated Waste Management – Volume II
42
is unfortunately the opposite as the MSW remains a socio-economic that faces many
problems.
There are diversities of management options of MSW in the different developing countries.
In Egypt, which is an African Middle East Arab country 75% of the MSW is generated in
urban areas. Total estimated MSW for 2025 is expected to reach 33 million tons for a growth
rate of 3.2% based on 2001 records. Collection services cover less that 30% of urban and rural
areas and the rest are disadvantaged. A portion of 8% of the total collected MSW is sent to
compost plant but the rest is sent to dump sites scattered in the country open spaces posing
high risk to public health and the environment (METAP, 2004). This is very similar to the
situation in many developing and least developed countries of the region such as Syria,
Jordan, and the Palestinian Authority as well as countries in Southeast Asia, Africa, and
Latin America. Israel on the other side has generated in 2006 around 6 million tons of MSW
and Industrial waste from urban and rural areas. The solid waste services cover almost all
regions in the country. There are more than 15 state of the art landfills located in different
regions in addition to recycling plant where 23% of the total generated waste (i.e. 1.4 million
tons) are recycled (Israel MEP, 2010). In the Gulf Arab countries and specifically in the UAE
some 25% of the generated MSW in Dubai, Abu Dhabi, and Sharjeh is diverted to compost
plants. MSW in other emirates of the UAE is collected and sent to landfills (UAE-ME, 2006).
Particularly in Dubai more than 60% of the emitted methane is recovered.
It is clear that the main problem facing the proper management of MSW in many
developing countries are the lack of adequate administrative and financial resources. There
is no clear reliable framework by which the solid waste sector is administered from the
collection, transformation to disposing or treatment phases. This situation is usually coupled
with limited investment allocated for the MSW sector with complications of collecting or
raising proper service fees. The management activities of MSW are considered public services
which are directly controlled by governmental institutions. Such management arrangement is
considered weak as it lacks the market mechanisms, and in this case economical incentives
cannot be used to improve and develop the MSW management services.
Another related common problem is the absent of effective and comprehensive legislative
frameworks governing the solid waste sector and the inadequate enforcement mechanisms,
which are no less important than the legislations themselves. Such short comings in the
management of MSW create gabs and intensify the problems. Standards and norms are also
critical for the implementation of the legislative frameworks especially that concern the
setting, design, and operation of the landfills and the dealing with possible hazardous and
healthcare wastes. In many developing countries where financial resources exist,
shortcomings are found in both the human and organizational capacities. In Palestinian
Authority donors have spent considerable amount of funds for rehabilitating devastated
infrastructure and for providing facilities for the collection, transportation, and disposal of
solid waste but they have compromised building the needed institutional and human
capacities and raising the public awareness (Khatib and Al-Khateeb, 2009). This created a
problem that was only recently rectified as will be elaborated in the successive sections.
The last significant problem related to management of MSW is the availability of the
significant amount of accurate background data and information on the status of solid
waste, including MSW, such as rate of generation of different solid waste constituencies,
assessment of natural resources and land-use, collection and transportation needs, scenarios
of treatment, growth scenarios of solid waste which is linked to several driving forces. Data
and information are the crucial elements for developing MSW management system
including the adequate monitoring of the sector.
Municipal Solid Waste Management in Developing
Countries: Future Challenges and Possible Opportunities
43
To overcome the a.m. main problems, the following prerequisites should be addressed and
dealt with:
Institutional set up,
Human awareness and capacities,
Proper standards, laws, guidelines and norms,
Proper infrastructures,
Enabling management of the generated solid waste in an adequate approach will mitigate
any adverse impacts to the environment, natural resources, and the public health, which are
obviously the main aims of MSW management. In developed countries integral
management of MSW has reached an advanced stage where MSW are reduced in amount at
sources, i.e. before collection. This has been achieved with both, the intervention of the
available technology and the public awareness. Technology has provided better design for
the consumable products with less material in size, weight, and packaging. In addition same
technology offered the possibility of at source re-using products’ packaging. The benefits of
this integrated management approach are many, including:
Conservation of natural resources,
Reduced amount of waste to be recycled or transported to landfills or waste recycling
facilities. ,
Decreased air pollution and the production of greenhouse gases,
Reduced toxicity of waste, and
Reduced costs of waste collection and disposal.
Developed countries have also succeeded in applying different treatment and re-use
methods for the generated MSW, including; recycling, composting, and energy recovery, in
addition to the disposing of the waste in proper landfills.
It should be emphasized however, that as long as impacts of MSW are properly mitigated,
there are no overall ‘best’ or ‘worst’ approach and that the conditions in persistence and the
identified driving forces for any country; whether developed, developing or least
developed, should provide baselines for the best integrated feasible approach.
3. The integrated sustainable solid waste management approach
The integrated sustainable solid waste management (ISSWM) was first developed in mid
1980s by a Dutch NGO called WASTE
2
and further developed in 1990s by the Collaborative
Working Group on Solid Waste Management in Low- and Middle-Income Countries
3
(CWG), then it became as a norm. The ISSWM is a system approach that recognizes three
main dimensions including stakeholders, elements, and aspects. These dimensions are
shown in figure 8.
The stakeholders are the people or organizations participating in solid waste management.
This includes the waste generators who use the services, the service providers, the formal
and informal private sector dealing with solid waste management, and other local or
international institutions. Elements comprises the technical components of the waste
management system starting from the generation of solid waste then the collection, transfer
and transportation of waste to dumpsites or to treatment plant. Treatment ranges from
2
3
Integrated Waste Management – Volume II
44
Fig. 8. Integrated Solid Waste Management (Source: )
reducing the size of the generated waste to recovery of the waste, in particular the
biodegradable component that comprises more than 60% of the total municipal solid waste
generated in urban areas of the developing countries. In order that the integrated waste
management be sustainable, all required aspects, such as financial, social, institutional,
political, legal, and environmental that assesses the feasibility of the management should be
addressed in a sustainable way. The different dimensions are interrelated and their linkages
institutionally, legally, and economically enable the overall function of the system. It could
therefore, be indicated that ISSWM considers MSW management not just a technological
system with infrastructure and facilities that facilitate handling and disposal of MSW, but it
is a management system that consider and deals with many other elements including the
socio-economic settings, the physical environment and growth in public demands and
management scenarios.
Several principles of ISSWM were extensively based on contributions of many authors (i.e.
Moreno et al., 1999, Coffey, 1996, Schuebeler et al., 1996, van Beukering et al., 1999). These
could be summarized based on figure 8 as follows:
Technological and operational principals should be adapted to the physical setting,
local environment, and land use, of the region. Efficient technology should be
preferably a local efficient technology that reliably provide spare parts and efficient
O&M,
Environmental and health principles that ensure that any technical setting is clean with
the minimal impact on the environment and its elements. This is attained by following
the waste management hierarchy preferring options that promote waste reduction and
separation at sources,
Financial principles should ensure “all beneficiaries contribute principle” in which fees
are collected for the services and in return relevant government institution contributes
Municipal Solid Waste Management in Developing
Countries: Future Challenges and Possible Opportunities
45
by allocating revenues to MSW. Financial principles should ensure highest productivity
of labor relying of capital intensive system and not on labor intensive. Full cost recovery
should also be considered,
Socio-economic principles that permit public in all regions to receive adequate and
affordable management system without any adverse health impacts while
acknowledging the different economical incomes of beneficiaries,
Administrative principles necessitate building the capacities of the personal involved in
the management of MSW, in addition to encouraging the involvement stakeholders in
the planning and implementation of the management activities,
Policy and legal framework principles, that while support decentralizing of relevant
authorities and finance they, at the same time, encourage the involvement of
stakeholders including non-governmental organizations and the private sector.
4. Palestinian authority and the newly adopted ISSWM
Palestinian Authority (PA) is considered as a developing entity having many in commons
with other developing countries. It is only after the emerging of the PA that development in
the Palestinian territories started taking place although it has been heavily retarded after the
Israeli re-occupation of the Palestinian areas in 2002 in response to Palestinian second
Intifada (Uprising). The solid waste sector is managed by different institutions. In towns and
villages, municipalities and village councils are providing the services whereas in refugee
camps the United Nations Relief and Works Agency (UNRWA) is taking care of the services.
The long-term occupation with its daily harsh measures against Palestinians and their
infrastructure have exerted heavy burden on the PA and other responsible institutions for
launching a complete development process. In 2009 and with the help of donor countries
and institutions, the PA has started preparing its first strategy for integrated solid waste
management while facing huge challenges similar to those facing other developing
countries and mentioned previously in the chapter. Although the Europeans and World
Banks have both supported the sector over the period 1994 until 2010 with a total of US$
72.274 million (Palestinian Authority, 2010) very little progress has been witnessed. This is
due to the fact that the Israeli military incursions into PA areas after 2002 and through
until 2006 has left a devastated infrastructure, let alone the Israeli occupation closure
policies which prohibit people commuting among Palestinian communities. After 2006
money has been spent as previously mentioned on rehabilitating the destroyed
infrastructure and for providing the required facilities but without building the needed
institutional and human capacities.
In the effort to describe the solid waste status in the PA, a survey study was conducted in
2002 and 2008 (khatib and Al-Khateeb, 2009) which showed that the daily average per capita
generated municipal solid waste is in the range 0.5 – 0.9 kg. This average takes into account
communities living in urban, rural, and refugee camps. It was found also that solid waste
consists mostly of biodegradable organic waste, a characteristic that agrees well with studies
done for other similar developing countries (El-Edghiri, 2002). Later in 2009 same
characteristics were reaffirmed by the Palestinian Central Bureau of Statistics (PCBS) which
further suggested an annual generated solid waste of one million tons in the PA area.
Due to the importance of the sector on the development process, the PA has in 2009 declared
the solid waste management sector as a national priority and therefore, issued the guiding
principles for the Palestinian ISSWM which are:
Integrated Waste Management – Volume II
46
The principle of sustainable solid waste management that ensures optimal use and
protection of the environment,
Clarity of roles and responsibilities and separation between regulatory, monitoring, and
executive duties,
Facilitated availability of information and the transport exchange among stakeholders
involved,
Transparency of institutional, financial, monitoring, and administration systems,
Partnership based on integrity and clarity of roles of each stakeholder,
Recognition of private formal and informal and NGO sectors,
Transparency in dealing with public complaints,
Principles of “polluter pays” and “Producer pays”
Principle of self funding and providing services at reasonable prices,
Principle of economy scale in planning and developing the services,
Gradual implementation of initiatives technologies, and new models related to solid
waste elements; i.e. reduction, recycling etc.
Creating incentives to encourage successful practices,
Compatibility of technology and facilities used in the solid waste management to local
conditions and needs,
Penalty system against parties that do not adhere to appropriate procedures in dealing
with solid waste.
These guiding principles where considered in the prepared strategy and where impeded
while defining the Palestinian ISSWM strategic objectives, which are:
An effective legal and organization framework for solid waste services,
Strong and capable institutions,
Effective and environmentally-safe management of solid waste services,
Financially viable and efficient management services and activities,
Principles and mechanisms suitable for managing medical, hazardous and special
wastes,
More participating and aware community,
Effective information and monitoring systems.
The implementation of the Palestinian ISSWM has been launched and hopefully the scenario
which favors political stability will prevail to ensure the expected outcomes.
5. Conclusion
Developing and least developed countries have no alternative but to plan for a sustainable
development processes acknowledging the importance of encountering the problems in
persistence and facing the development challenges with an active participation of
stakeholders including the public. With the growth in urbanization MSW services is
becoming one of the most challenges which if not properly and sustainably dealt with will
adversely impact all other development sectors. The best approach for dealing with solid
waste sector is by implementing an integrated and sustainable management approach that
ensures the good health of the society and the environment and the active participation of
the society. An example of implementing the ISSWM approach has recently been initiated
by the Palestinian Authority and if political atmosphere permits the adequate
implementation of the ISSWM strategy feedback would be of most beneficial to many
developing and least developed countries.
Municipal Solid Waste Management in Developing
Countries: Future Challenges and Possible Opportunities
47
6. References
Al-Yousfi A. (2002) Regional Perspectives of Hazardous Waste Management in Developing
Countries, In: Proceedings of Oman International Conference on Wastes
Management – 2002, United Nations Environment Program (UNEP), Regional
Office for West Asia (ROWA).
Al-Yousfi, A.B. (2003) Environmentally Sound Technologies (EST) for Designing and
Operating Solid Wastes Landfills, In: Proceedings of International Conference on
Wastes Management and Pests Control, Muscat Municipality-Oman, 2003, United
Nations Environment Program (UNEP), Regional Office for West Asia (ROWA).
Bremner J., Frost A., Haub C., Mather M., Ringheim K., and Zuehlke E. (2010) “World
Population Highlights: Key findings from PRB’s 2010 World Population Data
Sheet”, Population Bulletin, 65, 2, Population Reference Bureau Publicaions
British Petroleum (2010) “BP Statistical Review of World Energy – June 2010”, BP
Publications, 2010
Beukering, P., Sehker, M., Gerlagh R. and Kumar V. (1999) Analysing urban solid waste in
developing countries: a perspective from Bangalore, India. Working Paper no. 24.
CREED
Carter N. (2001) “The Politics of the Environment”, Cambridge University Press, UK
Coffey, M. (1996) Guidelines for solid waste management for developing countries, A
manual prepared for UNCHS, Nairobi, Kenya.
El-Edghiri, T. (2002) Evaluation of Quality and Composition of Rich Organic Solid Waste in
Developing Countries (Morocco), and Comparison with Europe, Challenges to
Organic Farming and Sustainable Land Use in the Tropics and Subtropics,
Deutscher Tropentag, Witzenhausen, Germany
Glawe U., Visvanathan M. and Alamgir A. (2005) Solid Waste Management in Least
Developed Asian Countries – A Comparative Analysis, In: Proceedings of the
International Conference on Integrated Solid Waste Management in Southeast
Asian Cities, 507 July, Siem Reap, Cambodia.
Intergovernmental Panel of Climate Change (2007) “The AR4 Synthesis Report 2007-
Summary for Policy Makers”, Cambridge University press, UK
Israel Ministry of Environmental Protection (2010) Solid Waste Management Division –
Kanbour, A. (1997) General Status on Urban Waste Management in West Asia, UNEP-
ROWA Regional Workshop, United Nations Environment Program - Regional
Office for West Asia, 1997.
Khatib I. and Al-Khateeb N. (2009) Solid Waste Treatment Opportunities in Palestinian
Authority Areas, Waste Management, 29, 5, 1680-1684
Mediterranean Environmental Technical Assistance Program (2004) Regonal Solid Waste
Management Project in Mashraq and Maghreb Countries – Country Report on
Solid Waste Management (Egypt), The World Bank, METAP, 2004
Mashaa’n, M.A., Ahmed, F.M. (1997) Environmental Strategies for Solid Waste Management
- Future Outlook of Kuwait until 2000 and Other States Experiences, 1
st
Edition,
1997.
Moreno, J., Rios, F. and Lardinois I. (1999) Solid waste management in Latin America: the
role of micro- and small enterprises and co-operatives. IPES/ACEPESA/WASTE.
Urban Waste Series no. 5
Integrated Waste Management – Volume II
48
Palestinian Authority (2010) National Strategy for Solid Waste management in the
Palestinian Territories 2010 – 2014, May 2010, Palestinian Authority
Schuebeler, P., Wehrle K. and Christen J. (1996) Conceptual framework for municipal solid
waste management in low-income countries, Working Paper no. 9. UMP
(UNDP/UNCHS/World Bank) and SDC (Swiss Agency for Development and Co-
operation). St. Gallen, Switzerland
UAE Ministry of Energy (2006) Initial National Communication to the United Nations
Framework Convention on Climate Change, United Arab Emirates
United Nations Development Program (1990) Human Development Report 1990, UNDP
Publications
United Nations (2010) “The Millennium Development Goals Report 2010”, United Nations
Publications
United Nations Department of Economic and Social Affairs (2010) Trends in solid waste
management: issues, challenges, and opportunities, International Consultative
Meeting on Expanding Waste Management Services in Developing Countries (Final
Draft), 18-19 March 2010, Tokyo, Japan.
United Nations Development Program (2010) “Human Development Report 2010”, UNDP
World Health Organization (1995) Solid Waste Management in Some Countries-
Environmental Dimensions of Waste Disposal, WHO Publications, 1995.
World Health Organization (2010) “World Health Statistics 2010”, WHO Publications
World Health Organization (2010) Accelerating progress towards the health-related
Millennium Development Goals, WHO Publication, WHO/GGO/2010.2.
4
International Practices in Solid
Waste Management
Rafia Azmat
Department of Chemistry, Jinnah University for Women
Pakistan
1. Introduction
Emergent urbanization and changes in the pattern of life, give rise to generation of
increasing quantities of wastes and it’s now becoming another threat to our already
degraded environment. However, in recent years, many programs were undertaken for the
control of urbanization gift in the world because the dumping of industrial wastage without
proper treatment, responsible for the lowering of a soil fertility, which increases the
amassing of essential and non essential trace metals in the plants. On the other hand
domestic waste management in a soil and aquatic resources are also accountable for the
reduced field productivity. At this time the world is now facing an extreme situation of
waste management from both the side i-e from industrialization and municipal waste
management especially in a under developing countries. There is a need to address both
problems in such a way that there should be resolution which can give proper management
of both kind of waste. For this purpose public awareness about the waste management can
play a crucial rule in controlling the waste of both the sides.
One of which waste-to-energy technologies have been developed to produce clean energy
through the combustion of municipal solid waste in specially designed power plants
equipped with the most modern pollution control equipment to clean emissions. Other
waste management includes recycling of waste into fertilizers for use agriculture which is a
common practice of waste management. The recycling of hazardous industrial wastes into
fertilizers introduces several dozen toxic metals and chemicals into the nation's farm, lawn
and garden soils, including such well-known toxic substances as lead and mercury. Many
crops and plants extract these toxic metals from the soil, increasing the chance of impacts on
human health as crops and plants enter the food supply chain. The report based on the use
of recycle fertilizers from waste in agriculture industry represent the highly toxic
substances found by testing fertilizers, as well as the strict regulations needed to protect
humans and the environment from these toxic hazards.
Between 1990 and 1995, 600 companies from 44 different states sent 270 million pounds of
toxic waste to farms and fertilizer companies across the country [ (1) Shaffer 1998]. The steel
industry provided 30% of this waste. Used for its high levels of zinc, which is an essential
nutrient for plant growth, steel industry wastes can include lead, arsenic, cadmium,
chromium, nickel and dioxin, among other toxic substances. Although the industrial
facilities that generate these toxic wastes report the amount of chemicals they transfer off-
site to the U.S. Environmental Protection Agency’s (U.S. EPA) Toxics Release Inventory
Integrated Waste Management – Volume II
50
every year, they only report the total amount of a given chemical contained in wastes
transferred over the course of a year, making it difficult to determine the chemical make-up
of a given waste shipment. With little monitoring of the toxics contained in fertilizers and
fertilizer labels that do not list toxic substances, our food supply and our health are at risk.
2. Tested fertilizers contain harmful toxic metals
California Public Interest Research Group (CALPIRG) Charitable Trust and Washington’s
Safe Food and Fertilizer tested 29 fertilizers from 12 states (2) for 22 toxic metals. This report
documents the results of these fertilizer samples, demonstrates that the problem of toxic
fertilizers is widespread, and details concerns with proposed regulations for the practice.
3. Toxic fertilizers threaten human health
The toxic substances found in the tested fertilizers have been linked to adverse human
health impacts. The metals found in these fertilizers are known or suspected carcinogens,
reproductive and developmental, liver, and blood toxicants. For example, beryllium is a
suspected carcinogen, chromium and arsenic are known to cause cancer and barium can
cause kidney and lung damage. Children are most susceptible to the toxic effects of most
metals, especially lead, which has been the subject of intense government efforts to reduce
lead exposure to children. Products like fertilizer are of great concern as children spend
more time on or near the ground and are often exposed to ground level substances through
hand-to-mouth behavior(3-5).
4. Toxic fertilizers pressure agricultural soils, food safety and waterways
As demonstrated in this report, the tested fertilizers contain toxic substances at high levels.
These substances can accumulate in agricultural soils, become available for plant uptake,
and run off into waterways (5).
5. Agricultural soil quality
Farming, especially single-crop farming, requires consistent and dependable soil conditions.
The introduction to farm soils of toxic substances like lead and cadmium can adversely
affect growing conditions and result in increased toxic accumulation as these metals are
highly persistent in soils. This can negatively affect critical growing requirements, such as
soil acidity or the solubility of beneficial metals like zinc in the soils.
6. Plant uptake
Some crops are more likely than others to absorb non-nutrient toxic substances from soils.
For example, fruits and grains can absorb lead, and lettuce, corn and wheat can absorb
cadmium from soils. This means that our food supply is at risk of contamination by toxic
substances that could threaten human health.
7. Water quality
The overall health of the nation’s waterways has declined dramatically over the last quarter-
century. Forty percent of our rivers, lakes, and estuaries are still too polluted for safe fishing