Novel Applications of the UWB Technologies Part 9 potx
Bạn đang xem bản rút gọn của tài liệu. Xem và tải ngay bản đầy đủ của tài liệu tại đây (791.71 KB, 30 trang )
UWB Cognitive Radios 17
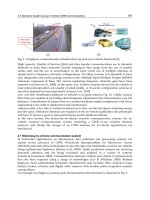
Fig. 12. Cooperative spectrum sensing with cognitive base station.
where P
D
(k) and P
FA
(k) are the detection and false alarm probabilities respectively for the
local sensing performance at the k
th
cognitive radio node. The fusion rule at the cognitive
base station can be varied depending on the design requirements. One could also consider the
logical ’AND’ rule or in general the L out-of-K rule where you decide upon the presence of the
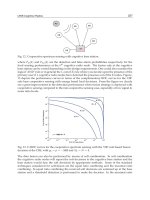
primary user if L cognitive radio nodes have detected the presence out of the K nodes. Figure-
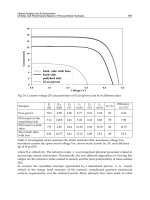
13 depicts the performance curves in terms of the complementary ROC curves for the ’OR’
rule base cooperative sensing with energy based local decisions. From the figure we clearly
see a great improvement in the detection performance when fusion strategy is deployed with
cooperative sensing compared to the non-cooperative sensing case, especially at low signal to
noise ratio levels.
10
−6
10
−5
10
−4
10
−3
10
−2
10
−1
10
0
10
−6
10
−5
10
−4
10
−3
10
−2
10
−1
10
0
Prof of False Alarm
Prof of Miss Detection
K = 7
K = 5
K = 2
K = 1
ρ = −5dB, N = 4
Fig. 13. C-ROC curves for the cooperative spectrum sensing with the ’OR’ rule based fusion
decision at the CBS, with ρ
k
= ρ = −5dB and N
k
= N = 4.
The data fusion can also be performed by means of soft combination. In soft combination
the cognitive radio nodes will report the soft decisions to the cognitive base station and the
base station would fuse the soft decisions by appropriate methods. Some of the standard
techniques considered for soft-fusion are the equal ratio combining and the maximal ratio
combining. In equal ratio combining the received soft decisions are summed up at the base
station and a threshold detection is performed to make the decision. In the maximal ratio
227
UWB Cognitive Radios
18 Will-be-set-by-IN-TECH
combining the soft decisions from the k
th
cognitive radio node is weighted appropriately
based on its credibility for example and then summed up before performing the threshold
detection.
5.6.2 Distributed spectrum sensing
The other collaborative technique in spectrum sensing is the distributed sensing method
(Bazerque, J.; Chen, Y.). In distributed sensing unlike in the cooperative sensing there is
no fusion center to perform the data fusion. Instead the locally sensed data are exchanged
between the cognitive radio nodes themselves in the environment and the cognitive radio
nodes will perform the fusion locally with the collected information. The information
exchange between the cognitive radios can be by means of broadcasting or by means one
to one transmissions. Figure-14 depicts an example of the collaborative sensing strategy.
Similar to the cooperative sensing case, here too the local sensing can be performed by one of
the proposed techniques for spectrum sensing in the previous sections. Instead of performing
the data fusion at the base station as in the cooperative sensing strategy it is performed at the
cognitive radio nodes itself in this case. The major advantage associated with distributed
sensing is the non-requirement of a central fusion center and the corresponding feedback
reporting channel from the base station to the cognitive radio nodes. However, distributed
sensing increases the overhead at the nodal level by requiring to perform the data fusion and
data management etc.
Fig. 14. Distributed spectrum sensing without a centralized fusion center.
6. Interference mitigation with detect-and-avoid techniques
The interference mitigation problem can be classified as interference caused to the cognitive
radio nodes from the primary users as well as the secondary users and the interference caused
by the cognitive radio nodes to the primary users and other secondary users. The interference
actually depends on the geographical positioning of the radio nodes (that is the distance
between the nodes), the transmit signal power from a particular node, and the channel gains
of the links etc. In this section we briefly touch upon interference mitigation by means of
detect-and-avoid in MB-OFDM UWB radios.
As described in the previous sections, there is a potential risk for wireless interferences of
UWB technology with other wireless devices; in particular with WiMAX Customer Premise
Equipment (CPE). In (Rahim, A et. al.) and (Li, Y. et. al.) the coexistence and interference
issues mentioned here have been investigated to some extent. To address the risk of
228
Novel Applications of the UWB Technologies
UWB Cognitive Radios 19
Fig. 15. Detect and Avoid of an UWB device to avoid interference to a WiMAX primary
wireless service
interference of UWB on other wireless services, regulatory bodies around the world have
defined stringent limits for the emission power of UWB devices. In most cases the limit is
given as an Equivalent Isotropically Radiated Power (EIRP) emission mask. EIRP emission
mask was defined by the FCC in 2002, the European Union in 2006, China in 2008, Japan
in 2006 and Korea in 2006. The disadvantage of the EIRP mask is that UWB transmission
power is limited even in the absence of WiFi or WiMAX communication. A more flexible
approach is to allow higher emission power for UWB devices when no other wireless system
is transmitting within the same coverage area.
In this case an opportunistic approach could be used, where secondary users (e.g., UWB
devices) are required to detect the transmission of primary users in specific spectrum bands
and consequently refrain from transmitting in those bands or reduce their emission power.
In the case of UWB, this approach is also named Detect and Avoid (DAA) as UWB devices
should Detect the presence of a primary user (e.g., WiMAX) in the radio frequency spectrum
environment and use other frequency bands for the transmission to Avoid creating interference
to the primary user (see Figure-15). In this context, UWB DAA can be considered a simple
form of cognitive radio.
Regulations for the use of the DAA mitigation techniques for UWB are different around the
world. In Europe, the regulation for generic UWB devices (i.e., not specifically DAA enabled)
is composed of two ECC Decisions: the baseline Decision ECC/DEC/(06)04 (ECC Decision,
2006), which defines the European spectrum mask for generic UWB devices without
the requirement for additional mitigation and Decision ECC/DEC/(06)12 (ECC Decision,
2006), recently amended by (ECC Decision, 2008), which provides supplementary mitigation
techniques such as Low Duty Cycle (LDC) or DAA. The related European Commission
decision is 2009/343/EC (EC Decision, 2009).
In USA, FCC (FCC Part47-15, 2007) has opened the 3.1 - 10.6 GHz frequency band for the
operation of UWB devices provided that the EIRP power spectral density of the emission is
lower than or equal to -41.3 dBm/MHz. FCC regulations do not specify the use of mitigation
techniques for UWB devices operating in the mentioned frequency range.
In China Mainland, in the 4.2-4.8 GHz band, the maximum EIRP is restricted to -
41.3dBm/MHz by the date of 31st Dec, 2010. After that, the UWB devices shall adopt an
229
UWB Cognitive Radios
20 Will-be-set-by-IN-TECH
Interference Relief Technology, such as DAA. There are no specific parameters or limit values
for DAA in the current Chinese UWB regulation specification.
In Japan, in the 3.4 to 4.8 GHz frequency range, UWB devices without interference avoidance
techniques such as DAA may not transmit at a level higher than -70 dBm/MHz. In the 3.4 to
4.2 GHz band, UWB devices may transmit at or below the limit of -41.3 dBm/MHz, under the
condition that they are equipped with interference avoidance techniques such as DAA. In the
4.2 to 4.8 GHz band, UWB devices shall adopt an interference avoidance technique after 31st
Dec, 2010.
In Korea, the UWB emission limit mask requires the implementation of an interference
avoidance technique such as DAA in the 3.1 to 4.2 GHz and 4.2 to 4.8 GHz bands to provide
protection for IMT Advanced systems and broadcasting services. The requirements in the 4.2
to 4.8 GHz band shall be implemented after 31st Dec, 2010.
In Hong Kong, the proposed rule is, based on the 33rd Radio Spectrum Advisory Committee
(RSAC) Meeting discussion, to allow a maximum EIRP of -41.3 dBm/MHz in the 3.4 to 4.8
GHz band, provided that appropriate mitigation techniques are employed. Otherwise the
maximum EIRP is restricted to -70 dBm/MHz.
In Europe, references (ECC Report 120, 2008) and (EC Decision, 2009) identify three types of
victim systems to be protected by DAA mechanisms: 1) BWA Indoor terminals in the 3.4 - 4.2
GHz range, 2) Radiolocation systems in the 3.1 - 3.4 GHz range and 3) Radiolocation systems
in the 8.5 - 9 GHz range.
The DAA mitigation techniques are based on the concept of coexistence zones which correspond
to a minimum isolation distance between an UWB device and the victim system. For each
DAA zone, in conjunction with the given minimum isolation distance, the detection threshold
and the associated maximum UWB transmission level are defined based on the protection
zone the UWB device is operating within. In the frequency range 3.4 - 4.2 GHz, three zones
are defined on the basis of the detected uplink power of the victim signal: Zone 1 with a
detection threshold for the uplink victim signal of -38 dBm. In this zone, the UWB device is
required to reduce its emission level in the victim bands to a maximum of -80 dBm/MHz. As
an alternative, the UWB device is allowed to move to a non-interfering channel. Zone 2 with
an uplink detection threshold of -61 dBm. In this zone, the UWB device is required to reduce
its emission level to a maximum of -65 dBm/MHz. As an alternative, the UWB device is
allowed to move to a non-interfering channel. Zone 3 where the UWB device does not detect
any victim signal transmitting with a power greater than -61 dBm. In this case, the UWB
device is allowed to continue transmitting at maximum emission level of -41.3 dBm/MHz.
Figure-16 provides a description of the different protection zones:
Reference (ECC Report 120, 2008) provides flowcharts for the implementation of the DAA
algorithm as represented in Figure-17.
The flowcharts and detection algorithms are implemented on the basis of the following
parameters:
• Minimum Initial Channel Availability Check Time, which is the minimum time the UWB
device spends searching for victim signals after power-on.
• Signal Detection Threshold, which is the victim power level limit, employed by the UWB
device in order to initiate the transition between adjacent protection zones.
• Avoidance Level, which is the maximum Tx power to which the UWB transmitter is set for
the relevant protection zone.
• Default Avoidance Bandwidth, which is the minimum portion of the victim service
bandwidth requiring protection.
230
Novel Applications of the UWB Technologies
UWB Cognitive Radios 21
Fig. 16. Protection zones for DAA UWB devices
Fig. 17. Workflow of Detect and Avoid for three protection zones
• Maximum Detect and Avoid Time, which is the maximum time duration between a change
of the external RF environmental conditions and adaptation of the corresponding UWB
operational parameters.
• Detection Probability, which is the probability for the DAA enabled UWB device to make
a correct decision either due to the presence of a victim signal before starting transmission
or due to any change of the RF configuration during UWB device operation.
231
UWB Cognitive Radios
22 Will-be-set-by-IN-TECH
These parameters are also dependent on the type of communication service provided by the
primary user. For example, UWB devices have different DAA times for different services (e.g.,
VoIP, Web surfing, Sleep mode, Multimedia broadcasting) of the primary user (e.g., Broadband
Wireless Access).
In UWB networks, devices can negotiate detection capability and share detection information.
For example, if one device is sending a large file to another device, it is possible for the
receiving device to be the primary detecting device. DAA UWB network can implement smart
detection algorithms where the most capable or powered devices can implement the detection
of the primary users and distribute this information to the less capable devices.
7. Localization and radio environment mapping
For the cognitive radio nodes to perform its functionalities properly it needs to have context
aware capabilities such as the spectrum sensing capability. Another context aware mechanism
to support the intelligence of the cognitive radio is locating radios in the network (Giorgetti,
A.). By means of localizing the radios in the network the cognitive radio node can create a
map of radios which would help to perform its functionalities better. For example, knowing
the location of the primary user nodes can become beneficial when considering directional
transmissions for maximizing the spatial re-usage of the spectrum.
Another means getting context awareness is by means of radio environment maps. The term
radio environment map or REM refers to a database of the radio environment, which can be
locally maintained in a node or in a network where all the nodes could access it. A cognitive
radio node in a network can get its intelligence by means of sensing or extracting information
from the REM. The REM itself need to be updated periodically by means of sensing and
learning operations. The advantage of maintaining a network level REM is that not all the
nodes need to perform sensing on its own but rather get information from the REM and
hence reducing the complexity of the cognitive radio node. A typical REM would contain
information about the radio nodes in the vicinity and the related radio and network resources
such as frequency channels, data rates, center frequency, location information, which network
the node belongs to, what services the node offers, the regulatory and policy details of the
nodes, and the nodes historical behavior etc. Getting and maintaining all the information
about the nodes in the environment is not always feasible in which case the REM will contain
only the information that are available. By using such REM data bases communication
networks can be made much efficient especially considering wireless networks. However,
many technical aspects related to the design and deployment of REM need to be addressed.
For example, how often the information need to be updated in the REM, how much and what
information required to be stored, what are the overheads in having such REM for maintaining
and distributing the information, and finally the security and privacy requirements for the
REM.
8. Scenarios and applications for UWB based CR
Finally, we present some application scenarios for the use of UWB based cognitive radios. The
scenarios that we present here are derived from the two EU projects C2POWER (C2POWER,
2010) and EUWB (EUWB, 2008). The scenarios that we provide are for dynamic spectrum
access (EUWB scenarios) as well as for energy efficient communications (C2POWER scenario).
Scenario-1: UWB based cognitive radios are considered for home entertainment where UWB
based multimedia devices such as a hi-fi surround system with audio/video transmissions
232
Novel Applications of the UWB Technologies
UWB Cognitive Radios 23
could utilize the DAA techniques. In such an environment the UWB devices need to be aware
of the 5GHz ISM band devices, WiMAX devices in 3.6GHz etc.
Scenario-2: UWB based cognitive radios are considered for airborne in-flight transmissions
such as for audio/viedo delivery to the passengers. In such scenarios the UWB radios need
to be aware of any custom built radios within the UWB frequency band for flighth specific
applications and as well as any satellite receivers in the UWB frequency range.
Scenario-3: UWB based cognitive radios are considered for vehicular communications such
between sensors and the central unit. In such situations the UWB radios need to be aware of
the surrounding radios in order to avoid interference and at the same time make sure that its
time critical transmissions are also not interfered with.
Scenario-4: UWB radios can also be used for energy saving in short range wireless
communications. Given the favorable channel conditions a source node may opt to
communicate to its destination by means of a relay node for better energy efficiency
(C2POWER, 2010). In such context UWB radios with intelligence (i.e. UWB based cognitive
radios) can play a prominent roll.
9. Conclusion
In this chapter we provided the concept and fundamentals of UWB based cognitive radios
for having intelligence in the standard UWB radios. By having cognition in the UWB devices
the transmissions could be dynamically adopted in order to improve the performance. The
intelligence in the radio leads to a better usage of the radio resources such as the radio
spectrum by having dynamic spectrum access capabilities in the spatio-temporal domain. The
cognitive engine residing in the UWB radio learns about its surrounding and acts based on the
internal and network level policies.
Even though the cognitive radio technology shows prominent advantages yet many issues
are to be solved prior to its deployment, various standardization and regulatory activities are
currently underway in order to regulate the dynamic spectrum access and cognitive radio
technology.
10. Acknowledgement
This work was partly funded by the European Commission under the C2POWER project (EU-
FP7-ICT-248577) - , and the EUWB project (EU-FP7- ICT-215669) -
.
11. References
Atapattu, S., Tellambura, C., and Jiang, H., (2010), ’Performance of an Energy Detector
over Channels with Both Multipath Fading and Shadowing’, IEEE Transactions on
Wireless Communications, Vol.9, No.12, Dec 2010, pp3662-3670
Aysal, T., C., Kandeepan, S., and Piesiewicz, R., (2009) ’Cooperative spectrum sensing with
noisy hard decision transmissions,’ in IEEE Conf ICC, 14-18June 2009, Dresden.
Bazerque, J., A., and Giannakis, G., B., (2010), ‘Distributed Spectrum Sensing for Cognitive
Radio Networks by Exploiting Sparsity,’ IEEE Trans. on Signal Proc.,vol.58,no.3,pp.
1847–1862, March 2010.
C2POWER Project (2010), The European Commission funded STREP Project ’C2POWER’ (EU-
FP7-ICT-248577) - , 2010
233
UWB Cognitive Radios
24 Will-be-set-by-IN-TECH
Chen, Y., Zhao, Q., and Swami, A., (2009), ‘Distributed Spectrum Sensing and Access in
Cognitive Radio Networks With Energy Constraint,’ IEEE Trans. on Signal Proc.,vol.
57, no. 2, pp. 783–797, Feb. 2009.
Digham, F.,F., Alouini, M., S., and Simon, M., K., (2007), ‘On the Energy Detection of Unknown
Signals over Fading Channels,’ IEEE Trans. on Communications., vol. 55, no. 1, pp. 21–
24, Jan. 2007.
EC-The Commission of the European Communities (2007), Commission Decision
2007/131/EC on allowing the use of the radio spectrum for equipment
using ultra-wideband technology in a harmonised manner in the Community,
Official Journal of the European Union, Feb. 21, 2007. url: http://eur-
lex.europa.eu/LexUriServ/site/en/oj/2007/l_055/l_05520070223en00330036.pdf
’2009/343/EC’ Decision amending Decision 2007/131/EC on allowing the use of the radio
spectrum for equipment using ultra-wideband technology in a harmonised manner
in the Community.
’ECC/DEC/(06)04 ECC’ Decision of 24 March 2006 on the harmonised conditions for devices
using Ultra-Wideband (UWB) technology in bands below 10.6 GHz.
’ECC/DEC/(06)12’ ECC Decision of 1 December 2006 on the harmonised conditions for
devices using Ultra-Wideband (UWB) technology with Low Duty Cycle (LDC) in
the frequency band 3.4-4.8 GHz.
ECC Report 120 ( June 2008) on Technical requirements for UWB DAA (Detect And Avoid)
devices to ensure the protection of Radiolocation in the bands 3.1 - 3.4 GHz and 8.5 -
9 GHz and BWA terminals in the band 3.4 - 4.2 GHz.
ECC Decision of 1 December 2006 amended 31 October 2008 on supplementary regulatory
provisions to Decision ECC/DEC/(06)04 for UWB devices using mitigation
techniques
ETSI Technical Specification ETSI TS 102 754. v.1.2.1 (2008-10). "Electromagnetic compatibility
and Radio Spectrum Matters (ERM); Short Range Devices (SRD); Technical
Characteristics of Detect and Avoid (DAA) mitigation techniques for SRD equipment
using Ultra Wideband (UWB) technology.
EUWB (2008), The European Commission funded Integrated Project (EC: FP7-ICT-215669):
.
FCC (2002) ’Federal communications commission: spectrum policy task force report,’ Federal
Communications Commission ET Docket 02-135, November 2002.
FCC-Federal Communications Commission (2003), Facilitating Opportunities for Flexible,
Efficient, and Reliable Spectrum Use Employing Cognitive Radio Technologies,
NPRM and Order, ET Docket no. 03-322, Dec. 2003.
FCC CFR Title 47 Part 15 Subpart F, "Ultra-Wideband Operation". Federal Communications
Commission, October, 2007.
Fette, B., (Edt) (2006), ’Cognitive Radio Technology’, Elsevier Publishers, 2006.
Haykin, S. (2005), ’Cognitive Radio: Brain-Empowered Wireless Communications,’ IEEE
Journal on Select Areas in Commun., vol. 23, no. 2, pp. 201 - 220, Feb. 2005.
Ganesan, G., and Ye Li (2007), ’Cooperative Spectrum Sensing in Cognitive Radio, Part I:
Two User Networks’, IEEE Trans on Wireless Communications Vol6, Iss6, June 2007
p:2204-2213
Gardner, W., A., (1991),’Exploitation of spectral redundancy in cyclostationary signals’, IEEE
Signal Processing Magazine,Vol8,Iss2,Apr1991,pp14-36
234
Novel Applications of the UWB Technologies
UWB Cognitive Radios 25
Giorgetti, A., Chiani, M., Dardari, D., Minutolo, R., and Montanari, M., (2007),
’Cognitive radio with ultra-wide bandwidth location capable nodes,’ IEEE Military
Communications Conference, Orlando, FL, Oct. 2007, pp. 1-7.
Gu, H., and Yang, C., (2008), ’Power and Admission Control for UWB Cognitive Radio
Networks,’ IEEE ICC, 19-23 May, 2008, Beijing.
Hossain, E., Niyato, D., and Han, Z. (2009), Dynamic Spectrum Access and Managament in
Cognitive Radio Networks, Cambridge University Press, 2009.
Kandeepan, S. et. al (2009), Project Report-’D2.1.1:Spectrum Sensing and Monitoring’, EUWB
Integrated Project, European Commission funded project (EC: FP7-ICT-215669), May
2009, , .
Kandeepan, S., Baldini, G., and Piesiewicz, R., ’Experimentally Detecting IEEE 802.11n Wi-
Fi Based on Cyclostationarity Features for Ultra-Wide Band Cognitive Radios’, IEEE
Personal Indoor and Mobile Radio Communications (PIMRC) conference, Sep 2009,
Tokyo
Kay, S., (2006), ’Intuitive Probability and Random Processes using Matlab,’ Springer, New
York 2006.
Kyouwoong, K., Akbar, I., A., Bae, K., K., Jung-sun Urn, Spooner, C., M., Reed, J., H., (2007),
’Cyclostationary Approaches to Signal Detection and Classification in Cognitive
Radio’, IEEE International Symposium on New Frontiers in Dynamic Spectrum
Access Networks (DySPAN), 17-20 April 2007 pp212-215, Dublin.
Li, Y., Rabaey, J., Sangiovanni-Vincentelli, A., "Analysis of Interference Effects in MB-OFDM
UWB", IEEE Wireless Communications and Networking Conference 2008 (WCNC
2008), April 2008.
Mishra, S., M., Sahai, A., and Brodersen, R., (2006), ’Cooperative sensing among coginitive
radios,’ in IEEE Conf ICC, Istanbul, June 2006.
Mitola, J. & Maguire Jr, G. (1999), ’Cognitive Radio: Making Software Radios More Personal,’
IEEE Personal Communications, vol. 6, no. 4, pp. 13- 18, Aug. 1999.
Radunovic, B., and Le Boudec, J., (2004), ’Optimal Power Control, Scheduling, and Routing in
UWB Networks ,’ IEEE Journal On Selected Areas in Communications, Vol. 22, No.
7, Sep 2004, pp1252-1270.
Rahim, A., Zeisberg, S., Finger, A., "Coexistence Study between UWB and WiMAX at 3.5 GHz
Band," IEEE International Conference on Ultra-Wideband 2007, ICUWB 2007, pp.915-
920, 24-26 Sept. 2007.
Sklar, B., (1988), ’Digital Communications, Fundamental and Applications’, Prentice Hall
1988.
Urkowitz, H., (1967), ‘Energy Based Detection of Unknown Deterministoc Signals,’ Proc. of the
IEEE, vol. 55, no. 4, pp. 523–531, Apr. 1967.
Wang, Z., Qu, D., Jiang, T., He, Y., (2008), ’Spectral Sculpting for OFDM Based Opportunistic
Spectrum Access by Extended Active Interference Cancellation,’ IEEE Globecom 30
Nov-4Dec, 2008, New Orleans.
Wimedia-PHY (2009) Wimedia Alliance standards on PHY Specifications 1.5 for UWB
communications, 11-August, 2009, />Xing, Y., Mathur, C., Haleem, M., A., Chandramouli, R., Subbalakshmi, K., P., (2007),
’Dynamic Spectrum Access with QoS and Interference Temperature Constraints,’
IEEE Transactions on Mobile Computing, vol. 6, no. 4, Apr. 2007, Page(s):423-433.
235
UWB Cognitive Radios
26 Will-be-set-by-IN-TECH
Yamaguchi, H., (2004), ’Active Interference Cancellation Technique for MB-OFDM Cognitive
Radio,’ 34th European Microwave Conference, 13 Oct. 2004, pp1105-1108,
Amsterdam.
Yucek, T. and Arslan, H., (2009), ’A Survey of Spectrum Sensing Algorithms for Cognitive
Radio Applications,’ IEEE Communications Surveys and Tutorials, Vol. 11, No. 1,
first quarter 2009, pp116-130.
Zhang, L., Liang, Y., C., and Xin, Y., (2007), ’Joint Admission Control and Power Allocation for
Cognitive Radio Networks,’ in Proc. 2007 IEEE Int. Conf. on Acoustics, Speech and
Signal Processing, 15-20, Apr 2007, Hawaii.
Zhao, Y., Morales, L., Gaeddert, J., Bae, K., K., Um, J., and Reed, J., H., (2007), "Applying
Radio Environment Maps to Cognitive WRAN Systems," in Proc. of the Second IEEE
International Symposium on Dynamic Spectrum Access Networks (DySPAN 2007),
April 17-20, 2007, Dublin, Ireland.
Zhao, Y., Raymond, D., da Silva, C., Reed, J., H., and Midkiff, S., F., (2007)’Performance
Evaluation Of Radio Environment Map-Enabled Cognitive Spectrum-Sharing
Networks’, Military Communications Conference (MILICOM 2007),29-31 Oct, 2007,
Orlando.
236
Novel Applications of the UWB Technologies
12
Detection and Avoidance Scheme for DS-UWB
System: A Step Towards Cognitive Radio
Shaoyi Xu
1
and Rumin Yang
2
1
Beijing Jiaotong University
2
Chongqing University of Technology
P. R. China
1. Introduction
Cognitive radio (CR) improves spectrum efficiency to satisfy increasing demands on
wireless transmission by dynamic spectrum access without interfering with legacy
networks. In 2004, IEEE 802.22 Working Group was formed to develop a standard for
wireless regional area networks (WRANs) based on CR technology (Hu et al et al., 2007). It
is expected to obtain a broadband access to data networks on the vacant TV channels while
avoiding harmful interference to licensed TV broadcasting in rural areas within a typical
radius of 17km to 30km (Stevenson et al., 2006).
Ultra wideband radio (UWB), a promising technology, has found a myriad of exciting
applications as well as generating a great deal of controversy, for its extremely broad
bandwidth transmission as well as its revolutionary way of overlaying coexistent RF
systems could cause interference on them (Lansford, 2004; Parr et al., 2003). Over the years,
the co-existence problem of UWB has been all along a hot topic in the academy, industry,
and regulatory bodies. After years of public debates, arguments, and comments, two
important solutions to the co-existence problem are made—the policy-based power
emission mask (FCC, 2002) and the device-centric cognitive radio (Lansford, 2004; Walko,
2005; Haykin, 2005). So far, several cognitive UWB schemes have been proposed, among
which are soft-spectrum (Zhang & Kohno, 2003) scheme and detection-and-avoidance
(DAA) scheme (Kohno & Takizawa, 2006).
Reliably detecting of weak primary signals is an essential functionality for a DAA UWB system
as soon as a primary user (PU) comes back into operation on the operating channels. Two types
of primary users are defined in a WRAN which are TV services and wireless microphones
(WMs). Compared with TV services, it is tougher to detect WM signals for the following two
reasons. Firstly, wireless microphones are low power devices and occupy a narrow bandwidth.
The transmission power of a WM is as low as 50mW in a 200kHz bandwidth. When the sensor
is several hundred meters away from this WM signal, the received signal-to-noise ratio (SNR)
may be below -20dB (Zeng & Liang, 2007). Another, they utilize arbitrary unused TV bands and
are deployed for a short time such that it is difficult for CR users to obtain much information on
WM signals (De & Liang, 2007; Dhillon & Brown, 2008).
This chapter will concern two questions. Firstly, how to detect the weak primary signals.
Secondly, how to avoid such interference from the primary user and how to coexist with it.
Novel Applications of the UWB Technologies
238
To address the first problem, we consider detecting multiple WM signals in a WRAN when
UWB users want to use this spectrum and propose a singular value decomposition (SVD)
based algorithm. To verify the better performance by using the suggested approach,
simulation results by comparing to the traditional methods will be shown. For the second
concern, a pulse-shaping scheme under the limit of a power spectrum density algorithm will
be proposed. In a cognitive environment, the re-design of pulses should be agile enough and
easily reconfigurable. Furthermore, to avoid interfering with the primary system, the
transmission power o f UWB should be considered.
2. Detection of weak primary signals in a cognitive radio network
2.1 Basic assumptions and problem formulation
Several methods have been suggested to detect WM signals. In (Mossa & Jeoti, 2009), a
cyclostationary filter is proposed to grasp the existence of WM signals and to estimate their
frequency locations. Obviously, such database dependent methods can not adapt to the
dynamic signal detecion. (Lei & Chin, 2008; Wu et al., 2009) proposed beacon based methods
for wireless microphones but these put the onus on many already-deployed incumbent
wireless microphones. (Zeng & Liang, 2009; Unnikrishnan & Shellhammer, 2007) investigate
the method based on eigenvalues of received data matrix when a WM signal is present but
can not solve the multiple WM signals detection in a wideband cognitive network. To the
best of our knowledge, the literature of wideband spectrum sensing for multiple WM
signals is very limited. Actually, it is inevitable that multiple wireless microphones
appeared simultaneously. Furthermore, performing wideband spectrum sensing can
improve detection efficiency and maximize the opportunistic throughput (Quan et al., 2008).
(Kalke, 2005) estimated that about 25,000 licensed wireless microphones are utilized by
recording studios of TV broadcasters, organizers and performers in concerts and theatres,
commentators in sports events, film production crews and government agencies. To avoid
interfering to each other, these WM signals must operate in different center frequencies with
enough guard bandwidth. To detect multiple WM signals in a wide bandwidth, (Lim et al.,
2007) suggested to use a cyclostationary filter with a filterbank to detect every sub-channel
which is divided from the wide sensing spectrum in advance. If a conventional energy
detector is used, the sensing process has to include two steps: coarse sensing and fine
sensing. The former step determines the presence of WM signals and the latter step is
required to decide which channel is occupied (IEEE 802.22 working Group for WRAN,
2006). Obviously, the system complexity and sensing periods will be greatly increased by
using traditional methods to sense WM signals in a wideband spectrum.
In our work, we propose a singular value decomposition based algorithm to detect multiple
WM signals in a CR network which can sense a wideband channel consisting of multiple
narrowband channels. After performing SVD on the received data matrix of a wideband
spectrum, the presence of WM signals is detected by comparing the singular values with a
prefixed threshold and the number of WM signals can be determined at the same time.
Then, the WM signals are approximated and the center frequencies of these WM signals are
estimated. Consequently, guard bandwidths will be set on the two sides of the primary WM
signals and CR users can still work on the other spectra within the sensing bandwith
without interfering with the primary wireless microphone users. The detection threshold
and probability of false alarm are derived and simulation results confirm that our method is
very effective and robust to detect and estimate multiple WM signals in a wideband
spectrum.
Detection and Avoidance Scheme for DS-UWB System: A Step Towards Cognitive Radio
239
Consider a CR network with N samples utilized to perform spectrum sensing at the ith CR
user. Then the received signals at this CR user have two hypotheses as
0
:()()
:() ()()
ii
rn
rn h un
ii
1i i
Hun
Hsn
.
(1)
Here H
0
and H
1
respectively mean the primary user is inactive and the licensed user is
operating. h
i
is the channel gain between the PU and the ith secondary user. s
i
represents the
received PU signals by the ith SU and u
i
is AWGN with zero mean and variance
2
u
,
respectively. The test statistic for an energy detector is given by
2
1
1
()
N
ii
n
Trn
N
.
(2)
Under the hypothesis H
0
, it shows a Gaussian random distribution when N is large with
mean
2
u
and variance
4
2
u
N
. Hence, for a given probability of false alarm P
f
, the threshold
of an energy detector can be derived as
1
2
2
1
f
u
QP
N
(3)
where
2
/2
() (1/ 2)
t
x
Qx e dt
is the normal Q-function.
In (Unnikrishnan & Shellhammer), it is pointed out that most wireless microphones use analog
frequency modulation (FM) and a WM signal occupies only 200kHz. Specifically, most energy
of a WM signal is contained in an only 40kHz bandwidth (Notor, 2006). However, IEEE 802.22
draft requires the sensing spectrum is at least one channel (6, 7 or 8MHz), and hence the
proportion which a WM signal occupies is below 3%. Based on the above analysis, s(t) can be
modeled as a summation of multiple single-tone cosinoidal signals as
1
( ) cos(2 )
P
kkk
k
st A ft
(4)
where A
k
, f
k
and
k
respectively denote the amplitude, center frequency and phase of the kth
WM signal and P is the number of WM signals in the sensing spectrum.
k
can be modeled
as a uniform random variable over [0, 2). Without loss of generality, we assume s
i
and u
i
are independent of each other and
2
2
WM
u
P
SNR
denotes the SNR of the primary WM
signals received by the ith CR user where P
WM
is the total power of P WM signals.
In this chapter, we consider that there are multiple WM signals in several sensing channels
and each channel is a TV channel with 6MHz bandwidth. Under this assumption, we focus
the detection of multiple WM signals on a wideband spectrum.
2.2 SVD based approach to detect and estimate multiple WM signals
In this section, we will present the SVD based method to detect the presence of WM signals
and to estimate the number and center frequencies of these detected WM signals.
Novel Applications of the UWB Technologies
240
2.2.1 Technology to detect multiple WM signals
SVD plays an important role in signal processing and statistics, particularly in the area of
linear systems. For a time series r(n) with 1,2, ,nN , commonly, we can construct a
Hankel matrix with M = N – L + 1 rows and L columns illustrated as follows:
(1) (2) ( )
(2) (3) ( 1)
(1)(2) ()
rr rL
rr rL
rN L rN L rN
R
(5)
then
R is an ML matrix. Its elements can be found by substitution of r(n)
(1), 1,2,,
ml
rm l m M
R and 1,2,lL
.
(6)
Using the SVD,
R can be factorized as
H
RUΣV
(7)
where
U and V are an MM and an LL unitary matrix, respectively. The columns of U and
V are called left and right singular vectors, respectively.
12
(,,, )
m
diag
Σ
is a diagonal
matrix whose nonnegative entries are the square roots of the positive eigenvalues of
H
RR
or
H
RR
. These nonnegative entries are called the singular values of R and they are
arranged in a decreasing order with the largest one in the upper left-hand corner. [ ]
H
denotes the complex transpose of a matrix.
When no any primary WM signal is present, the received signal r(n) includes only AWGN
contribution such that its singular values are similar and close to zero. When WM signals
are active whose power is higher than a threshold, there will exist several dominant singular
values to represent these WM signals. As a result, the WM signals can be detected by
examining the presence of dominant singular values.
It is critical to determine the number of WM signals P and we will present such method in
the following part. To simplify our analysis, we assume that the power values of all WM
signals received in the detected spectrum are approximately same, that is to say A
1
A
2
A
P
. Since the SNR of primary WM signals received by the secondary detectors is usually
very weak, we think this assumption is feasible. Several methods can be utilized to
determine if the dominant singular values are present. It is pointed out in (Teh et al, 1995)
that the relationship between the number of dominant singular values K and the number of
single-tone cosinoidal signals P has the form as K = 2P, therefore, threshold
can be adopted
which is the ratio between the first singular value and the (2X+1)th singular value. That is to
say, if the following equation is true, P WM signals can be declared to be present as
1
21
If , then
X
PX
(8)
and the expression of
will be derived in Section 2.3.
2.2.2 Technology to estimate the center frequencies of multiple WM signals
Once WM signals are detected to be active in the sensing channels, the center frequencies of
these primary WM signals need to be estimated such that a guard bandwidth can be
Detection and Avoidance Scheme for DS-UWB System: A Step Towards Cognitive Radio
241
retained and CR users utilize the other spectra to improve spectrum efficiency. Next, we will
present the frequency estimation technique by using SVD.
After P WM signals are detected to be active, the data matrix
R in (5) is the superposition of
the WM signal space and AWGN space and
R can be partitioned into two subspaces as
follows
0
0
H
S
H
SU SU
U
HH
SSS UUU S U
Σ
RUΣVUU VV
Σ
U Σ VUΣ VRR
(9)
where
12 2
(,,, ),
SP
diag
Σ
(10)
and
2122
(,,,)
UPPm
diag
Σ
(11)
with
12 2 2122PP P m
corresponding to the singular values in
the WM signal subspace and the noise subspace, respectively.
1
,
2
,,
2P
are 2P dominant
singular values which correspond to the P WM signals.
H
SSSS
RUΣ V and
H
UUUU
RUΣ V are the WM signals subspace and the noise subspace, respectively. By
rearranging
R
S
into a time serial, we can get the estimated data vector of WM signals
12
[,,, ]
T
N
yy y y which includes P WM signals. Next, we will present the algorithm to
estimate P center frequencies corresponding to P WM signals.
We define
12
[,,, ]
T
N
YY Y FFT( )Y= y as the N-point Fast Fourier Transform (FFT)
operation so we can use the theory of the Rife and Boorstyn (Rife & Boorstyn, 1974) as the
frequency estimation of the WM signal which has the maximum power
1
1_max
max [ ] , 1kkkN
Y
(12)
1_max
1
ˆ
s
k
f
f
N
(13)
where |.| is the absolute value operator, max(.) operator means k
1_max
is the k
1
th sampling
point where |
Y[k]| obtains its maximum and f
s
is the sampling frequency.
By applying equation (12) and (13), the center frequency of the WM signal which has the
maximum power can be acquired. Following the similar step, we can obtain the
approximate center frequency for the jth WM signal as
_max
max [ ] , 1
j
j
kkkN
Y
(14)
and
_max
ˆ
j
j
s
k
ff
N
(15)
Novel Applications of the UWB Technologies
242
where k
j_max
presents the k
j
th sampling point corresponding to jth peak magnitude.
From the above analysis it can be concluded that this estimation algorithm is easy to
implement since only FFT is required. By using FFT, the efficiency of frequency estimation
can be improved greatly. Another, the inaccurate knowledge of P will not affect frequency
estimation. If P is under or over estimated, then fewer or more frequencies will be estimated
than the true number.
Rife and Boorstyn pointed out that when SNR is high enough, the true frequency has a high
probability lies in the range (Rife & Boorstyn, 1974)
ˆˆ
[(/2),(/2)]
ss
fff
N
ff
N
.
(16)
In summary, the SVD based detection and estimation algorithm consists of the following steps:
Step 1. Pick a number L so that k < L < N k (Tufts & Kumaresan, 1982), where N is the
number of sampling points and k is the number of dominant singular values. In
our work, k = 2P.
Step 2. Arrange the received signal vector r to form a Hankel data matrix R as (5). Then
compute the SVD of
R and obtain all singular values of R.
Step 3. Calculate the threshold
=
1
/
2X+1
(X = 1,2,…) and compare the ratio
1
/
2X+1
with
the predefined threshold
. If
1
/
2X+1
, the WM signals are determined to be
present and the number of WM signals can be derived by P = X. Otherwise, no WM
signal is declared to be active. The derivation of
will be explained in Section 2.3.
Step 4. If P WM signals are declared to be present, compute R
S
then arrange it into a data
vector
y. Apply FFT on y and consecutively find the number of the point k
j
_
max
at
which the k
j
th peak amplitude of the FFT is approached.
Step 5. Obtain the estimated center frequency of jth WM signal by using (12 15).
2.3 Theoretical analysis and determination of threshold
In this section, we will derive the threshold
and probability of false alarm P
f
.
We denote
R
S
(ML) and R
U
(ML) as the Hankel matrix of WM signals and an AWGN
signal, respectively, such that
R
U
~ N
p
(0, ) where p is the dimension of R
U
and is the
covariance matrix. Since the power of WM signals is usually very low, the distribution of
R
S
+R
U
can be approximated as N
p
(0, ). According to (Zeng & Liang, 2009; Johnstone, 2001),
we have the following three theorems:
Theorem 1. Assume M/L 1 and N is large enough, the largest singular value can be
approximated as
2
2
1
u
NML
N
.
(17)
Theorem 2. Assume M/L 1 and N is large enough, the largest singular value follows the
following distribution
2
1
1
ML
ML
F
(18)
where
and
are called a center constant and a scaling constant and they are defined as
Detection and Avoidance Scheme for DS-UWB System: A Step Towards Cognitive Radio
243
2
1
ML
M
L
(19)
and
1
3
11
1
1
ML
ML
M
L
.
(20)
F
1
is the distribution function of Tracy-Widom distribution of order 1 which has the form
as
2
1
1
() exp ( ) ( ) ( ) ,
2
s
Fs qx x sq xdx s
(21)
and q solves the Painlevé II differential function (Johnstone, 2001).
Theorem 3. The distribution of rth largest singular value (r < L) has the approximate
distribution as
22
11 ,
,, , ,
rLrML
ML ML rI c
(22)
where c
M,L
is an empirical constant.
Based on the above three theorems, as a result, P
f
can be presented as
22 2
121 121
222 2 22
21 1 21 1
2
2
2
21
2
2
2
2
21
2
2
2
2
12,
2
2
2
,2
2
1
,2
//
/1/ /
1,,
1,2,
1
fX X
XX
u
X
u
X
u
LX ML
u
ML X
ML X
PP P
PP
PNML
N
NMLML
N
NMLMLXI c
N
NML
N
F
,ML
c
(23)
Hence, for a pre-determined P
f
, the required threshold
can be represented as
1
,2 1 , ,2
1
u
M
LX ML
f
ML X
NML
NFcp
.
(24)
Novel Applications of the UWB Technologies
244
2.4 Simulation results
2.4.1 Simulation parameters
Since it is difficult to derive the accurate closed form expression of
and P
f
, we need to
resort to simulations for evaluating the performance of our approach.
We consider the spectrum of interest is three consecutive channels which means the sensing
bandwidth is 18MHz. We assume that three WM signals are distributed on this 18MHz
bandwidth and their SNRs are same. The signals are firstly down-converted into baseband
and filtered by a baseband filter with bandwidth 18MHz. And then, these WM signals have
the center frequency of 2.4MHz, 8MHz and 14.2MHz, respectively. The selected sampling
frequency f
s
must be larger than the Nyquist frequency of the WM signal which has the
highest center frequency and in our simulation f
s
should be larger than 28.4MHz. To find the
threshold
, we require the probability of false alarm is P
f
= 0.1. To evaluate the performance
of frequency estimation, we define the mean estimation precision for the frequency
estimation as
3
1
3
jj
j
j
ff
f
.
(25)
where
j
f
and f
j
are the estimated jth center frequency and the jth (j 3) true center
frequency, respectively. To investigate our proposal, we compare our simulation results
with a conventional energy detector whose threshold has been given in (3).
It has been shown in (Tufts & Kumaresan, 1982) that when the column number
L in a
Hankel matrix satisfies the inequality 2
P < L < N 2P, we can obtain the correct or
approximately correct estimation result. However, to the best of our knowledge, it has not
been seen that the optimal
L theoretically, moreover, the optimal L is different in different
cases. In our work, the simulation results show that satisfying 2
P < L < N 2P, different L
has no significant impact on the system performance and frequency estimation.
In our work, without specific explanation, the sampling frequency is selected as
f
s
= 36MHz
and we select
L = N/5 as the column number in our following simulations.
2.4.2 Simulation results and analysis
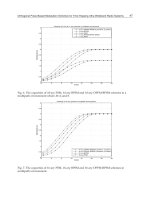
Fig. 1 shows simulation results of the probability of detection (P
d
) vs. SNR when the proposed
SVD based method and a classical energy detector are used. To investigate the effect for
different WM signals, we show simulation results for the single WM signal with a center
frequency of 2.4MHz and multiple WM signals, respectively. From this figure we can conclude
that the detection performance can be improved greatly by using our method, especially for
the single WM signal. For example, for the target P
d
of 90%, a 4dB improvement can be
obtained than an conventional energy detector by using the proposed approach for a single
WM signal. For the multiple WM signals, an improvement of 2dB can be attained compared
with the conventional energy detector. To evaluate the performance of the detector, the
receiver operating characteristic (ROC) curves are illustrated in Fig. 2 when SNR is -12dB for
the single WM signal and SNR = -10dB for three primary WM signals. We plot the P
d
under H
1
against P
f
under H
0
when P
f
changes from 0.001 to the desired 0.1. We can observe that the
ROC curve of our algorithm is much higher than that of the energy detector for both the single
WM signal and multiple WM signals which verifies the better performance of our detector.
Detection and Avoidance Scheme for DS-UWB System: A Step Towards Cognitive Radio
245
-18 -17 -16 -15 -14 -13 -12 -11 -10 -9 -8
0.1
0.2
0.3
0.4
0.5
0.6
0.7
0.8
0.9
1
SNR
Pd
Proposed SVD Method for single WM signal
Proposed SVD Method for three WM signals
Energy detector
Fig. 1. Comparison of P
d
between the proposed SVD-based method and a energy detector
when PU is a single WM signal and three WM signals.
0 0.01 0.02 0.03 0.04 0.05 0.06 0.07 0.08 0.09 0.1
0
0.1
0.2
0.3
0.4
0.5
0.6
0.7
0.8
0.9
1
Pf
Pd
SNR = -12dB:SVD Method for single WM signal
SNR = -12dB:Energy detector
SNR = -10dB:SVD Method for three WM signals
SNR = -10dB:Energy detector
Fig. 2. Comparison of ROC curve between the SVD-based method and an energy detector
when PU is a single WM signal and three WM signals.
To study the robustness of our algorithm, we first compare the P
d
of our SVD based detection
method under different column number
L when three primary WM users operate
simultaneously. Fig. 3 depicts the simulation results when
L = 3N/4, N/2, N/3 and N/5,
respectively. From this figure we can observe that although different
L is taken, a good
Novel Applications of the UWB Technologies
246
detection probability can be achieved with very slight difference. Then, we compare the P
d
of
the proposed approach under different sampling frequency
f
s
. The used sampling frequencies
are 24MHz, 30MHz, 36MHz and 48MHz, respectively. Among these frequencies, 24MHz is
lower than the Nyquist frequency of the WM signal whose center frequency is 14.2MHz. From
Fig. 4 we can conclude that with the changing of
f
s
, the probability of detection shows very
slight difference. Even for the
f
s
= 24MHz which is lower than the Nyquist frequency, a good
P
d
can be obtained which proves that our method is robust for different sampling frequency.
-18 -17 -16 -15 -14 -13 -12 -11 -10 -9 -8
0.1
0.2
0.3
0.4
0.5
0.6
0.7
0.8
0.9
1
SNR
Pd
L=3N/4:Proposed SVD Method
L=N/2:Proposed SVD Method
L=N/3:Proposed SVD Method
L=N/5:Proposed SVD Method
Fig. 3. Pd vs. SNR with different column number L for three WM signals.
-18 -17 -16 -15 -14 -13 -12 -11 -10 -9 -8
0.1
0.2
0.3
0.4
0.5
0.6
0.7
0.8
0.9
1
SNR
Pd
fs=24MHz:Proposed SVD Method
fs=30MHz:Proposed SVD Method
fs=36MHz:Proposed SVD Method
fs=48MHz:Proposed SVD Method
Fig. 4. Pd vs. SNR with different fs for three WM signals.
Detection and Avoidance Scheme for DS-UWB System: A Step Towards Cognitive Radio
247
To investigate the estimation performance of the WM’s center frequency, we plot the mean
estimation precision
in Fig. 5 and 6 when L and f
s
change. From these two figures we can
see that the proposed frequency estimation method is very effective. For example, for the
f
s
of 36MHz and SNR = -10dB, the absolute error of the worst estimation is within 10kHz.
Whereas, a nearly perfect frequency estimation can be obtained for
f
s
= 36 and 48MHz when
SNR = -10dB. In Fig. 5, an obvious result can be found that
gets better with the increase of
f
s
. This is feasible since it is more possible to find the jth magnitude when the sampling rate
is larger. However, higher
f
s
means a higher requirement for the system complexity. As a
result, a tradeoff is needed to consider between system complexity and a satisfying
. Figure
5 also proves that the estimation precision can be degraded severely if a
f
s
lower than the
Nyquist frequency is used. Fig. 6 presents the mean estimation precision
when f
s
= 36MHz
and
L = 3N/4, N/2, N/3 and N/5, respectively. From Fig. 6 we can conclude that the
difference of
L has no significant impact on
, especially when SNR is higher than -12dB.
-14 -13 -12 -11 -10 -9 -8
0
0.05
0.1
0.15
0.2
0.25
0.3
0.35
SNR
Mean Estimation Precision
fs=24MHz:Proposed SVD Method
fs=30MHz:Proposed SVD Method
fs=36MHz:Proposed SVD Method
fs=48MHz:Proposed SVD Method
Fig. 5. Mean estimation precision of center frequency vs. SNR with different sampling
frequency fs for three WM signals.
Novel Applications of the UWB Technologies
248
-14 -13 -12 -11 -10 -9 -8
0
0.05
0.1
0.15
0.2
0.25
0.3
0.35
SNR
Mean Estimation Precision
L=N/5:Proposed SVD Method
L=N/3:Proposed SVD Method
L=N/2:Proposed SVD Method
L=3N/4:Proposed SVD Method
Fig. 6. Mean estimation precision of center frequency vs. SNR with different column number
L for three WM signals.
2.5 Conclusions
In this part, we proposed a SVD based approach to detect and estimate multiple WM signals
in a WRAN when a UWB system wants to use this spectrum. After perforimg SVD on the
received data matrix, the presence and number of these WM signals can be detected and
their center frequencies can be estimated. Consequently, guard bandwidths are retained to
protect these primary users and the other detected spectra are available for the CR users.
Simulation results prove that our method is simple and robust and it is especially suitable
for detection and estimation of WM signals in a wideband spectrum sensing.
3. Detection and avoidance scheme based on orthonormal expansion
As well known, UWB technology is divided into two distinctive groups. The first group,
known as multi-band UWB (MB-UWB), divides the entire UWB band into many sub-bands,
with each sub-band being allocated a sinusoidal carrier. The DAA scheme mentioned above
originates from this multi-band way of using UWB spectrum—each time a sub-band is
detected being interfered, the carrier allocated for it is turned off. The second group is
known as direct sequence UWB (DS-UWB), which, unlike the first, typically adopts a single-
band transmission and depends entirely on varying pulse shapes to fit given spectrum
masks; therefore, it is relatively difficult to turn on/off individual sub-band. A question is
thus raised: Can the spectrum of the single-band DS-UWB be soft?
To answer this question, let us first investigate the currently proposed DS-UWB pulses:
Rayleigh monocycle, Cubic monocycle, Gaussian monocycle, Gaussian doublet (Benedetto
et al., 2006; Benedetto et al., 2004), high-order Gaussian derivatives (Win, 2000), modified
Hermite polynomials (Ghavami et al., 2001) and so forth. The finding is somewhat
discouraging—all of them feature fixed spectra. Used individually, they are not soft at all.
Then, can the combinations of them be soft? As addressed in (Benedetto et al., 2004), a group
of Gaussian derivatives have been linearly combined to generate an aggregate pulse that
yields maximum spectral capacity. Such a combination adopts random-search optimization
method, in the sense that a large number of combination coefficients are randomly
Detection and Avoidance Scheme for DS-UWB System: A Step Towards Cognitive Radio
249
generated and the resulting combinations are evaluated. The combination that has
minimum distance to the targeted spectrum mask is picked up as the optimal combination.
This optimization method demands a huge number of iterations before finding the
optimum. The converging time varies from situation to situation, so the linear combination
methods are something between fixed and soft.
Moreover, cognitive UWB devices need to design and re-design the pulses on the scene of
communication instead of having them preset or fixed in factories. In cognitive environment,
the re-design of DS-UWB pulse must be agile enough and easily re-configurable.
To this end, we propose a soft-spectrum-based detection-and-avoidance algorithm for the
single-band DS-UWB systems. The algorithm adopts a co-basis expansion method, in the
sense that the well-known Hermite-Gaussian functions (HGFs) are used to constitute a
common basis for both the time and frequency domains. The co-basis has twofold
advantages: First, it yields the pulses directly from expanding the given soft-spectrum
masks in frequency domain, so the pulses can conform to arbitrary spectrum masks. Second,
the co-basis (that is, the HGFs) can be digitalized and built into matrices, such that
whenever a new soft-spectrum is sensed or discovered, its expansion by the co-basis is as
simple as matrix multiplications. As a result, the algorithm is really soft, low complex,
always convergent, and agile enough for cognitive purpose.
3.1 The establishment of the soft-spectrum mask
The criterion for the design of DAA pulses is the ruling of the Federal Communications
Commission (FCC), namely, the FCC’s power emission mask (FCC, 2002), which ranges from
3.1 to 10.6GHz with power limit
P
max
=−41.3dBm/MHz. Within the allocated UWB band, other
radio systems such as IEEE 802.11a or HiperLan has already been in operation. For cognitive
purpose, the DS-UWB radio must be aware of the existence of such primary systems before
transmission and automatically avoid the frequency bands in use by primary users.
In the design of the DAA scheme for DS-UWB radio, our emphasis is placed on the side of
avoidance. In order not to digress our focus, we leave the side of detection to reference to
well-established spectral estimation methods in literature, for example, the multi-taper
spectral estimator that performs fast Fourier transform (FFT) and threshold inspection
(Haykin, 2005; Welch, 1967). Before transmission, the DS-UWB radio senses the ambient
radio environment with a detecting unit. Upon detecting an in-use sub-band, it calculates
the 10dB-bandwidth of the sub-band and marks the sub-band as forbidden. In a recursive
manner, DS-UWB radio sweeps the entire UWB band and records all the forbidden sub-
bands. After the sensing process is over, the UWB radio establishes a soft-spectrum model
that conforms not only to the FCC mask but also to the real-time radio environment. The
soft-spectrum model so-established can be expressed as
max
()
0
s
ss
s
PfII
Rf
fI
(26)
where
P
max
=−41.3dBm/MHz, I=[3.1GHz, 10.6GHz], and I
s
represents the union of the
forbidden sub-bands.
3.2 The relationship between the soft-spectrum and the frequency response
The DS-UWB radio is by nature a spread spectrum system, whose transmitted waveforms
can be characterized as follows (Ye et al., 2004),
Novel Applications of the UWB Technologies
250
1
() ( )
c
N
j
bck
p
kj
st pt kT jT bc
(27)
where
b
k
is the kth data bit with duration T
b
; T
c
is the chip duration; N
c
is the spreading
factor (that is,
T
b
=N
c
T
c
); is the jth chip of the pseudorandom code; p(t) is the pulse
waveform. Through substitution of variables Eq. (27) can be simplified as:
() ( )
ic
i
st d
p
tiT
(28)
where
c
ikN j
and
,
j
ikjpk
dd cb
(29)
The autocorrelation function of
s(t) is given by (Proakis, 2003)
1
() () ( )
ss dd
pp
c
c
l
rrlrlT
T
(30)
where
r
dd
(•) represents the autocorrelation function of the information sequence {d
i
∈{±1}};
r
pp
(•), the autocorrelation function of the pulse. Correspondingly, the PSD of s(t) is given by
2
1
() () ()
ss dd
c
R
f
R
f
P
f
T
(31)
which indicates that the PSD of the transmitted waveforms depends not only on the
frequency response of the pulse,
P(f), but also on the PSD of the information sequence, R
dd
(f),
and on the chip duration
T
c
as well. However, since the sequence {d
i
∈{±1}} can be viewed as
an uncorrelated random process with zero mean and unitary variance (Benedetto et al.,
2004; Ye et al., 2004), that is,
r
dd
(l)=δ(l), and R
dd
(f)=1, the autocorrelation function defined by
Eq. (30) and the PSD defined by Eq. (31) can be further simplified respectively as follows,
*
11
() () () ( )
ss pp
cc
rr
p
t
p
tdt
TT
(32)
and
2
1
() ()
ss
c
R
f
P
f
T
(33)
By substituting Eq. (26) into Eq. (33), we obtain the frequency response
P(f) of the
transmitted DS-UWB waveforms that conforms both to the FCC mask and to the ambient RF
environment, such
P(f) we refer to as soft-spectrum mask, namely
() ()
0
s
css
s
AfII
Pf TR f
fI
(34)
Detection and Avoidance Scheme for DS-UWB System: A Step Towards Cognitive Radio
251
where
max
/10
9
10 10 (V/Hz)
P
c
AT
(35)
3.3 The establishment of a co-basis for both the time and frequency domain
The frequency response given by Eq. (34) is inherently an energy signal and can be uniquely
expanded by orthonormal functions that span the signal base. But, an ordinary expansion
does not suffice here. In the design of soft-spectrum-based DAA pulse, we need a common
basis for both the time and frequency domains, that is, a co-basis. With this co-basis, the
well-known orthonormal expansion method will do wonders for the design of pulses,
yielding the waveform of the pulses (time domain) by expanding the soft-spectrum in the
frequency domain.
Hermite-Gaussian functions (HGFs) constitute ideally such a co-basis.
The HGFs are combinations of Hermite polynomials with a Gaussian function, as written as
follows (Ozaktas et al., 2000),
2
1/4
() (2 ) , 2 / 2 !
ul
lll l
uaH ue a l
(36)
where
H
l
(•) denotes the lth order Hermite polynomial. The generation function for Eq. (36)
is
22
2
(1)
( ) , 0,1,2
(2)
l
l
uu
l
l
ll
a
d
ueel
du
(37)
Note that the HGFs defined by Eqs. (36) and (37) are slightly different from those defined in
classical mathematical textbooks—here, they are
-scaled, so that they turn out to be the
eigenfunctions of fractional Fourier transform (Ozaktas et al., 2000). In other words, because
the HGFs are
-scaled, they are shape-invariant to fractional Fourier transform (Ozaktas
et al., 2000), that is,
/2
{()} ()
il
ll
Fue
(38)
where
denotes fractional Fourier transform (FRFT) operator; , the corresponding
eigenvalues;
, the order of the FRFT.
The FRFT is a generalization of the ordinary Fourier transform with an order parameter
.
The
-th order fractional Fourier transform is the -th power of the ordinary Fourier
transform operation. When
=−1, the corresponding FRFT operation is exactly the ordinary
inverse Fourier transform. Under such circumstance, Eq. (38) becomes
1
{()} ()
l
ll
Fui
(39)
which indicates that the HGFs are shape-invariant to the inverse Fourier transform except
for a phase shift. This nice property makes the HGFs constitute a common basis for both the
frequency and time domain. To emphasize this, we introduce two normalized variables
u
and
µ in place of the natural frequency f and time t. The relationship among them will be
addressed later on.