Nuclear Power Operation Safety and Environment Part 9 ppt
Bạn đang xem bản rút gọn của tài liệu. Xem và tải ngay bản đầy đủ của tài liệu tại đây (1.41 MB, 30 trang )
Simulation of Ex-Vessel Steam Explosion
229
0
50
100
150
200
250
300
350
0246810
Pressure (MPa)
Time (s)
Global KH-2_02 KH-1_10
0
0,05
0,1
0,15
0,2
0,25
0,3
0,35
0,4
0,45
0246810
Impulse (MPa.s)
Time (s)
Global KH-2_02 KH-1_10
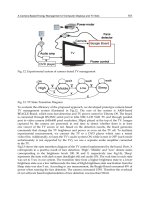
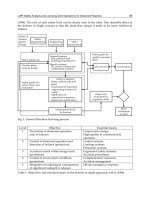
Fig. 10. Calculated maximum pressures in the cavity (left) and maximum pressure impulses
at the cavity walls (right) for performed explosion phase simulations (jet breakup model:
Global, KH-2_02, KH-1_10). The time axis denotes the explosion triggering times.
4.2 Influence of melt droplets solidification
In the explosion simulations it was assumed that the corium droplets in the premixture can
potentially undergo fine fragmentation, and so contribute to the explosion escalation, if the
droplets bulk temperature is higher than the corium solidus temperature. This overpredicts
the ability of corium droplets to efficient participate in the explosion, since in reality, during
premixing, a crust is formed on the corium droplets much earlier than the droplets bulk
temperature drops below the solidus temperature (Huhtiniemi et al., 1999; Dinh, 2007). This
crust inhibits the fine fragmentation process and if the crust is thick enough it completely
prevents it. To find out the impact of the melt droplets solidification on the explosion
results, for the most explosive central melt pour case C2-60 additional explosion simulations
were performed, considering different corium droplet bulk temperatures, below which the
fine fragmentation process is suppressed. In this parametric study for the minimum fine
fragmentation temperatures (MFFT) the corium solidus temperature 2700 K (default), the
liquidus temperature 2800 K and the temperature 2750 K in-between were taken. The
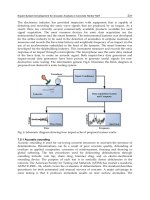
simulation results are presented in Fig. 11.
It may be observed that MFFT has a significant influence on the strength of the steam
explosion. As is summarized in Table 9, both, the maximum pressure in the cavity and the
maximum pressure impulse at the cavity walls, decrease with increasing MFFT. This was
expected, since with a higher MFFT a smaller fraction of the corium in the premixture is hot
enough to fulfil the strained temperature criterion for fine fragmentation, and consequently
a smaller fraction of the corium in the premixture can potentially participate in the explosion
process.
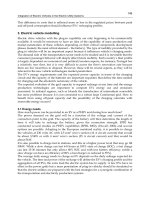
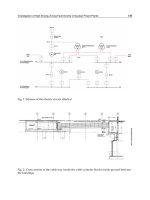
In Fig. 12 the time evolution of the mass of hot corium droplets, with the bulk temperature
higher than MFFT, in regions with different void fractions is presented during premixing.
During premixing nearly 8000 kg of corium droplets are formed (curve “Total”). The mass
of hot corium droplets, which are potentially available to participate in the explosion (curves
“<100%”), depends on the selected MFFT, and is up to ~3000 kg for MFFT 2700 K, up to
~2500 kg for MFFT 2750 K, and up to ~2000 kg for MFFT 2800 K. The hot corium droplets
can efficiently participate in the explosion only in regions with enough water available for
vaporization and for enabling the fine fragmentation process, which is essential for the
steam explosion development. Therefore a better indicator for the expected strength of the
resulting explosion is the available mass of hot droplets in regions, where the void fraction
Nuclear Power – Operation, Safety and Environment
230
is not too large, that is in regions, where the vapour fraction is below 60% (active melt mass).
The so established corium droplet masses are much lower, up to ~900 kg for MFFT 2700 K,
up to ~600 kg for MFFT 2750 K and up to ~300 kg for MFFT 2800 K. These differences in the
active melt masses are reasonable reflected in the calculated pressure loads presented in
Fig.11 and Table 9.
0
50
100
150
200
250
300
350
0246810
Pressure (MPa)
Time (s)
2700 2750 2800
0
0,05
0,1
0,15
0,2
0,25
0,3
0,35
0,4
0,45
0246810
Impulse (MPa.s)
Time (s)
2700 2750 2800
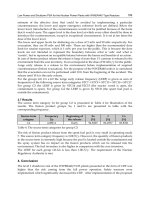
Fig. 11. Calculated maximum pressures in the cavity (left) and maximum pressure impulses
at the cavity walls (right) for performed explosion phase simulations (minimum fine
fragmentation temperature: 2700 K, 2750 K, 2800 K). The time axis denotes the explosion
triggering times.
Minimum fine fragmentation
temperature (K)
Maximum
pressure (MPa)
Maximum
impulse (MPa·s)
2700 293.7 0.42
2750 235.0 0.21
2800 114.7 0.11
Table 9. Maximum pressures in the cavity and maximum pressure impulses at the cavity
walls (cavity floor included) for different minimum fine fragmentation temperatures.
Simulation of Ex-Vessel Steam Explosion
231
0
500
1000
1500
2000
2500
3000
3500
0246810
Mass (kg)
Time (s)
<20% <40% <60% <80% <100% Tota l
a) MFFT: 2700 K (solidus)
0
500
1000
1500
2000
2500
3000
3500
0246810
Mass (kg)
Time (s)
<20% <40% <60% <80% <100% Total
b) MFFT: 2750 K
0
500
1000
1500
2000
2500
3000
3500
0246810
Mass (kg)
Time (s)
<20% <40% <60% <80% <100% To ta l
c) MFFT: 2800 K (liquidus)
Fig. 12. Mass of corium droplets with the bulk temperature above the given minimum fine
fragmentation temperature (MFFT) in regions with different void fractions during
premixing. The results are presented for regions with a void fraction below 20% (<20%) up
to regions with a void fractions below 100% (<100%). In addition also the total (liquid and
solid) corium droplets mass is presented (Total).
Nuclear Power – Operation, Safety and Environment
232
5. Conclusions
An assessment of ex-vessel steam explosion pressure loads in a typical pressurized water
reactor cavity was performed with the FCI code MC3D. To be able to perform a series of
simulations, the reactor cavity was modelled in a simplified 2D geometry, trying to assure
that the 2D simulation results reflect qualitatively and quantitatively as closely as possible
the conditions in a real reactor cavity. A spectrum of relevant scenarios has been analyzed
and a sensitivity study has been performed addressing the influence of the jet breakup
modelling and the melt droplets solidification on the FCI process.
The simulation results revealed that the strongest steam explosions may be expected in the
initial stage of the melt release, when the void build up is not so extensive. The results for
the central melt pour cases showed that, in the initial stage of the melt pour, stronger
explosions mainly occur for higher water subcooling and higher primary system
overpressure. An explanation for this could be that higher water subcooling results in less
void build up and that higher driving pressure increases the melt fragmentation. At the later
stage of the simulations, stronger explosions mainly occur for lower subcooling, probably
due to less droplet solidification with lower water subcooling. However the influence of the
water subcooling on the explosion strength is not very clear, indicating that in the
considered subcooling range the effects of void build up and melt droplets solidification
nearly compensate. The results of the side melt pour cases revealed that stronger explosions
may be expected with a depressurized primary system, since with a pressurized primary
system the melt is ejected sideward on the cavity wall hindering the formation of an
extensive premixture; moreover gas flows through the vessel opening into the cavity
forming a highly voided region below the reactor vessel.
The high calculated pressure loads in the side pour cases could be attributed to the used 2D
slice modelling of the reactor cavity, where the melt is released in the form of an infinite
wide curtain and the explosion is triggered through the whole width of that curtain. This is
quite conservative since, due to the 2D treatment, venting and pressure relief is
underpredicted and the explosion development is overpredicted. So the performed side
pour simulations should be regarded more as providing some basic qualitative insight in the
FCI behaviour for side pour scenarios. For a more reliable estimation of the expected
pressure loads in side pour scenarios a 3D modelling approach would be needed. The
central pour cases are closer to the reality since for a central melt pour the 2D axial
symmetric representation is quite suitable. So the reliability of central pour simulation
results is higher than the reliability of side pour simulation results.
The sensitivity study revealed that the jet breakup and the melt droplets solidification have
a significant influence on the strength of the steam explosion, and consequently have to be
adequately modelled. Especially the correct establishment of the size of the created melt
droplets during jet breakup is crucial, since the droplets size defines the melt surface area
for heat transfer, which governs the melt droplets solidification and the void build. Both, the
melt droplets solidification and the void build up may significantly reduce the strength of
the steam explosion, as demonstrated by the preformed simulations.
The nature of FCI is very complex and already small modelling changes can have a
significant influence on the simulation results. Therefore additional experimental and
analytical work is needed, as being carried out in the OECD programme SERENA phase 2
and in the network of excellence SARNET-2 within the 7th EU framework program, to be
able to reliably extrapolate the various experimental findings to reactor conditions and to
perform reliable reactor simulations.
Simulation of Ex-Vessel Steam Explosion
233
6. Acknowledgments
The author acknowledges the financial support of the Slovenian Research Agency within the
research program P2-0026, the research project J2-2158, and the cooperative CEA-JSI
research project (contract number 1000-0810-38400013). The Jožef Stefan Institute is a
member of the Severe Accident Research Network of Excellence (SARNET2) within the 7th
EU Framework Program.
7. References
Albiol, T., Haste, T., van Dorsselaere, J.P., Journeau, C., Meyer, L., Chaumont, B., Sehgal,
B.R., Schwinges, B., Beraha, D., Annunziato, A., Zeyen, R., (2008). Summary of
SARNET achievements. ERMSAR conference, 23–25 September 2008, Nesseber,
Bulgaria
Berthoud, G. (2000). Vapor explosions.
Annu Rev Fluid Mech 32, pp. 573-611, ISSN 0066-4189
Corradini, M.L., Kim, B.J., Oh, M.D. (1988). Vapor Explosions in Light Water-Reactors – a
Review of Theory and Modeling.
Prog Nucl Energ 22, pp. 1-117, ISSN 0149-1970
Corradini, M.L. (1991). Vapor explosions: a review of experiments for accident analysis.
Nuclear Safety 32 (3), pp. 337–362, ISSN 0029-5604
Dinh, T.N. (2007). Material Property Effect in Steam Explosion Energetics: Revisited,
NURETH-12, Pittsburgh, Pennsylvania, USA, pp. 1–19
Esmaili, H., Khatib-Rahbar, M. (2005). Analysis of likelihood of lower head failure and ex-
vessel fuel coolant interaction energetics for AP1000.
Nucl Eng Des 235, pp. 1583-
1605, ISSN 0029-5493
Hessheimer, M.F., Dameron, R.A. (2006). Containment Integrity Research at Sandia National
Laboratories—An Overview. NUREG/CR-6906, SAND2006-2274P
Huhtiniemi, I., Magallon, D., Hohmann, H. (1999). Results of recent KROTOS FCI tests:
aluminia versus corium melts.
Nucl Eng Des 189, pp. 379–389, ISSN 0029-5493
Kawabata, O. (2004). Analyses of Ex-Vessel Steam Explosion and its Structural Dynamic
Response for a Typical PWR Plant.
ICONE-12, Arlington, VA, USA, pp. 1–9
Krieg, R., Dolensky, B., Goller, B., Hailfinger, G., Jordan, T., Messemer, G., Prothmann, N.,
Stratmanns, E. (2003). Load carrying capacity of a reactor vessel head under molten
core slug impact - Final report including recent experimental findings.
Nucl Eng Des
223, pp. 237-253, ISSN 0029-5493
Magallon, D., Huhtiniemi, I. (2001). Corium melt quenching tests at low pressure and
subcooled water in FARO.
Nucl Eng Des 204, pp. 369–376, ISSN 0029-5493
Meignen, R., Dupas, J., Chaumont, B. (2003). First evaluations of Ex-Vessel Fuel-Coolant
Interaction with MC3D.
NURETH-10, Seoul, Korea, pp. 1–18
Meignen, R., Dupas, J. (2004). Analysis of Ex-Vessel Fuel Coolant Interaction Issue with
MC3D. CSARP 2004, Arlington, VA, USA
Meignen, R. (2005). Status of the Qualification Program of the Multiphase Flow Code MC3D,
Proceedings of ICAPP ‘05, Seoul, Korea, pp. 1–12
Meignen, R., Picchi, S. (2005). MC3D Version 3.5: User’s Guide. IRSN Report,
NT/DSR/SAGR/05-84
Moriyama, K., Takagi, S., Muramatsu, K., Nakamura, H., Maruyama, Y. (2006). Evaluation
of containment failure probability by ex-vessel steam explosion in Japanese LWR
plants.
Journal of Nuclear Science and Technology 43 (7), pp. 774–784, ISSN 0022-3131
Nuclear Power – Operation, Safety and Environment
234
OECD/NEA (2007). OECD Research Programme on Fuel-Coolant Interaction; Steam
Explosion Resolution for Nuclear Applications – SERENA; Final Report.
NEA/CSNI/R(2007)11.
OECD/NEA (2008). Agreement on the OECD/NEA SERENA Project – To address
remaining issues on fuel-coolant interaction mechanisms and their effect on ex-
vessel steam explosion energetics
Sehgal, B.R. (2006). Stabilization and termination of severe accidents in LWRs.
Nucl Eng Des
236, pp. 1941-1952, ISSN 0029-5493
Sehgal, B.R., Piluso, P., Trambauer, K., Adroguer, B., Fichot, F., Müller, C., Meyer, L.,
Breitung, W., Magallon, D., Journeau, C., Alsmeyer, H., Housiadas, C., Clement, B.,
L., A.M., Chaumont, B., Ivanov, I., Marguet, S., Van Dorsselaere, J.P., Fleurot, J.,
Giordano, G., Cranga, M. (2008).
SARNET lecture notes on nuclear reactor severe
accident phenomenology
. CEA, France, p. 415
Seiler, J.M., Tourniaire, B., Defoort, F., Froment, K. (2007). Consequences of material effects
on in-vessel retention.
Nucl Eng Des 237, 1752–1758, ISSN 0029-5493
Schwinges, B., Journeau, C., Haste, T., Meyer, L., Tromm, W., Trambauer, K., Members, S.
(2010). Ranking of severe accident research priorities.
Prog Nucl Energ 52, pp. 11-18,
ISSN 0149-1970
Smith, P.D., Hetherington, J.G. (1994). Blast and Ballistic Loadings of Structures.
Butterworth-Heinemann Ltd., Oxford, ISBN 0 7506 2024 2
Theofanous, T.G. (1995). The Study of Steam Explosions in Nuclear Systems.
Nucl Eng Des
155, pp. 1-26, ISSN 0029-5493
Turland, B.D., Dobson, G.P. (1996). Nuclear science and technology, Molten fuel coolant
interactions: a state of the art report
WASH-1400 (1975). Reactor safety study: An assessment of accident risks in U.S. commercial
nuclear power plants. U.S. Nuclear Regulatory Commission
Part 2
Environmental Effects
11
Radiological Releases and
Environmental Monitoring at
Commercial Nuclear Power Plants
Jason T. Harris
Idaho State University
United States of America
1. Introduction
The generation of electricity from nuclear power has become increasingly important due to
the growing concerns of global climate change. Nuclear energy has long been recognized as
a leading energy source that produces minimal pollution to the environment that can
contribute to this phenomenon. In addition, nuclear power offers an attractive option for
countries looking for energy source diversification. Currently there are 442 commercial
nuclear power reactors operating in the world (International Atomic Energy Agency
[IAEA], 2010, 2011). These power plants contribute about 19% of the electricity production
today. The United States of America (U.S.) has the largest commercial nuclear reactor fleet in
the world with 104 operating reactors (U.S. Nuclear Regulatory Commission [USNRC],
2010). Of these reactors, 69 are pressurized water reactors (PWRs) and 35 are boiling water
reactors (BWRs), located on 65 sites around the country. These power plants contribute
about 20% of the U.S. electricity production.
Although it is known that commercial nuclear power plants release small amounts of
radioactivity into the environment, there is still the potential for these releases to impact
public health. This is especially important today as changes are occurring in nuclear power
plant operations including: higher electric generating capacities, increased power levels due
to mechanical uprates, and plant life extensions. Public health effects must be reexamined as
new light water reactor designs are being considered for construction. In addition, recent
events at multiple nuclear power plants in the U.S. involving unplanned releases, especially
tritium (
3
H), have led to increased scrutiny on monitoring and evaluating releases. Changes
in radiation protection recommendations and regulations also warrant further and
continued investigations in these matters. Although Harris (2007) and Harris & Miller (2008)
have performed numerous studies of nuclear power effluent releases and environmental
monitoring, data collection and analysis must continue to be performed for the entire
nuclear industry.
This chapter focuses on recent research that has been conducted in the areas of commercial
nuclear power radiological releases and environmental monitoring by the author. Although
the emphasis will be on studies performed in the United States of America, international
comparisons will be made where appropriate.
Nuclear Power – Operation, Safety and Environment
238
2. Background
Commercial nuclear power plants release small amounts of radiation into the environment
under normal operating conditions. Many of the radioactive isotopes that are released are in
the form of gaseous or liquid effluents and solid radioactive waste conditioned by the plant.
These releases represent some of the by-products of electrical energy generation (Eisenbud
& Gesell, 1997).
Three categories of radioactive by-products are produced during routine operation of a
commercial light-water reactor: fission products, neutron activation products, and tritium
(Glasstone & Jordan, 1980). Fission products are created as a result of the radioactive decay
of the nuclear fuel. Approximately 300 different nuclides are formed in the operating
reactor. Most of these nuclides are radioactive. Although there is a large quantity of fission
products formed, many have little impact on the radioactive releases to the environment
because of their extremely short half-lives (<1 day), small quantities, or biological
insignificance. Gaseous fission products important to these releases include:
3
H,
85
Kr, and
133
Xe. Iodine, solid at room temperature, is also released as a gaseous effluent due to
vaporization. Important dose significant iodine isotopes include:
131
I,
133
I, and
135
I. Other
decay daughters of produced fission products may also appear in the gaseous effluents as
particulate matter (USNRC, 1976a, 1976b).
Activation products are formed by neutron interactions with oxygen in water and air, with
nitrogen and argon in air, and with impurity corrosion elements. Like fission products,
many of the neutron activation products produced are insignificant in reactor effluents due
to their short half-lives (<1 day) or small quantities. Relevant gaseous activation products
include:
13
N,
14
C,
16
N, and
41
Ar (NCRP, 1985, 1987). Important liquid and solid waste
activation products arising from interaction of neutrons with corrosion and erosion elements
include:
51
Cr,
58
Co,
60
Co, and
59
Fe (Kahn, 1980; USNRC, 1976a, 1976b).
Tritium (
3
H or T), is produced as a result of both nuclear fission (ternary fission) and
neutron activation of deuterium (
2
H). Tritium is typically treated separately because it is
produced in such large quantities compared to any other effluent nuclide and because it
arises from other nuclear reactions. One significant source of tritium is the interaction of
high energy neutrons with boron. Boron is used in PWRs for shim control (as boric acid) and
BWRs as a burnable poison (Glasstone & Jordan, 1980). Tritium is also formed from the
interaction of neutrons with
6
Li (as lithium hydroxide in water treatment).
Typically, the radioactive emissions from operating nuclear power reactors result in
insignificant doses to the general population. In 1988, when 110 nuclear power plants were
operating at 70 sites in the United States, the mean collective effective dose commitment
from all pathways ranged from a low of 1.1 x 10
-5
person-Sv (0.0011 person-rem) to a high of
0.16 person-Sv (16 person-rem). The collective dose commitment for the 150 million persons
living within the 2-80-km annuli was 0.75 person-Sv (75 person-rem) for that year (USNRC
1995). Other studies performed throughout the world have shown similar results for
population doses around nuclear power plants (Walmsley et a.l, 1991; Ziqiang et al., 1996;
Kim & Han, 1999; Nedveckaite et a.l, 2000; Liu et al., 2003; Quindos Poncela et al., 2003).
Harris (2007) performed a study to look at the doses for maximally exposed individuals
from all plants. A review of epidemiological studies of cancer in populations near nuclear
facilities showed that in all scientific reports analyzing nuclear power plants, a cause and
effect relationship between cancer risk and radiation exposure could not be found (Patrick,
1977; Jablon et al., 1990; Shleien et al., 1991; Lopez-Abente et al., 1999).
Radiological Releases and Environmental Monitoring at Commercial Nuclear Power Plants
239
There has been a gradual reduction in both liquid and gaseous emissions from power
reactors due to improvements in fuel performance and radioactive waste treatment system
technology (Harris, 2002). However, the Electric Power Research Institute (EPRI) reports
that although radioactive isotopes captured by these systems reduce effluent quantities,
radioactive solid waste volumes increase (2003). Also, with longer operating times and
license extensions, the accumulation of spent fuel is becoming more important. Many plants
have begun storing spent fuel on-site in independent storage facilities. The ageing of
existing nuclear power facilities and the increasing accumulation of radioactive wastes have
led to an increased emphasis on solid radioactive waste disposal However, at this time
doses to the public have not increased during the handling or transportation of radioactive
waste shipments. Worldwide estimates also show that nuclear power will continue to grow
and thus remain a source of radioactivity exposure to the public.
2.1 Regulatory criteria of releases
The principles that apply to U.S. nuclear power plant radiological releases include
consensus scientific recommendations, governmental regulations (Code of Federal
Regulations [CFR]), and specific criteria in each plant’s operating license. Dose limits,
concepts and models based on scientific agreement about radiation effects are
recommended by the International Commission on Radiological Protection (ICRP) and the
NCRP. Government radiation protection guidance is developed by the U.S. Environmental
Protection Agency (USEPA) and approved by the President to assist federal agencies, such
as the U.S. Nuclear Regulatory Commission (USNRC), in developing radiation protection
regulations. This guidance is usually in agreement with the ICRP or the NCRP. The
regulatory standards developed are then required to be incorporated into each nuclear
power plant as radiological effluent technical specifications (RETS) that are to be followed
through procedures and programs (Andersen, 1995).
Since the inception of nuclear power, federal radiation protection regulations have been
based upon the recommendations of the ICRP. The initial ICRP recommendations,
published as ICRP Publication 1 and ICRP Publication 2, provided dose limits, models, and
radiation concepts. Subsequent to these initial recommendations, the ICRP issued three
major revisions, ICRP Publication 26, ICRP Publication 60, and ICRP Publication 103. These
recommendations lowered the annual dose limits for members of the public and revised
dose models and concepts. ICRP Publication 26 (1977) recommended an annual dose limit of
5 mSv y
-1
(0.5 rem y
-1
) to critical members of the general population (pregnant women and
children). Critical members of the general population are those that are more susceptible to
radiation effects. ICRP Publication 60 (1991) lowered recommended annual dose limits
further to 1 mSv y
-1
(0.1 rem y
-1
) for members of the general population. ICRP Publication
103 (2007) continues with this dose limit. Another important recommendation in terms of
reactor releases is given in ICRP Publication 29. This document provides the Committee’s
recommendations for evaluating pathways between radioactive materials released into the
environment and man (ICRP, 1978).
One important recommendation made by the NCRP, published as NCRP Report 92, is
specifically concerned with public radiation exposure resulting from nuclear power (NCRP,
1987). The report outlines dose concepts, risks, and technical information regarding the
nuclear fuel cycle. In 2011, NCRP will release another recommendation (Report 169) on
effluent and environmental monitoring design. Other organizations, including the United
Nations Scientific Committee on the Effects of Atomic Radiation (UNSCEAR), have had a
Nuclear Power – Operation, Safety and Environment
240
tremendous influence on the understanding of radiation concepts. The UNSCEAR reports
yearly to the General Assembly and periodically issues (every four to five years) the
important publication, Sources and Effects of Ionizing Radiation (2000). Another United
Nations organization, the International Atomic Energy Agency (IAEA), also influences the
practice of radiation protection and issues radiation related reports.
The updated regulations important to nuclear power plant radiological effluents are found
in 40 CFR 190 (USEPA 1977). These regulations include limits on radiation doses received by
members of the public off-site of the nuclear power plant. During normal operation, the
annual dose to any member of the public shall be limited to: 0.025 mSv y
-1
(25 mrem y
-1
) to
the whole (total) body; 0.075 mSv y
-1
(75 mrem y
-1
) to the thyroid; and 0.025 mSv y
-1
(25
mrem y
-1
) to any other organ. The USEPA has also set forth guidelines for the maximum
amount of radioactivity released into the environment (e.g. 5 mCi of
129
I per gigawatt-year of
electrical energy produced).
The USNRC issues standards and regulations for radiation protection and nuclear plant
operations. Standards for radiation protection are contained in 10 CFR 20 (USNRC, 1991).
These standards incorporate the dose concepts and models from the older ICRP Publication
26 and 40 CFR 190. The criteria in 10 CFR 20 regarding dose limitations include: a public
dose limit of 1 mSv y
-1
(0.1 rem y
-1
), compliance with USEPA’s 40 CFR 190 standards, and a
requirement for a licensee survey of radiation levels in unrestricted areas, in controlled
areas, and in effluent releases. Appendix B to 10 CFR 20 includes limits on effluent
concentrations for radiological releases in air and water. These concentration limits are
derived from occupational inhalation and ingestion annual limits on intake (ALIs) adjusted
to reflect the dose limits set forth by the standards.
USNRC standards for nuclear power plant operations are contained in 10 CFR 50. These
standards include criteria for radiological effluent technical specifications, effluent release
design objectives and limits, and notification and reporting for events involving the release
of radioactive materials. Technical specifications on effluents from nuclear power plants are
listed in 10 CFR 50.36a (USNRC, 1996). The specifications require that the licensee comply
with 10 CFR 20; that procedures be established and followed regarding the control of
effluents; that a radioactive waste treatment system be installed, maintained, and used; that
a report be submitted annually to the USNRC regarding effluent releases and the attributed
estimated doses to the public; and that procedures be developed that comply with the
principle of achieving radiation levels ALARA. Appendix I to 10 CFR 50 gives numerical
guides for design objectives and limiting conditions for operation to meet the ALARA
criterion for radiological effluents. Doses to members of the general public from radioactive
material in liquid effluents released to unrestricted areas shall be limited to 0.003 mSv y
-1
(3
mrem y
-1
) to the whole (total) body, and 0.010 mSv y
-1
(10 mrem y
-1
) to any other organ. The
air dose due to the release of noble gases in gaseous effluents is restricted to 0.010 mGy y
-1
(10 mrad y
-1
) for gamma radiation, and 0.020 mGy y
-1
(20 mrad y
-1
) for beta radiation. The
public dose from
131
I,
3
H, and all particulate radionuclides with half-lives greater than eight
days in gaseous effluents is limited to 0.015 mSv y
-1
(15 mrem y
-1
) to any organ. Standards in
10 CFR 50 also cover notification in the event of an abnormal radiological release.
Criteria for nuclear power plant effluents are contained in the radiological effluent technical
specifications (RETS), which are part of the nuclear power plant operating license. The RETS
include the Limiting Condition for Operation (LCO). The LCO is a description of the criteria
that are to be met, the conditions under which the criteria apply, the actions to be taken if
criteria are not met, and surveillance requirements to demonstrate that the criteria have
Radiological Releases and Environmental Monitoring at Commercial Nuclear Power Plants
241
been met. The RETS must also contain a site specific Offsite Dose Calculation Manual
(ODCM). The ODCM contains both the methodology and parameters used in calculating
offsite doses resulting from radiological effluents and the REMP. The USNRC Regulatory
Guide 4.1 outlines the programs for monitoring radioactivity in the environs of nuclear
power plants (USNRC, 1975). The RETS and ODCM must be approved by the USNRC as
part of the license application and approval process. Radiological effluent technical
specifications guidelines are contained in NUREG-0133 (USNRC, 1978). The annual effluent
report covers plant operations from the previous calendar year. The report includes a
summary of the quantities of radiological effluents and solids discharged by the plant.
USNRC Regulatory Guide 1.112 aids nuclear power plants in calculating effluent releases.
2.2 Environmental monitoring
Prior to the issuance of a construction permit or an operating license for a nuclear power
station, federal agencies (i.e. USNRC) are required to assess the potential environmental
effects of that facility to ensure that issuance of the permit or license will be consistent with
the national environmental goals prescribed by the National Environmental Policy Act
(NEPA) of 1969 and the Federal Water Pollution Control Act. In order to obtain information
needed for this assessment, applicants are required to submit a report on the potential
environmental impacts of the station and associated facilities. After the station becomes
operational, an annual environmental report must be submitted to ensure continued
compliance of the requirements set forth in the facility’s license and of the Acts stated
previously.
Radiological environmental monitoring programs at nuclear power plants are required in
accordance with the Code of Federal Regulations. Development and maintenance of these
programs are under the guidance of several federal documents. These radiological
environmental monitoring programs are established to monitor the radiological impact of
reactor operations on the environment. Objectives of these programs include: identification,
measurement and evaluation of existing radionuclides in the environs of the facility and
fluctuations in radioactivity levels which may occur; evaluation of the measurements to
determine the impact of operations on the local radiation environment; collection of data to
refine radiation transport models; verification that radioactive material containment systems
are functioning to minimize environmental releases to levels that are as low as reasonably
achievable (ALARA) and; demonstration of compliance with regulations. Implicit in these
objectives are the requirements to trend and assess radiation exposure rates and
radioactivity concentrations in the environment that may contribute to radiation exposures
to the public. The results of the REMP are submitted as part of the plant’s annual
environmental report.
Each plant establishes their own, unique REMP program to reflect site-specific conditions
and surrounding population characteristics. The program consists of preoperational and
operational components. The preoperational program is conducted in part to measure
background levels and their variations in environmental media in the area surrounding the
plant. Environmental media include: milk produced from cows or goats, broadleaf
vegetation, fish, fruits and vegetables, edible aquatic invertebrates, surface water, drinking
water and ground water.
Each plant is to also make changes to its REMP program as conditions change. But, it has
been reported recently that many plants are decreasing their programs due to budget
constraints and lack of positive radioactivity measurements. This reduction can lead to
Nuclear Power – Operation, Safety and Environment
242
decreased litigation protection, decreased public confidence, and potential unreported or
undetected releases. Reduced REMP programs have led to recent public opinion and
regulatory problems for several facilities due to unexpected and/or undetected tritium
releases. Decreased lower limits of detection (LLDs) and minimal detectable activities
(MDAs) reportedly have led to newly quantifiable low levels of many radionuclides in the
environs around nuclear power stations. Changes in operating conditions may also lead to
new radionuclide transport pathways being developed, as has been seen with precipitation
scavenging and concentration in ice.
Ultimately, a nuclear power plant’s REMP program is designed to assess the impact of
radiological releases on the environment and the public. Public opinion of the nuclear
power industry has traditionally been very troubled, especially with the accidents at Three-
Mile Island and Chernobyl. Positive public opinion to nuclear power can only be achieved
through truthfulness by the nuclear power company regarding operations and radiological
releases and accurate and comprehensive monitoring of these releases.
3. Effluent release study
As commercial nuclear power electrical generation steadily increases in the U.S. and the rest
of the world, it has become even more important to evaluate the release of radioactive
materials into the environment. An easy way to track industry wide effluent releases is by
performing trend analyses. Accumulated data may also be used for analysing reactor power
up-rate consequences, protecting the nuclear power industry against litigation, and for
assisting in new power plant siting. Most importantly, collecting and maintaining an
effluent database is necessary in maintaining a favourable public perception regarding the
low environmental and biological impact of nuclear power. This is especially important now
as several recent, inadvertent releases of radioactive materials from nuclear power plants
have occurred. Because of these circumstances, the author has compiled and analysed the
effluent data for all U.S. commercial nuclear power plants since 1995. Presented here is also
an update of the comprehensive study performed by Harris & Miller (2008).
The classification and monitoring of liquid and gaseous radiological releases is fairly
uniform around the world. The classification is based on the nuclide, chemical or physical
form, and dose or activity significance. In the U.S., gaseous effluents are divided into fission
and activation gases, iodines, particulates (with half-lives greater than eight days), and
tritium. Liquid effluents are divided into fission and activation products, dissolved and
entrained gases, tritium, and gross alpha activity. International organizations and other
nations use the same categories, but combine the fission and activation products and the
dissolved and entrained gases in liquid effluents (UNSCEAR, 2000; Harris, 2002).
The classification of radioactive releases is important because dose calculations are based
upon them. For example, the collective effective doses calculated by UNSCEAR (2000) use
these effluent categories. The groupings also allow plants and nations to compare and
benchmark with another. Unlike the simplified general UNSCEAR model, the USNRC
model requires specific nuclide, meteorological, and site specific conditions. Hence, this
model provides more accurate estimates of dose.
Other studies have been performed to assess the doses from nuclear power radiological
releases. Vold (1984) determined the ratio of the collective effective dose equivalent (CEDE)
via a specified ingestion pathway relative to that CEDE by inhalation per annual releases of
a radionuclide. Kim & Han (1999) and Liu et al. (2003) assessed the impact of tritium
Radiological Releases and Environmental Monitoring at Commercial Nuclear Power Plants
243
released from nuclear power plants in China. Both of these studies confirmed that the doses
were less than 1% of the regulatory limits. Ziqiang et al. (1996) reported similar results not
only for tritium, but for other radionuclides as well.
What is very common in the nuclear power industry is trending and benchmarking of data.
This is done to improve plant operations and management. Many organizations that oversee
different aspects of nuclear power plants use these methods for comparison. These
comparisons may be advantageous or detrimental to a plant. For example, with radiological
releases, high activities compared to other plants can lead to lower profits due to higher
premiums from American Nuclear Insurers (ANI). It can also lead to scrutiny from the
Institute of Nuclear Power Operations (INPO) and greater surveillance from USNRC. Thus,
these comparisons are very important. Gilbert (1994) identifies statistical analyses suitable
for detecting trends in environmental contamination data. Accurate trend analyses can aid
plants in these aforementioned areas. Trend analyses were performed for the data over the
15 year period using the Mann-Kendall non-parametric test. Inspections of release trends
over the fifteen year period help identify areas of concern with these releases. Future
estimates of release radioactivity and public doses can then be made from these analyses.
3.1 Methodology
The data utilized for the effluent release study were taken from the annual radioactive
release reports provided by the nuclear power plants to the USNRC as required in their
operating license conditions. These reports were either provided directly to the author from
the licensee or taken from the USNRC Agency wide Documents Access and Management
System (ADAMS). The reports provide categorical effluent release data, nuclide specific
radioactivity, and site specific data needed for dose calculations. Population information not
provided by the licensees was taken from appropriate census reports (U.S. Census Bureau,
2010).
Data was analysed for those reactors that have operated for the 15 year period of 1994-2009.
This length of time is long enough to allow plants to stabilize in the event of long shutdown
periods and allows evaluation of plants for at least seven refuelling cycles. Events that may
affect releases, such as power-uprates and failed fuel from defects, will also show up in this
period. The beginning of this data set also coincides with the cessation of tracking
radiological effluents by the U.S. in 1994. In this time frame, 103 reactors were operating.
Browns Ferry Unit 3 began operation in 2006, to become the 104
th
operating reactor.
Effluent radioactivity was obtained from data reported by the nuclear power plants in their
annual radioactive material release reports. The effluent data was compiled for all operating
PWR and BWR plants from 1995 - 2005. The completeness of the data was 98%. In keeping
with U.S. nuclear power effluent report formatting, data was compiled and analysed using
the same categories as those listed in USNRC Regulatory Guide 1.21. The four gaseous
effluent categories used were: fission and activation gases (F/A), total iodine (
131
I),
particulate matter or particulates, and tritium. The three liquid effluent categories used
were: fission and activation products, dissolved and entrained gases, and tritium. Because
the radioactivity levels of the fission and activation products and dissolved and entrained
gases are several orders of magnitude smaller than tritium, those two categories were added
together and listed as “F/D”. This category replicates the reporting done by UNSCEAR.
Gross alpha radioactivity was not included in this study.
Trend analyses were performed for the data over the time period using the Mann-Kendall
non-parametric test. This procedure was used since missing values were allowed and the
Nuclear Power – Operation, Safety and Environment
244
data need not conform to any particular distribution (Gilbert, 1994). Inspection of trends
over the time period identifies the overall direction of industry effluent releases and can
roughly be used to predict future releases.
For this updated study, one dose assessment methodology was used. The collective effective
doses (CED) were calculated for the U.S. population using the UNSCEAR methodology. For
these dose calculations, the effluent data was normalized. This was achieved by taking the
amount of radionuclides released per unit of electrical energy generated each year. This
method is the most common way to normalize effluent data. The electrical energy generated
per year was obtained by multiplying the net electrical energy generated by the capacity
factor. Capacity factor is defined as the gross electricity generated divided by the product of
the licensed capacity and reference time. Normalizing data in this manner takes into account
the operational performance of the nuclear power plant. However, it also assumes that
effluent release amounts are a direct consequence of operation time. The author cautions
against making simplistic comparisons of radioactive releases with the electrical energy
generated because of the many factors which affect the amount of radioactive materials
released, including the condition of the fuel, primary system integrity, design of effluent and
radioactive waste treatment systems, maintenance activities, operations, and equipment
performance.
3.2 Results and discussion
3.2.1 Radiological effluent releases
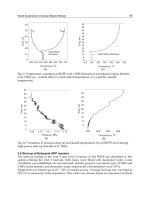
The annual variation of total nuclear power plant radioactivity released in gaseous effluents
in PWRs and BWRs are shown in Figs. 1 and 2, respectively. As expected, the activity from
PWR releases is higher than that from BWRs due to the greater number of plants. Regardless
of this fact, the average tritium release from PWRs is also higher due to chemistry practices
that create more tritium in the plant. Nearly every category from both reactor types is fairly
level in terms of activity released for the entire time period. The evaluation of the data over
the time period partly eliminates variations in annual values. The advantage of using 15
years of data is that operation anomalies, such as long shutdown times for maintenance, are
averaged out. The one notable exception appears in the PWR particulate category. In 2003,
one plant experienced an annual release over five orders of magnitude above the mean. This
single event was significant enough to skew the entire industry release activity, especially
since the annual radioactivity released in particulate matter is so low compared to tritium or
fission and activation gases. The increase in 2005 was due to higher activity releases by
several plants.
The annual variation of total nuclear power plant radioactivity released in liquid effluents in
PWRs and BWRs are shown together in Fig. 3. As expected, and for reasons similar to that of
the gaseous releases, PWR liquid radioactivity in releases is higher than in BWRs. Liquid
releases have stayed very constant over the 11-year period. The most notable exception is
the pronounced decline in BWR non-tritium (F/D) radioactivity from 2003 - 2007.
3.2.2 Radiological effluent trends
U.S. industry effluent trends were evaluated using the Mann-Kendall non-parametric test.
The Mann-Kendall test was performed as follows: For any given release category, x, its
feature vector consists of the release summation from all plants appearing in a given year i.
These release activities are ordered from the first year, 1995, to the final year, 2009, that data
was gathered.
Radiological Releases and Environmental Monitoring at Commercial Nuclear Power Plants
245
1994 1996 1998 2000 2002 2004 2006 2008 2010
10
-1
10
0
10
1
10
2
10
3
10
4
10
5
10
6
F/A Gases
Iodines
Tritium
Particulates
Activity (GBq)
Year
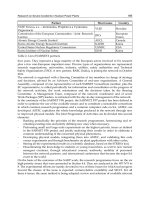
Fig. 1. Variation of total radionuclide activity released in gaseous effluents from PWR plants
1994 1996 1998 2000 2002 2004 2006 2008 2010
10
0
10
1
10
2
10
3
10
4
10
5
10
6
10
7
F/A Gases
Iodines
Tritium
Particulates
Activity (GBq)
Year
Fig. 2. Variation of total radionuclide activity released in gaseous effluents from BWR plants
Nuclear Power – Operation, Safety and Environment
246
1994 1996 1998 2000 2002 2004 2006 2008 2010
10
0
10
1
10
2
10
3
10
4
10
5
10
6
10
7
PWR Tritium
PWR F/D
BWR Tritium
BWR F/D
Activity (GBq)
Year
Fig. 3. Variation of total radionuclide activity released in liquid effluents from PWR and
BWR plants
The x value for each year is compared to all other years greater than that year, and Kendall’s
statistic S is calculated as follows:
1
11
)sgn(
n
k
n
kj
kj
xxS
(1)
where:
0,1
0,0
0,1
)sgn(
kj
kj
kj
kj
xxif
xxif
xxif
xx
Generally, if a dataset displays a consistently increasing or decreasing trend, S will be
positive or negative, respectively, with a larger magnitude indicating the trend is more
consistent in its direction. By using the
sgn function, the algorithm used was able to detect
trends featuring either large or small increase steps from year to year equally. The S statistic
is then compared to the corresponding P-value (Hollander & Wolfe, 1999).
Under the null hypothesis, H
0
, that there is no trend displayed by the time series, the
distribution of S is then expected to have a zero-mean and variance. The Mann-Kendall test
was performed on BWR plant releases, PWR plant releases, and all plant releases (BWR and
PWR combined) at a significance level of 0.05.
The results of the trend test are shown in Table 1. Over the past 15 years, it can be seen that
for most effluent categories, the releases are level, meaning there is no increasing or
decreasing trend. For these categories, improvements in radioactive waste treatment and
Radiological Releases and Environmental Monitoring at Commercial Nuclear Power Plants
247
reactor operations are offset by increased power production, increased capacity factors, and
power up-rates. Looking at PWRs only, gaseous fission and activation products and liquid
F/D have decreased while liquid tritium has increased. Reduction in the fission and
activation products over the years is probably a direct result of longer holdup times for
radioactive decay. In addition lower fission and activation product activities may be due to
improved fuel performance from better manufacturing methods. Also, longer operation
times in recent years provide stability to the reactor, leading to less fuel shock and defects.
The increasing trend for liquid tritium activity is due to an increase in liquid discharges by
these plants. Formerly zero-discharge plants have begun to release liquids again to avoid
build-up of their tritium inventory. Coupled with this practice, over the last fifteen years
many plants have reduced recycling of boron for reactor control. This procedure contributes
to increased tritium production.
Release Category S Statistic Trend
PWR Gaseous F/A gases -61 Decreasing
PWR Gaseous Iodines -15 None
PWR Gaseous Tritium -3 None
PWR Gaseous Particulate -11 None
PWR Liquids Tritium 57 Increasing
PWR Liquids—F/D -35 Decreasing
BWR Gaseous F/A gases -41 Decreasing
BWR Gaseous Iodines -13 None
BWR Gaseous Tritium 31 Increasing
BWR Gaseous Particulate 7 None
BWR Liquids Tritium 27 Increasing
BWR Liquids—F/D -7 None
Total Gaseous F/A gases -65 Decreasing
Total Gaseous Iodines -21 Decreasing
Total Gaseous Tritium -3 None
Total Gaseous Particulate 13 None
Total Liquids Tritium 57 Increasing
Total Liquids—F/D -13 None
Table 1. Mann-Kendall trend results for U.S. commercial nuclear power plant radiological
effluent releases from 1995 – 2009
For BWRs, liquid tritium and gaseous releases have increased and gaseous fission and
activation releases have decreased. The increase in gaseous and liquid tritium are relatively
new phenomenon and is probably related more to the increased power production and
capacity factors over the last several years than anything else. Looking at the entire industry
(PWRs and BWRs combined), all effluent releases except gaseous fission and activation
products and iodine and liquid tritium are level. Because PWRs make up 66% of the U.S.
industry, their releases have a greater impact on the overall release trends, as is evident with
the increasing liquid tritium.
Nuclear Power – Operation, Safety and Environment
248
3.2.3 Radiological impact of effluent releases
Tracking effluent release quantities is important in determining radioactivity levels in the
environment. However, dose determination of the effluents must be performed to estimate
the human effects of these radiation sources. The collective effective dose (CED) from
radiological effluent releases was obtained using an average collective dose calculation
method used by UNSCEAR. UNSCEAR (2000) calculates population dose by first
calculating the CED per unit release of radionuclides released from reactors and then
normalizes the value with the electrical energy generated. The CED is divided according to
type of release (airborne or liquid), radionuclide category (noble gases, tritium, C-14, iodine,
and particulate matter), and pathway (immersion, ingestion, inhalation, and external
irradiation. The normalized collective effective dose model is given by:
i
i
i
CE
D
E
A
D
(2)
where: A
i
=activity of release category i (GBq); D
CE
= total CED (person-Sv GW
-1
y
-1
); D
i
=
collective dose for release category i (person-Sv PBq
-1
); and E =energy produced by the
nuclear reactor (GW y
-1
).
The dose assessment procedures for this model are applied to a model site with
representative environmental conditions. The average population density used is 20 km
-2
within 2,000 km of the site. Within 50 km of the site, the population density is taken to be
400 km
-2
. These parameters were obtained from previous UNSCEAR assessments and take
into account the transport and dilution of released radionuclides from nuclear installations.
The parameters used are assumed to not underestimate dose. Using this model site, the
collective effective dose per unit release is obtained for the different release categories. Due
to its lack of specificity, this model should be used for general comparisons only. The
collective effective doses estimated from commercial nuclear power plant radiological
effluent releases are very low especially when compared to other man-made sources of
radiation. The doses only represent up to a few percent of the regulatory limits (Harris &
Miller, 2008).
From the collective effective doses, effective doses were computed for the entire U.S.
population to give average annual doses. This was done by taking the CEDs calculated for
each release category, gaseous and liquid, and dividing them by the U.S. population for
each year (U.S. Census Bureau, 2010). The effective doses were than summed to give a total
dose for each person. The results of these effective doses are given in Table 2. For the 15-year
period, total effective doses ranged from 5.42 × 10
-8
mSv (5.42 × 10
-6
mrem) to 1.68 × 10
-7
mSv (1.68 × 10
-5
mrem). The doses to an average person would be expected to be even lower
since many do not live near a nuclear power plant. This is just one of several ways to
calculate a very general effective dose for the population.
4. U.S. REMP evaluation
An evaluation of all U.S. nuclear power plant radiological environmental monitoring
programs (REMP) was conducted from 1995-2007. An attempt was made to assess the
significance of the radionuclides detected in the environment compared to natural and
other man-made radiation sources. It is important to note that detected concentrations of
radionuclides in the local environment as a result of nuclear power radiological releases
Radiological Releases and Environmental Monitoring at Commercial Nuclear Power Plants
249
are very low. The percentage of plants sampling different pathways, the percent
cumulative exposures, and differences between control and indicator measurements were
determined.
4.1 Methods
Inspection and analysis of the industry REMP data was taken from the annual summary
tables from each nuclear power plant’s annual radiological environmental monitoring
report. The summary data includes the following parameters: sample medium, type and
number of analyses performed, required (LLD), the mean and range of the positive
measured values of the indicator locations, the mean, range, and location of the highest
indicator annual mean, the mean and range of the positive measured values of the control
locations, and the number of non-routine reports sent to the USNRC. In this evaluation, the
highest indicator values were compared to the control values.
The following environmental pathways and sample analyses (in parentheses) were
investigated: bottom/shoreline sediment (gamma spectral analysis), fish (gamma spectral
analysis), edible aquatic invertebrates (gamma spectral analysis), surface water (gamma
spectral analysis, gross beta, and
3
H), drinking or potable water (gamma spectral analysis,
gross beta, and
3
H), ground water (gamma spectral analysis, gross beta, and
3
H), air
particulate filters (gamma spectral analysis and gross beta), airborne radioiodine (
131
I), milk
(
90
Sr and
131
I), food products such as fruits and vegetables (gamma spectral analysis),
broadleaf vegetation (gamma spectral analysis), soil (gamma spectral analysis), grass
(gamma spectral analysis), and direct radiation using thermoluminescent dosimeters
(TLDs). In addition, pathways not normally sampled by most plants, like precipitation, were
also studied.
For all data, only positive measured values were used in the statistical calculations. During
the study period there were over 1.6 × 10
6
analyses performed on environmental media
collected as part of the required monitoring programs. Broken down, this averages to about
1.27 × 10
5
analyses y
-1
and 2.0 × 10
3
analyses site
-1
y
-1
.
4.2 Results and discussion
4.2.1 Cumulative dose contribution from effluent release pathways
The percent contribution by each pathway to the public was determined using previously
complied effluent data. The calculations provided by each plant from their REMP data
identified the most important pathways for their respective sites. Fig. 4 shows the mean
results for the seven most frequently sampled pathways or media for all plants. The greatest
dose contributor comes from direct radiation released by the plant. This is especially true for
BWR plants, which have no secondary loop for the reactor produced steam.
The water, milk, and sediment media, at about the same level, provide the next highest
percent contributions to dose. Water media, which includes surface, ground, and drinking
types, may contribute to dose to a much larger extent depending on the plant location.
Those that are on saltwater sites may not have a known drinking water pathway, or dilution
may be so great that submersion doses are low or non-existent. On the other hand, plants on
freshwater sites typically have drinking water pathways and less dilution of their effluents
(with the exception of sites located on the Great Lakes). All other pathways contribute to a
much lesser extent.
Nuclear Power – Operation, Safety and Environment
250
Year
Electrical
Energy
Produced
(GW)
U.S.
Population
(x 10
4
)
Annual Effective Dose (mSv GW
-1
person
-1
)
Gaseous Releases Liquid Releases Total
F/A Gases
Total
I-131
Tritium Particulates Tritium F/D Gases
1995 77.1 266,557 8.36 x 10
-8
1.95 x 10
-10
1.68 x 10
-8
1.28 x 10
-9
2.93 x 10
-8
2.90 x 10
-8
1.60 x 10
-7
1996 77.3 269,667 7.79 x 10
-8
2.75 x 10
-10
1.31 x 10
-8
1.10 x 10
-9
3.18 x 10
-8
2.89 x 10
-8
1.53 x 10
-7
1997 71.9 272,912 1.08 x 10
-7
1.29 x 10
-10
1.90 x 10
-8
1.47 x 10
-9
2.71 x 10
-8
1.22 x 10
-8
1.68 x 10
-7
1998 74.9 276,115 1.38 x 10
-8
2.80 x 10
-10
1.46 x 10
-8
2.66 x 10
-9
2.68 x 10
-8
1.37 x 10
-8
7.19 x 10
-8
1999 82.3 279,295 7.00 x 10
-9
1.75 x 10
-10
1.57 x 10
-8
3.06 x 10
-10
2.83 x 10
-8
1.10 x 10
-8
6.24 x 10
-8
2000 85.2 282,402 7.98 x 10
-9
1.80 x 10
-10
1.48 x 10
-8
1.08 x 10
-9
3.05 x 10
-8
1.07 x 10
-8
6.53 x 10
-8
2001 87.8 285,329 5.58 x 10
-9
9.21 x 10
-11
1.50 x 10
-8
8.57 x 10
-10
2.54 x 10
-8
7.97 x 10
-9
5.49 x 10
-8
2002 88.6 288,173 8.42 x 10
-9
1.95 x 10
-10
1.73 x 10
-8
6.62 x 10
-10
2.70 x 10
-8
1.96 x 10
-8
7.32 x 10
-8
2003 87.0 291,028 1.44 x 10
-8
3.79 x 10
-10
1.51 x 10
-8
3.04 x 10
-9
2.87 x 10
-8
1.15 x 10
-8
7.30 x 10
-8
2004 88.1 293,907 6.94 x 10
-9
2.67 x 10
-10
1.39 x 10
-8
2.07 x 10
-10
2.64 x 10
-8
6.38 x 10
-9
5.42 x 10
-8
2005 88.6 295,753 7.49 x 10
-9
9.78 x 10
-11
1.59 x 10
-8
5.11 x 10
-9
2.77 x 10
-8
5.99 x 10
-9
6.23 x 10
-8
2006 89.3 298,593 5.40 x 10
-9
9.84 x 10
-11
1.28 x 10
-8
4.24 x 10
-10
2.96 x 10
-8
6.18 x 10
-9
5.45 x 10
-8
2007 88.9 301,580 4.82 x 10
-9
1.09 x 10
-10
1.13 x 10
-8
9.48 x 10
-9
2.61 x 10
-8
4.95 x 10
-9
5.67 x 10
-8
2008 88.9 304,375 4.44 x 10
-9
1.03 x 10
-10
1.21 x 10
-8
1.85 x 10
-9
2.82 x 10
-8
1.01 x 10
-8
5.68 x 10
-8
2009 86.8 307,007 5.77 x 10
-9
7.31 x 10
-11
1.14 x 10
-8
3.32 x 10
-10
2.41 x 10
-8
1.41 x 10
-8
5.58 x 10
-8
Table 2. Average effective doses received by members of the public in the U.S. from
commercial nuclear power plant radiological effluent releases
0
5
10
15
20
25
30
35
40
45
50
Water (ingestion and
submersion)
Food Products
Milk
Bottom/Shoreline
Sediment
Fish/Invertebrates
Direct Radiation
Air Particulate/Iodine
(inhalation)
Percent Contribution of Dose
Pathway
Fig. 4. Percent total cumulative dose contribution of various pathways resulting from U.S.
nuclear power plant effluent releases
Radiological Releases and Environmental Monitoring at Commercial Nuclear Power Plants
251
4.2.2 Plant pathway sampling
The investigation of the number of pathways sampled by each plant is important to gauge
the diversity and scope of each plant’s REMP in relation to each other. Used in conjunction
with the results from Section 4.3.1, omissions of pathways can be reconsidered based on the
overall percent contribution of dose. Obviously, programs will vary greatly since the power
plant sites themselves also vary greatly. For example, plants may be located on coastal sites,
in river valleys, in arid locations, or on small, man-made bodies of water. The level of
human activity around the plant will also influence the degree of surveillance. The number
of media sampled by plants ranged from five to more than 20, with a mean of 11.
The results of the percentage of plants sampling different media in their REMP are
displayed in Fig. 5. As expected, 100% of plants sample for air particulate matter,
131
I and
direct radiation. Direct radiation is important as it is the greatest dose contributor to
members of the public, especially from BWR plants. Milk, once sampled by nearly all plants,
is now sampled by only 52% of plants. This is due to the reduction of the milk pathway
(from cows or goats) in areas around plants. In lieu of milk sampling, plants may substitute
broadleaf vegetation. One important characteristic of the data is that nearly 56% of plants
sample groundwater. Recent unplanned tritium releases went unnoticed at several plants
due to the lack of groundwater monitoring at those sites. In part due to this study and a
national industry initiative, all plants began a groundwater monitoring program starting in
2006. At the time of this research and writing, updated data on nuclear power plant
groundwater monitoring was not available. The dose important fish pathway is sampled by
88% of plants. Edible aquatic invertebrates are sampled by only 19% of the plants, mainly
due to the lack of the pathway.
0.0
10.0
20.0
30.0
40.0
50.0
60.0
70.0
80.0
90.0
100.0
Direct Radiation - Gamma
…
Air Iodine - I-131
Air Particulate - Gross Beta
Air Particulate -Gamma
Surface Water -Gross Beta
Surface Water - H-3
Surface Water - Gamma
Drinking Water - Gross Beta
Drinking Water - H-3
Drinking Water - Gamma
Ground Water - Gross Beta
Ground Water - H-3
Ground Water - Gamma
Milk - Strontium
Milk - Gamma
Fish - Gamma
Invertebrates - Gamma
Sediments
…
Vegetation - Gamma
Food Products - Gamma
Soil - Gamma
Grass -Gamma
Percent of U.S. Plants Sampling
Pathway and Analysis
Fig. 5. Percent of U.S. nuclear power plants sampling different REMP pathways and
performing specific analyses
Nuclear Power – Operation, Safety and Environment
252
4.2.3 REMP summary
Numerical results for the REMP summary are not listed here due to the breath of the study.
Comparisons are only made between the control samples and the indicator or test
measurements. Direct radiation pathways include radiation from buildings and plant
structures, airborne material that might be released from the plant, cosmic radiation,
“fallout”, and the naturally occurring radioactive materials in soil, air and water. Analysis of
the TLDs, which are used by all plants, indicated that there were no increased radiation
levels attributable to plant operations. The mean BWR exposure was slightly higher than
that for PWR plants, but the control locations actually gave higher mean values for all plant
types.
Airborne pathway measurements include analyses of
131
I, gross beta, and gamma spectra.
For all
131
I measurements, the values were below the LLD. Therefore, the reported mean and
median measurements are for half of the LLD values. For the entire 13 years, only one plant
reported an indicator value above the LLD. The gross beta and gamma spectral analyses
showed no difference between the control and indicator stations. These airborne pathway
measurements indicated that there was no increased radioactivity attributable to plant
operations.
Terrestrial pathways that include milk, vegetation, grass, and food products, all gave
calculated mean indicator measurements that were below that of the controls, Similarly for
all waterborne pathways (drinking water, ground water, surface water, fish and
invertebrates, and sediments), measurements of the media indicated that there was no
adverse radiological impact to the surrounding environment attributed to plant operations
for the study period. Individually, several plants have had measurements that resulted in
indicator values being significantly higher than those from control stations.
The summary data strongly suggest that for the great majority (>99.9%) of the analyses, the
control and indicator concentrations were indistinguishable. Potential plant produced
radionuclides were detected in both indicator and control locations. In the past 13 years, the
concentration of radionuclides in the environment has stayed nearly level. Prior to this time,
radionuclide concentrations showed significant downward trends, mainly due to the decay
of “fallout” radionuclides, evidenced in the historical data provided by the plants. The
overall trend of the REMP data for these plants is “de minimis” levels of anthropogenic
radioactivity with occasional samples showing radioactivity above the LLD. These data also
indicate no correlation between total dose and distance from the plants.
The analytical results from the REMP study demonstrate that the routine operation of all
facilities had no significant or measurable radiological impact to the environment for the
study time period. Also, these environmental surveillance programs continued to
demonstrate that the doses to members of the public as a result of nuclear plant operations
remained significantly below the federally required dose limits specified in 10 CFR 20 and
40 CFR 190.
5. Tritium recapture study
Tritium is an isotope of hydrogen that decays with a half-life of 12.3 y to helium (
3
He), while
emitting a low energy beta particle (18.6 keV). In nuclear reactors, tritium is formed in two
different ways: by ternary fission of uranium, and by activation (Luykx & Fraser, 1986).
Produced tritium that ultimately ends up in the nuclear reactor coolant can then be released
into the environment through waste discharge in either gaseous or liquid forms (Kim &
Radiological Releases and Environmental Monitoring at Commercial Nuclear Power Plants
253
Han, 1999). Because tritium is generated in very large volumes, it is the predominant
gaseous and liquid effluent released by these reactors.
Although tritium is not considered to be a particularly toxic radionuclide (Hill and Johnson
1993) and releases by commercial nuclear power plants have traditionally been well below
regulatory limits, control and monitoring is important because of sensitive public concerns
regarding radioactivity releases (Andersen 1995; Liu et al 2003). This is especially vital at the
present time because recent, unplanned tritium releases have occurred at several nuclear
power plants in the U.S. These unplanned releases may result in additional dose both to
occupational workers and members of the public. This has led to increased scrutiny by plant
owners and government agencies. In 2007, Harris also reported that the largest number of
non-routine environmental sampling results was from tritium in surface water.
This section describes research conducted at the Cook Nuclear Plant (U.S.) to investigate the
behaviour of tritium released in airborne effluents. In addition to studying the behaviour
and movement of tritium in the environment, the study has been conducted to help develop
a sampling and analysis protocol for other plants to adopt. Methods and results are
primarily taken from Hinchcliffe, 2010.
5.1 Background
At the Cook Nuclear Plant, a site consisting of two PWRs, an event in 2007 set off an
investigation into tritium release on the site. The plant is located in the state of Michigan
along the eastern shore of Lake Michigan. In May of that year sampling began on the site as
a result of a leak containing tritium found outside the auxiliary building. This sampling
resulted in elevated tritium levels being discovered in the north storm drain outfall, which
drains into Lake Michigan. This outfall had previously been sampled on a semi-annual basis
with no previous indication of elevated tritium levels (Harris et al., 2008). The investigation
concluded that tritium originating in the spent fuel pool was leaving the monitored vents on
top of the containment buildings of both units and contributing to the elevated levels.
Findings led to increased sampling of precipitation, air-conditioning condensate, surface
and well water, and frost formed in refrigerators/freezers (Harris et al. 2008). The
importance of precipitation was noted in the form of washout in which tritium can be
scavenged by falling raindrops and tritium vapour can exchange with ordinary water in the
atmosphere (Chamberlain & Eggleton, 1964; Tokuyama & Oonishi, 1997; Harris et al., 2008).
In this way, precipitation becomes contaminated with tritium and sampling can be used to
calculate a washout coefficient. This coefficient allows for estimation of tritium washout due
to the precipitation which can be used to estimate the extent of tritium recapture on site
property (Harris et al., 2008).
After an initial study in 2007 it was decided that additional sampling should be performed
to determine the variations in recapture on the site as the weather changed through the year,
and that snow should be sampled during the winter. Snow was sampled to determine if
there was a difference in washout between rain and snow and to determine if recapture of
tritium occurred differently with snow than it did with rain.
5.2 Methodology
The investigation of tritium washout was performed by taking samples at pre-determined
site locations and analysing the collected samples for tritium. For rain collection, gauges