Advanced Model Predictive Control Part 9 pot
Bạn đang xem bản rút gọn của tài liệu. Xem và tải ngay bản đầy đủ của tài liệu tại đây (596.04 KB, 30 trang )
Model Predictive Control Strategies for Batch Sugar Crystallization Process
229
Stage Action Control
Charge
The steam valve is closed and the stirrer is off.
The vacuum pressure changes from 1 to 0.23 bar.
The vacuum pressure reaches 0.5 bar, feeding
starts with max rate.
Liquor covers 40 % of the vessel height.
No control
The feed valve is
completely open
Concentration
The vacuum pressure stabilizes around 0.23 bar.
The stirrer is on.
The volume is kept constant.
The steam flowrate increases to 2 kg/s
The supersaturation reaches 1.06, the feeding is
closed, the steam flowrate is reduced to 1.4 kg/s
Control loop 1
Controlled
variable: Volume;
Manipulated
variable: liquor
feed flowrate
Seeding and
setting the
grain
The supersaturation reaches 1.11.
Seed crystals are introduced.
The steam flowrate is kept at the minimum for
two minutes.
No control
The feed valve is
closed
Crystallization
with liquor
(phase 1)
The steam flowrate is kept around 1.4 kg/s.
The supersaturation is controlled at the set point
1.15.
Control loop 2
Controlled
variable:
supersaturation
Manipulated
variable: liquor
feed flowrate
Crystallization
with liquor
(phase 2)
The volume of crystallizer reaches ≈ 22 m
3
.
The feed valve is closed.
The supersaturation is controlled at the set point
1.15.
The stirrer power reaches 20.5 A.
Control loop 3
Controlled
variable:
supersaturation
Manipulated
variable: steam
flowrate
Crystallization
with syrup
The steam flowrate is kept around the maximum
of 2.75 kg/s. (hard constraint).
The volume fraction of crystals is kept at the set
point 0.45.
The volume reaches its maximum value (30 m
3
)
The feed valve is close.
Control loop 4
Controlled
variable: volume
fraction of crystals.
Manipulated
variable: syrup
feed flowrate
Tightening
The stirrer power reaches the maximum value of
50 A (hard constraint).
The steam valve is closed.
The stirrer and the barometric condenser are
stopped.
No control
Table 1. Summary of the sugar crystallization operation strategy.
Advanced Model Predictive Control
230
to maintain the reference value of the supersaturation. When all liquor quantity is
introduced, the feeding is stopped and the supersaturation is now kept at the same set point
of 1.15 by the steam flowrate as the manipulated variable. This constitutes the third control
loop. The heat transfer is now the driving crystallization force. A typical problem of this
control loop is that at the end of this stage the steam flowrate achieves its maximum value of
2.75 kg/s but it is not sufficient to keep the supersaturation at the same reference value
therefore a reduction of the set point is required. The stage is over when the stirrer power
reaches the value 20.5 A.
Crystallization with syrup (stage 5): A stirrer power of 20.5A corresponds to a volume
fraction of crystals equal to 0.4. At this moment the feed valve is reopened, but now a juice
with less purity (termed syrup) is introduced into the pan until the maximum volume (30
m
3
) is reached. The control objective is to maintain the volume fraction of crystals around the
set point of 0.45 by a proper syrup feeding. This constitutes the fourth control loop.
Tightening (stage 6): Once the pan is full the feeding is closed. The tightening stage consists
principally in waiting until the suspension reaches the reference consistency, which
corresponds to a volume fraction of crystals equal to 0.5. The supersaturation is not a
controlled variable at this stage because due to the current conditions in the crystallizer, the
crystallization rate is high and it prevents the supersaturation of going out of the metastable
zone. The stage is over when the stirrer power reaches the maximum value of 50 A. The
steam valve is closed, the water pump of the barometric condenser and the stirrer are turned
off. Now the suspension is ready to be unloaded and centrifuged.
4. Model based predictive control
The term model-based predictive control (MPC) does not refer to a particular control method,
instead it corresponds to a general control approach (Rossiter, 2003). The MPC concept,
introduced in late seventies, nowadays has evolved to a mature level and became an attractive
control strategy implemented in a variety of process industries (Camacho & Bordons, 2004).
The main difference between the MPC configurations is the model used to predict the future
behavior of the process or the implemented optimization procedure. First the MPC based on
linear models gained popularity (Morari, 1994) as an industrial alternative to the classical
proportional-integral-derivative (PID) control and later on nonlinear cases as reactive
distillation columns (Balasubramhanya & Doyle, 2000) and polymerization reactors (Seki et al.,
2001) were reported as successfully MPC controlled processes.
4.1 Classical model based predictive control
The main difference between MPC configurations is the model used to predict the future
behaviour of the process and the optimization procedure. Nonlinear model predictive
control (NMPC) is an optimisation-based multivariable constrained control technique that
uses a nonlinear dynamic model for the prediction of the process outputs (Qin & Badgwell,
2003). At each sampling time k the model predicts future process responses to potential
control signals over the prediction horizon (H
p
). The predictions are supplied to an
optimization procedure, to determine the values of the control action over a specified
control horizon (H
c
) that minimizes the following performance index:
[]
()
()
min max
2
2
12
( ), ( 1), ( )
11
ˆ
min ( ) ( ) ( 1) ( 2)
p
c
cc cc
H
H
rcc
uukuk uHu
kk
Jykyk ukuk
λλ
≤+ ≤
==
=−−−−−
(1)
Model Predictive Control Strategies for Batch Sugar Crystallization Process
231
Subject to the following constrains
min maxc
uuu≤≤ (2)
min max
uuuΔ≤Δ≤Δ (3)
min maxp
yyy≤≤ (4)
Where
min
u and
max
u are the limits of the control inputs,
min
uΔ and
max
uΔ are the
minimum and the maximum values of the rate-of-change of the inputs and
min
y and
max
y
are the minimum and maximum values of the process outputs.
H
p
is the number of time steps over which the prediction errors are minimized and the
control horizon
H
c
is the number of time steps over which the control increments are
minimized,
r
y is the desired response (the reference) and
ˆ
y
is the predicted process output
(Diehl et al., 2002).
(), ( 1), ( )
cc cc
ukuk uH+ are tentative future values of the control input,
which are parameterized as peace wise constant. The length of the prediction horizon is
crucial for achieving tracking and stability. For small values of H
p
the tracking deteriorates
but for high H
p
values the bang-bang behavior of the process input may be a real problem.
The MPC controller requires a significant amount of on-line computation, since the
optimization (1) is performed at each sample time to compute the optimal control input. At
each step only the first control action is implemented to the process, the prediction horizon
is shifted or shrunk by usually one sampling time into the future, and the previous steps are
repeated (Rossiter, 2003).
1
λ
and
2
λ
are the output and the input weights respectively,
which determine the contribution of each of the components of the performance index (1).
4.2 Neural network model predictive control
The need for neural networks arises when dealing with non-linear systems for which the
linear controllers and models do not satisfy. Two main achievements contributed to the
increasing popularity of the NNs: (i) The proof of their universal approximation properties
and the development of suitable algorithms for NN training as the backpropagation and (ii)
The adaptation of the Levenberg-Marquard algorithm for NN optimization.
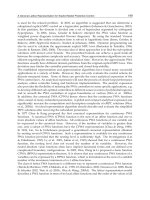
The most used NN structures are Feedforward networks (FFNN) and Recurrent (RNN)
ones. The RNNs offer a better suited tool for nonlinear system modelling and is
implemented in this work (Fig.2). The Levenberg-Marquard (LM) algorithm was preferred
as the training method due to its advantages in terms of execution time and robustness.
Since the LM algorithm requires a lot of memory, a powerful (in terms of memory)
computer is the main condition for successful training. In order to solve the problem of
several local minima, that is typical for all derivative based optimization algorithms
(including the LM method), we have repeated several time the optimization specifying
different starting points.
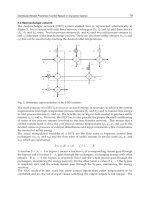
The individual stages of the crystallization process are approximated by different RNNs of
the type shown in Fig. 2. Tangent sigmoid hyperbolic activation functions are the hidden
computational nodes (Layer 1) and a linear function is located at the output (Layer 2). Each
NN has two vector inputs (r and p) formed by past values of the process input and the NN
output respectively. The architecture of the NN models trained to represent different
process stages is summarized as follows:
Advanced Model Predictive Control
232
Fig. 2. Neural network architecture
[
]
[
]
, ( 1), ( 2), ( 1), ( 2)
NN c c NN NN
urpukukykyk==− − − − (5)
11 12 1
xWrWpb=++ (6)
()()
1
/
xx xx
nee ee
−−
=− +
(7)
22112
nwnb=+ (8)
Where
2
11
m
WR
×
∈ ,
2
12
m
WR
×
∈ ,
1
21
m
wR
×
∈ ,
1
1
m
bR
×
∈ ,
2
bR∈ are the network weights (in
matrix form) to be adjusted during the NN training, m is the number of nodes in the hidden
layer.
Since the objective is to study the influence of the NNs on the controller performance, a
number of NN models is considered based on different training data sheets.
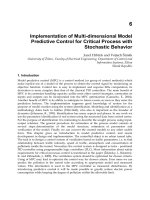
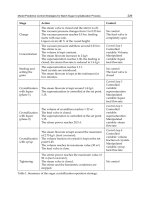
• Case 1 (Generated data): Randomly generated bounded inputs (
i
u ) are introduced to a
simulator of a general evaporative sugar crystallization process introduced in
Georgieva et al., 2003. It is a system of nonlinear differential equations for the mass and
energy balances with the operation parameters computed based on empirical relations
(for no stationary parameters) or keeping constant values (for stationary parameters).
The simulator responses are recorded (
i
y
) and the respective mean values are
computed (
i,mean
u ,
i,mean
y ). Then the NN is trained supplying as inputs
ii,mean
uu− and
as target outputs
ii,mean
yy− .
• Case 2: Industrial data: The NN is trained with real industrial data. In order to extract
the underlying nonlinear process dynamics a prepossessing of the initial industrial data
was performed. From the complete time series corresponding to the input signal of one
stage only the portion that really excites the process output of the same stage is
extracted. Hence, long periods of constant (steady-state) behavior are discarded. Since,
the steady-state periods for normal operation are usually preceded by transient
intervals, the data base constructed consists (in average) of 60-70% of transient period
data. A number of sub cases are considered.
• Case 2.1:
Industrial data of two batches is used for NN training.
• Case 2.2: Industrial data of four batches is used for NN training.
• Case 2.3: Industrial data of six batches is used for NN training.
Model Predictive Control Strategies for Batch Sugar Crystallization Process
233
Fig. 3. Case1: NN data generation
4.3 Selection of MPC parameters: H
p
, H
c
,
λ
2
The choice of
p
H
is related with the sampling period ( t
Δ ) of the digital control
implementation, which in its turn is a function of the settling time t
s
(the time before
entering into the 5% around the set-point) of the closed loop system. As a rule of thumb, it is
suggested t
Δ to be chosen at least 10 times smaller than t
s
, (Soeterboek, 1992). Hence, the
prediction horizon can be chosen as
p
H
= round-to-integer(t
s
/ tΔ ). It is well known that the
smaller the sampling time, the better can a reference trajectory be tracked or a disturbance
rejected. However, choosing a small sampling time yields a large prediction horizon. In
order to compute the optimal control input, the optimization (1) is performed at each
sampling time, therefore MPC controller requires a significant amount of on-line
computation. This can cause problems related with large amount of computer memory
required and additional numerical problems due to the large prediction horizon. The
introduction of the ET MPC as in (7) serves as a compromise between these conflicting
issues and reduces significantly the computational efforts.
Parameters
1
λ
and
2
λ
determine the contribution (the weight) of each term of the
performance index, the output error (e) and the control increments ( u
Δ ). In this work the
parameter
1
λ
is set to the normalized value of 1, while the choice of
2
λ
is based on the
following empirical expression:
()
2
max min 2 max
100uu eP
λ
−⋅=⋅
(9)
where P defines the desired contribution of the second term in (1) (0% ≤ P ≤100%) and
()()
(
)
22
max max min
max ,e ref y ref y=− −
(10)
The intuition behind (9-10) is to make the two terms of (1) compatible when they are not
normalized and to overcome the problem of different numerical ranges for the two terms.
Table 2 summarize the set of MPC parameters used in the four control loops define in the
section 3.
Advanced Model Predictive Control
234
Control
loop (CL)
t
s
(s)
settling
time
tΔ (s)
sampling
period
H
p
prediction
horizon
H
c
control
horizon
2
λ
weight
Controlled
variable
Set-point
CL1
40 4 10 2 1000 Volume 12.15
CL2 40 4 10 2 0.1 Supersaturation 1.15
CL3 60 4 15 2 0.01 Supersaturation 1.15
CL4 80 4 20 2 10000
Fraction
of crystals
0.43
Table 2. MPC design parameters for the control loops define in Table 1
5. PID controllers
The PID parameters were tuned, where
p
k ,
i
τ
,
d
τ
are related with the general PID
terminology as follows (Aström & Hägglund, 1995):
()
0
() () () ()( 1)
k
d
p
i
i
t
ut k K et k et i et k et k
t
τ
τ
=
Δ
+= ++ ⋅ ++ ⋅ +− +−
Δ
(11)
Since the process is nonlinear, classical (linear) tuning procedures were substituted by a
numerical optimization of the integral (or sum in the discrete version) of the absolute error
(IAE):
1
()()
N
p
k
IAE ref t k y t k
=
=+−+
(12)
Equation (12) was minimized in a closed loop framework between the discrete process
model and the PID controller. For each parameter an interval of possible values was defined
based on empirical knowledge and the process operator expertise. A number of gradient
(Newton-like) optimization methods were employed to compute the final values of each
controllers summarized in Table 1. All methods concluded that the derivative part of the
controller is not necessary. Hence, PI controllers were analyzed in the next tests.
Control loop 1 Control loop 2 Control loop 3 Control loop 4
p
k
0.05 -0.5 20 -0.01
i
τ
30 40 10 70
d
τ
0 0 0 0
Table 3. Optimized PID parameters for the control loops define in Table 1
6. Discussion of results
The operation strategy, summarized in Table 1 and implemented by a sequence of Classical-
MPC, NNMPC or PI controllers is comparatively tested in Matlab environment. The output
predictions are provided either by a simplified discrete model (with the main operation
parameters kept constant) or by a trained ANN model (5-8). A process simulator was
developed based on a detailed phenomenological model (Georgieva et al., 2003). Realistic
Model Predictive Control Strategies for Batch Sugar Crystallization Process
235
disturbances and noise are introduced substituting the analytical expressions for the
vacuum pressure, brix and temperature of the feed flow, pressure and temperature of the
steam with original industrial data (without any preprocessing(Scenario-2)). The test is
implemented for two different scenarios of work.
• Scenario - 1: The simulation uses, like process, the set of equations differentials
proposed in (Georgieva et al. 2003) with empirical operation parameters.
• Scenario - 2: The simulation uses, like process, the set of equations differentials
proposed in (Georgieva et al. 2003), but are used like operation parameter e real
industrial data batch not used in neural network training.
Time trajectories of the controlled and the manipulated variables for the control loop 1, 2
and 4 of one batch (Batch 1) are depicted in Figs. 4-6. The three controllers guarantee good
set point tracking. However, the quality of the produced sugar is evaluated only at the
process end by the crystal size distribution (CSD) parameters, namely AM and CV. The
results are summarized in Table 4 and both classical and NNPMC outperform the PI. Our
general conclusion is that the main benefits of the MPC strategy are with respect to the batch
end point performance.
Fig. 4. Controlled (Volume of massecuite) and control variables (F
f
- feed flowrate) over time
for the 1
st
control loop.
Advanced Model Predictive Control
236
Fig. 5. Controlled (Supersaturation) and control variables (F
f
- feed flowrate) over time for
the 2
nd
control loop.
Fig. 6. Controlled (Volume fraction of crystals) and control variables (F
f
- feed flowrate) over
time for the 4
th
control loop.
Model Predictive Control Strategies for Batch Sugar Crystallization Process
237
Performance measures Classical MPC NN-MPC PI
AM (mm) (reference 0.56) 0.586 0.584 0.590
CV (%) 32.17 31.13 32.96
Table 4-1. Batch end point performance measures (Batch - 1)
Performance measures
Classical
MPC
NN-
MPC
PI
AM (mm) (reference 0.56) 0.615 0.609 0.613
CV (%) 29.39 30.28 31.14
Table 4-2. Batch end point performance measures (Batch - 2)
Performance measures
Classical
MPC
NN-
MPC
PI
AM (mm) (reference 0.56) 0.636 0.631 0.639
CV (%) 28.74 29.42 29.23
Table 4-3. Batch end point performance measures (Batch - 3)
7. Conclusion
With the results obtained in this work it has been demonstrated that algorithm NNMPC is a
viable solution to control nonlinear complexes processes, still in the case that only exists
input-output information of the process.
An aspect very important to obtain successful results with NNMPC is the representative
quality of the available data, which was demonstrated with the results obtained in the third
control loop analyzed.
The weighting factor
2
λ
has a crucial paper in the good NNMPC performance. A constrain
very hard can impose that the control signal can not follow the dynamics of the process, but a
very soft constrain can cause instability in the control signal, when the model is not precise.
8. Acknowledgment
Several institutions contributed for this study: 1) Foundation of Science and Technology of
Portugal, which financed the scholarship of investigation of doctorate SFR/16175/2004; 2)
Laboratory for Process, Environmental and Energy Engineering (LEPAE), Department of
Chemical Engineering, University of Porto; 3) The Institute of Electronic Engineering and
Telematics of Aveiro (IEETA); 4) Sugar refinery RAR, Portugal; The authors are thankful to
all of them.
9. Appendix A. Crystallization model
Sugar crystallization occurs through the mechanisms of nucleation, growth and
agglomeration. The general phenomenological model of the fed-batch crystallization process
Advanced Model Predictive Control
238
consists of mass, energy and population balances, including the relevant kinetic rates for
nucleation, linear growth and agglomeration [Ilchmann, et al., 1994]. While the mass and
energy balances are common expressions in many chemical process models, the population
balance is related with the crystallization phenomenon, which is still an open modeling
problem.
Mass balance
The mass of all participating solid and dissolved substances are included in a set of
conservation mass balance equations:
110 0
( ( ), ( ), ( )), , (0)
f
Mf
Mt Ft S t t t t M M=≤≤=
(A-1)
where ( )
q
Mt∈ℜ and ( )
m
Ft∈ℜ are the mass and the flow rate vectors, with q and m
dimensions respectively, and
f
t is the final batch time.
1
1
()
r
St∈ℜ is the vector of physical
time dependent parameters as density, viscosity, purity, etc. For the process in hand, the
detailed form of the macro-model (A1) is as follows
sol a i w
M
MMM=++ (A-2)
msolc
MM M=+
(A-3)
1
dM
w
F ρ BFρ J
ff f
ww va
p
dt
=−+−
(A-4)
()
1
i
fff f
dM
FB Pur
dt
ρ
=⋅⋅⋅−
(A-5)
a
fff f
cris
dM
FBPurJ
dt
ρ
=⋅⋅⋅ −
(A-6)
c
cris
dM
J
dt
=
(A-7)
csol
m
sol
MM
V
ρ
+
=
(A-8)
()
()vap vap m w vac
vap
WQ
J K T T BPE
λ
+
=+⋅−−
(A-9)
Energy balance
The general energy balance model is
m
cris f vap
dT
aJ bF cJ d
dt
=+++
(A-10)
Model Predictive Control Strategies for Batch Sugar Crystallization Process
239
where parameters a, b, c and d incorporate the enthalpy terms and specific heat capacities
derived as time dependent functions of physical and thermodynamic properties as
follows
1
(1 )
sol sol sol
sol c sol
sol sol sol
sol sol c c
dH Pur dH
HH B
dB B dPur
a
MCp MCp
−
−+− + ⋅
=
⋅+⋅
(A-11)
()
()
ff sol
sol sol
ff sol fsol
sol sol sol
sol sol c c
BPur Pur
dH dH
HH BB
dB B dPur
b
MCp MCp
ρ
−
−+− + ⋅
=
⋅+⋅
(A-12)
sol
sol vap sol
sol
sol sol c c
dH
HH B
dB
c
M
Cp M Cp
−−⋅
=
⋅+⋅
(A-13)
()
sol
ww w sol sol
sol
sol sol c c
dH
WQF H H B
dB
d
MCp MCp
ρ
++ − +
=
⋅+⋅
(A-14)
2
29.7 4.6 0.075
sol
msolmm
sol
dH
TPurT T
dB
=− + +
(A-15)
4.61
sol
sol m
sol
dH
Bx T
dPur
=
(A-16)
Population balance
Mathematical representation of the crystallization rate can be achieved through basic mass
transfer considerations or by writing a population balance represented by its moment
equations. Employing a population balance is generally preferred since it allows to take into
account initial experimental distributions and, most significantly, to consider complex
mechanisms such as those of size dispersion and/or particle agglomeration/aggregation.
The basic moments of the number-volume distribution function are
2
0
00
1
'
2
d
B
dt
μ
βμ
=−⋅⋅
(A-17)
1
0
v
d
G
dt
μ
μ
=⋅
(A3-18)
2
2
11
2'
v
d
G
dt
μ
μβμ
=⋅ ⋅ + ⋅
(A3-19)
Advanced Model Predictive Control
240
2
3
22
33'
v
d
G
dt
μ
μβμ
=⋅ ⋅ +⋅ ⋅
(A3-20)
1
cris c
d
J
dt
μ
ρ
=⋅
, (A3-21)
where
0
B
, G and
'
β
are the kinetic variables nucleation rate, linear growth rate and the
agglomeration kernel, respectively with the following mathematical descriptions
0.53
12 0.51
1
0
2.894 10
nm
vm
BK G V
kV
μ
=⋅ ⋅ ⋅ ⋅
⋅
(A-22)
1
2
'
ag
m
KG
V
μ
β
⋅⋅
=
(A3-23)
()
()
()
()
57000
exp 1 exp 13.863 1 1 2
273
gsol
mm
v
GK S P
RT V
=⋅ − ⋅−⋅ − − ⋅+⋅
+
(A-24)
2/3
0
3
vv
v
Gk G
μ
=⋅ ⋅
. (A-25)
The crystallization quality is evaluated by the particle size distribution (PSD) at the end of
the process which is quantified by two parameters - the final average (in mass) particle size
(AM) and the final coefficient of particle variation (CV) with the following definitions:
AM L= (A-26)
CV
L
σ
=
(A-28)
Where
σ
and L are computed from:
1/3
3
2
13
L
L
η
σ
=
+⋅
(A-29)
()()
642
22 2 2
3363636
15 45 9 15 6 0
LLL
σσσ
ηηηηηηη
⋅ ⋅ + ⋅ −⋅ + ⋅ −⋅ + − =
(A-30)
In (A-29, A-30),
j
η
represent moments of mass-size distribution functions, that are related to
the moments of the number-volume distribution functions (
j
μ
by the following
relationships:
Model Predictive Control Strategies for Batch Sugar Crystallization Process
241
2
3
1
v
k
μ
η
μ
=
⋅
, (A-31)
and
3
6
2
1v
k
μ
η
μ
=
⋅
(A3-32)
Correlations for physical properties
ss s
QFH
α
=⋅⋅Δ
(A-33)
()
200
20
1000 1 0.036
54 160
ff
f
f
f
Bx Bx
T
T
ρ
⋅+
−
=+ ⋅−⋅
−
(A-34)
4186.8 29.7 4.61 0.075
ffffff
C
p
Bx Bx Pur Bx T=−⋅+⋅⋅+⋅⋅
(A-35)
fff
HC
p
T=⋅
(A-36)
()
*
200
20
1000 1 0.036
54 160
sol sol
m
sol
m
Bx Bx
T
T
ρ
⋅+
−
=+ ⋅−⋅
−
(A-37)
()
()
(
)
*624
1000 1 exp 6.927 10 1.164 10 1
sol sol sol sol sol
Bx Bx Pur
ρρ
−−
=+⋅−+ −⋅⋅ − ⋅⋅ ⋅ −
(A-38)
4186.8 29.7 4.61 0.075
sol sol sol sol sol m
Cp Bx Bx Pur Bx T=−⋅+⋅⋅+⋅⋅
(A-39)
sol sol m
HCpT=⋅
(A-40)
()
sol c
m
cccsol
w
ρρ
ρ
ρρρ
⋅
=
−⋅ −
(A-41)
a
sol
ai
M
Pur
M
M
=
+
(A-42)
ai
sol
sol
M
M
B
M
+
=
(A-43)
100
sol sol
Bx B=⋅
(A-44)
2326384
64.447 8.222 10 1.66169 10 1.558 10 4.63 10
sat m m m m
Bx T T T T
−−−−
=+⋅⋅+ ⋅⋅−⋅⋅−⋅⋅ (A-45)
Advanced Model Predictive Control
242
() ()
()
()
2
*
1.129 0.284 1 2.333 0.0709 60 1
sol m sol
SPurTPur=−⋅− + − ⋅−⋅−
(A-46)
100
100
sol
sol
sat
sat
sat
Bx
Bx
S
Bx
C
Bx
−
=
⋅
−
(A-47)
() ()
0.1 1 0.4 0.6 exp 0.24 1
100 100
sol sol
sat sol sol
sol sol
Bx Bx
CPur Pur
Bx Bx
=⋅ ⋅− ++⋅ − ⋅ ⋅−
−−
(A-48)
c
c
M
v
ρ
=
(A-49)
c
c
csol
M
w
MM
=
+
(A-50)
1163.2 3.488
cm
Cp T=+⋅
(A-51)
ccw
HCpT=⋅
(A-52)
1016.7 0.57
ww
T
ρ
=−⋅
(A-53)
()()
0.413
()
122.551 exp 0.246
wvac vac vac
TPP=⋅−⋅⋅
(A-54)
()
()
0.288
2
()
100.884 exp 1.203 10
ws s s
TPP
−
=⋅−⋅⋅⋅
(A-55)
()
()
2263.28 58.21 ln
wvac vac
P
λ
=−⋅
(A-56)
()
2257.51 85.95 ln
ss
P
λ
=−⋅ (A-57)
2
2323.3 4106.7
www
HTT=+⋅+ (A-58)
2
() () ()
2323.3 4106.7
ws ws ws
HTT=+⋅+
(A-59)
()
2491860 13270 1946.5 37.9
ssss
HPPT=−⋅++⋅⋅
(A-60)
()
2499980 24186 1891.1 106.1
vac vac vac m
HPPT=−⋅++⋅⋅ (A-61)
()ssws
HHHΔ= + (A-62)
Model Predictive Control Strategies for Batch Sugar Crystallization Process
243
()
()
()
0.03 0.018 84
100
sol
sol w vac
sol
Bx
BPE Pur T
Bx
=−⋅ ⋅ +⋅
−
(A-63)
For more detailed presentation of the process model, refer to [Georgieva et al., 2003].
10. References
Allgöwer, F., Findeisen, R. & Nagy, Z. K. (2004). Nonlinear model predicitve control: From
theory to application. Journal of Chinese Institute of Chemical Engineers, 35 (3),
299-315.
Aström, K. J., Hägglund, T. (1995). Pid controllers : theory, design, and tuning. North
Carolina: Research Triangle Park, Instrument Society of America.
Balasubramhanya, L. S., Doyle, F. J. (2000). Nonlinear model-based control of a batch
reactive distillation column. Journal of Process Control, 10, 209-218.
Bemporad, A., Morari, M. & Ricker, N. L. (2005). User's Guide: Model predictive control
toolbox for use with MatLab: The MathWorks Inc.
Camacho, E. F., Bordons, C. (2004). Model predictive control in the process industry.
London: Springer-Verlag.
Chorão, J. M. N. 1995. Operação assistida por comutador dum cristalizador industrial de
açúcar, Ph. D. Tesis, Faculdade de Engenharia, Departamento de Eng. Química,
Universidade de Porto, Porto
Diehl, M., H. G. Booc, J. P. Schlder, R. Findeisen, A. Nagy, and F. Allgöwer. (2002). Real-time
optimization and nonlinear model predictive control of processes governed by
deferential algebraic equations.
Jornal of Process Control 12:577–585.
Feyo de Azevedo, S., and M. J. Gonçalves. (1988). Dynamic Modelling of a Batch
Evaporative Crystallizer. Recent Progrés en Génie de Procedés, Lavoisier, Paris: Ed.
S. Domenech, X. Joulia, B. Koehnet, 199-204.
Georgieva, P., Meireles, M. J. & Feyo de Azevedo, S. (2003). Knowledge Based Hybrid
Modeling of a Batch Crystallization When Accounting for Nucleation, Growth and
Agglomeration Phenomena. Chemical Engineering Science, 58, 3699-3707.
Jancic, S. J., and P. A. M. Grootscholten. (1984).
Industrial Crystallization. Delft, Holland: Delft
University Press.
Morari, M. (1994).
Advances in Model-Based Predictive Control. Oxford: Oxford University
Press.
Qin, S. J., and T. A. Badgwell. (2003). A survey of model predictive control technology.
Control Engineering Practice
11 (7):733-764.
Rawlings, J. (2000). Tutorial Overview of Model Predictive Control.
IEEE Control Systems
Magazine
:38-52.
Rossiter, J. A. (2003). Model based predictive control. A practical approach. New York: CRC
Press.
Seki, H., Ogawa, M., Ooyama, S., Akamatsu, K., Ohshima, M. & Yang, W. (2001). Industrial
application of a nonlinear model predictive control to polymerization reactors.
Control Engineering Practice, 9, 819-828.
Advanced Model Predictive Control
244
Simoglou, A., Georgieva, P., Martin, E. B., Morris, J. & Feyo de Azevedo, S. (2005). On-line
Monitoring of a Sugar Crystallization Process. Computers & Chemical Engineering,
29 (6), 1411-1422.
Soeterboek, R. (1992). Predictive control. A unified approach. New York: Prentice Hall
International.
12
Predictive Control for Active Model and its
Applications on Unmanned Helicopters
Dalei Song, Juntong Qi, Jianda Han and Guangjun Liu
Shenyang Institute of Automation Science, Chinese Academy of Sciences
China
1. Introduction
Unmanned helicopters are increasingly popular platforms for unmanned aerial vehicles
(UAVs). With the abilities such as hovering, taking off and landing vertically, unmanned
helicopters extend the potential applications of UAVs. However, due to the complex
mechanism and complicated aero-flow during flight, it is almost impossible to accurately
model the dynamics of an unmanned helicopter in full flight envelope, and the significant
model uncertainties associated with a nominal model may degrade the performance and
even stability of an onboard controller.
Due to the difficulty in obtaining a high fidelity full envelope model, the multi-mode
modeling technique has been proposed for rotor aircrafts, such as tilt-rotor aircraft XV-15
[1], helicopter BO-105 [2], UH-60 [3], R-50 [4] and X-Cell [5]. The mode-dependent model,
which is identified and simplified according to a specific flight mode, such as hovering,
cruising, taking off and landing, can be used for control design for the corresponding flight
mode. However, the mode-dependent control suffers from at least two problems: one is the
difficulty in accommodating the mode transition dynamics, and the other is the
compensation of the ‘model drift’ due to flight dynamics change within one particular
mode. Up to now, for the purpose of practical implementation, the mode transition problem
can be partially dealt with by limiting the mode switching conditions [6], e.g., mode change
is made through hovering mode.
Robust and adaptive control techniques [7-8], on the other hand, have been used to deal
with the ‘model-shift’ within a flight mode. However, such control schemes normally need
to know the boundary of internal and external uncertainties and relative noise distribution,
which are difficult to identify accurately for a helicopter in full flight envelope. Although
online identification technology can be used to obtain the real-time dynamics and
disturbance, it is a large burden for the flight computer to reconstruct the robust controllers
and reach the requested control period (>50Hz) for sampling and actuating due to the
complex calculation of the robust/adaptive optimization process [9-10] and the strict weight
limits of micro flight computers.
Besides the model uncertainties, another critical problem that limits the control performance of
a helicopter is the time delay between the actuator command and the generation of relative
aerodynamic force/torque [11], which will be called aerodynamics-delay/time-delay in the
following sections. Normally, this time delay may cause reduced feedback gain of a model-
based controller and result in poor robustness [12-13], i.e., sensitive to disturbances.
Advanced Model Predictive Control
246
In recent years, the encouraging achievement in sequential estimation makes it an important
direction for online modeling and model-reference control [14]. Among stochastic
estimations, the most popular one is the Kalman-type filters (KFs) [15, 16, and 17]. Although
widely used, the KFs suffer from sensitivity to bias and divergence in the estimates, relying
on assumptions on statistic distribution such as white noise and known mean or covariance
for optimal estimation. In many cases, it is more practical to assume that the noises or
uncertainties are unknown but bounded (UBB). In view of this, the set-membership filter
(SMF), which computes a compact feasible set in which the true state or parameter lies only
under the UBB noise assumption, provides an attractive alternative [18-19].
On the control issue, model predictive control (MPC) can compensate for the aerodynamics
delay and does not require a high accuracy reference nonlinear model [20]. Among these
methods, linear generalized predictive control (GPC) has become one of the most popular
MPC methods in industry and academia. However, the normal GPC is sensitive to process
noise and model errors [21], which are unknown but bounded for helicopters when sudden
‘mode change’ happen and model-drift in full flight envelope. This makes the prediction
biased, and results in the non-optimal process of controller solving.
In this paper, for realizing the coupling control of unmanned helicopters in full flight
envelope, an active modeling based controller is developed based on a modified generalized
predictive control and adaptive set-membership filter estimation (ASMF). The time varying
model error and its boundary are estimated by the adaptive set-member filter, which is first
proposed in [19]. Incremental prediction process and dimension reduction method is
embedded into traditional GPC, which can decreases the computation burden and maintain
prediction unbiased when ‘mode change’ happens. Based on this active estimation and the
modified GPC controller, a novel optimal strategy for on-line compensation of model error
is developed. Thus, aggressive flight can be achieved only based on the hovering model
with time-delay terms. Using the identified hovering dynamics model as nominal model for
controller, flight experiments have been conducted to test the performance of the proposed
controller in full flight envelope on our UAV platform, and experimental results have
demonstrated the effectiveness of the proposed method.
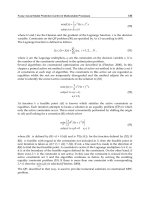
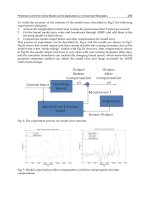
2. Active model based control scheme and reference model of a helicopter
Fig. 1 illustrates the active model based control scheme. The error between the reference
model and the actual dynamics of the controlled plant is estimated by an on-line modeling
strategy. The control, which is designed according to the reference model, should be able to
compensate the estimated model error and it in real time. In the followings of this paper, we
use the ASMF as the active modeling algorithm and the modified GPC as the control.
For normal missions of an unmanned helicopter, the flight modes include hovering (velocity
under 5m/s), cruising (velocity above 5m/s), taking off and landing (distance to the ground
is below 3m while significant ground effect exists) and the transitions among these modes.
A reference model is typically obtained by linearizing the nonlinear dynamics of a
helicopter at one flying mode. The model errors from linearization, external disturbance,
simplification, and un-modeled dynamics can be considered as additional process noise [22].
Thus, a linearized state-space model for helicopter dynamics in full flight envelope can be
formulated as
Predictive Control for Active Model and its Applications on Unmanned Helicopters
247
Fig. 1. The scheme of active model based control
00
(,, )
tttk
f
tt t
tt
X AX BU BfXXW
YCX
(1)
where
13
XR is the state, including 3-axis velocity, pitch and roll angle, 3-axis angle rate,
flapping angles of main rotor and stabilizer bar, and the feedback of yaw gyro.
8
t
YR is the
output, including 3-axis velocity, pitch and roll angle and 3-axis angle rate,
0
A
and
0
B
contain parameters that can be identified in different flight modes, and we use them to
describe the parameters in hovering mode.
4
UR is the control input vector.
13 8
CR
is
the output matrix, kR
is the time-delay for the driving system. The detail of building the
nominal model and physical meaning of parameters is explanted in Appendix A.
To describe the dynamics change, in equation (1), here, we introduce
13
(,, )
tt t
fXXW R
to
represent the time varying model error in full flight envelope, and
13
t
WR
is the process
noise.
The following two sections, based on model (1) will describe the way to estimate
(,, )
tt t
f
XXW
and to compensate for model errors from process noise, parameters change,
control delay and flight mode change in real applications.
3. ASMF based active model error estimation
As illustrated in Fig.1, adopting the active modeling process to get the model error f and
system state X is the basis for elimination of the model error. Controller can only work based
on nominal model and feedback of state and model error from active modeling process. In
this section, the active modeling process is built based on an adaptive set-membership filter
(ASMF) [19] since the UBB process noise.
First, we must obtain the reference equation for estimation. Compared with the sampling
frequency (often >50Hz for flight control) of the control system, the model error ( , , )
f
XXW
can be considered as a slow-varying vector, which means
Reference
Input
Controller
Reference
Model
Active
Modelin
g
Plant
Model Errors
Plant
Output
Advanced Model Predictive Control
248
1ttt
f
fh
where
t
f
is the sampling value of ( , , )
f
XXW
at sampling time t, and
t
h is the assumed
unknown but bounded (UBB) process noise.
Let the extended sampling state
T
aTT
ttt
XXf
Then, we can obtain the discrete equation from Eq. (1) as
1
aaaa a
tdtdtt
aa
tdtt
XAXBUW
YCX V
(2)
where
13 13 13 13
0
df
a
d
AB
A
I
,
13 4
0
d
a
d
B
B
,
813
0
a
dd
CC
,
T
aTT
ttt
WWh ,
13 13f
BI
and
t
f
is a 13 1 vector for model errors. Here, t is the sampling time,
mm
I
is the m×m unit
matrix and
0
mn
is the m×n zero matrix.
{,,}
ddd
A
BC
is the discrete expression of system
00
{,,}ABC. Here, time-delay k is ignored during the estimate process, and the compensation
method will be discussed in the next part on modified GPC.
The model error i.e., f in Eq. (1), comes from the linearization while neglecting the coupling
dynamics and uncertainties, and also the
0
A and
0
B because they are identified with
respect to a specific flight mode, here hovering mode is selected as nominal flight mode
since easy identification. Therefore, both the model error and the process noise
a
W are
vehicle dynamics and flight states dependent, and do the following assumption
Assumption:
a
W
does not necessarily have a normal distribution.
Thus, the Kalman type filter cannot be applied, and adaptive set-membership filter, which is
developed for UUB process noise and can get the uncertain boundaries of the states, is
considered to estimate the states and model errors here.
In this section we only present the result of ASMF and please refer to [19] for the details
about ASMF. With respect to Eq. (2), we can build the adaptive set-membership filter as Eq.
(3), where
a
Q and
a
R are the initial elliptical boundary of process and measurement noise
respectively,
m
r is the maximum eigenvalue of R,
m
p
is the maximum eigenvalue of
|1
aaT
dtt d
CP C
, Tr() is the trace of a matrix,
t
and
t
are the adaptive parameters of the filter.
We can also obtain the boundary of the ith element
ˆ
a
i
X of extended state
|
ˆ
a
tt
X as
ˆˆ
,
aa
iiiiii
XPXP
, where
ii
P
is the i-th diagonal element of matrix P.
Predictive Control for Active Model and its Applications on Unmanned Helicopters
249
|1
1
|1
1
|1 |1
||1 |1
|1 |1 |1
1
|
1|
1
1
ˆˆ
1( ) ( )
ˆˆ ˆ
()
()
11 1
ˆ
mt
t
mt mt
aaT
a
dtt d
t
tt
aT
tt d t
e
t
t
aa T aa
ttdttttdtt
aa e aa
tt tt t t d tt
tt tt tt
aT a
tt t d t d
tt t
aa
tt d
r
rp
CP C
R
W
PCW
K
YCX WYCX
XX KYCX
PP P
PCWC
XA
|
|
|
1|
ˆ
()
() ( )
1
aa
tt d t
a
t
aaaT
dtt d
aaT
a
dtt d
tt
tt
XBU
Tr Q
Tr Q Tr A P A
AP A
Q
P
(3)
4. Modified GPC for unmanned helicopters
To eliminate the negative influence of model errors and control delay in flight, besides the
active estimation algorithm like ASMF that does not require a normal distribution
assumption, an effective control algorithm has to be designed according to the reference
model of Eq. (1) while adopting the on-line estimation of f as compensation.
We describe the normal GPC in Section 4.1, and then, the modified scheme is proposed in
Section 4.2 & 4.3 to eliminate the negative influence of model errors in real applications.
4.1 Preliminary work for generalized predictive control
Generally, for a linear system with actuator time delay like,
1tdtdtkt
tdt
XAXBuW
yCX
(4)
where
1n
t
XR
is the system state vector at sampling time t,
1l
t
y
R
is the output vector,
1m
t
uR
is the control input vector, k is the actuators’ time-delay and
t
W is process noise;
traditional Generalized Predictive Control (GPC) [23] can be designed as:
Step I: Make prediction
Firstly, for the case that predictive step i is less than time-delay k (i.e., the time instant that
system behavior cannot be regulated through current and future control action), prediction
can be denoted as following equation,
Advanced Model Predictive Control
250
1
|1|1|
ˆˆ ˆ
tit d ti t dti k tit
XAX Bu X
(5)
where
ˆ
|
ti
Xt
is the prediction state at time t+i, the superscript 1 denotes that the part of
predicted variable that is independent of the current and future’s control actions.
Secondly, for the case that prediction step
i is larger than the time delay k,
|1|
1
1|
0
1
|
0
ˆˆ
ˆ
ˆ
,1
tkit d tki t dti
i
n
dtki t ddtn
n
i
n
dtkit ddtn
n
XAX Bu
AX ABu
AX ABu i
p
(6)
where p is the prediction range; similarly,
1
1|
ˆ
tki t
X
denotes the sub-variable of
1|
ˆ
tki t
X
that is independent of the current and future’s control actions.
Step II: Receding horizon optimization
After making prediction, the control vector can be obtained by minimize the following cost
function:
()()
xvTxvT
tt tt tt
JR X R X UU
(7)
And the optimal control inputs can be denoted as,
*11
00 0
()()
TTx
ttt
UGG GRX
(8)
where
0
G is the predictive matrix,
v
t
X is the predictive state vector,
1
t
X is the known vector
inside
v
t
X
,
is the weight of control input, and
x
t
R
is the reference of system states. The
detailed definition of these matrixes can be referenced in [23].
Step III: Control implementation
The first element of vector
*
t
U is used as the control to the real plant. After that, go back to
step I at the next time instant.
However, with application to the unmanned helicopters, this kind of GPC algorithm has the
following three disadvantages, which will be solved in the next two sections:
1.
It cannot reject the influence of working mode changes, i.e., if
000
000
(,)
(,)
tt
tt
Xxx xu
Uuu xu
(9)
where
00
(,)xu is the current operation point, which cannot be ensured on-line,
00
(,)xu
is
the valid range for model linearization and
t
x is the absolute state at time t,
t
u is the
absolute control input at time t. The biased prediction, due to the changing operation
point
00
(,)xu , will bring steady errors for velocity tracking.
Predictive Control for Active Model and its Applications on Unmanned Helicopters
251
2. Normal GPC is sensitive to mismatch of the nominal model, which means slow change
in parameters
(,)
dd
A
B may result in prediction error and unstable control.
3.
The transient model errors of the nominal model from external disturbance, estimated
by ASMF, cannot be eliminated. And this will also result in the non-minimum variance
and the instability of the closed control loop.
4.2 Stationary increment predictive control
To reject the influence of working mode change and sensitivity to nominal parameters
change in real application, i.e. the problem 1) and 2) in Section 4.1, we assume that the
process noise
t
W ’s increment in Eq. (4) is a stationary random process, which means
0
1
tttt
WWWW
(10)
is normal distribution. Where
1
1 q
is the difference operator;
1
q
is one-step delay
factor. Thus, Eq. (4) can be rewritten as follows,
0
1tdtdtkt
XAXBuW
(11)
Consider
010
010
()( )
()( )
tt t t
tt t t
Xxx x x x
Uuu u u u
if behavior prediction is made based on Eq. (11), only the absolute state
t
x
and control input
t
u , which can be measured or estimated directly from sensors, are used and the current
operation point
00
(,)xu disappears in prediction. Thus, the problem of biased prediction
due to changing of working point, i.e., problem 1), can be solved.
Otherwise, according to the process of traditional GPC, the set-point
x
t
R must be obtained
for every prediction step, and this is often set as current reference states. However, for
helicopter system, only measurable outputs are cared, such as position, velocity and etc; and
the internal states, such as rotor’s pitch angle and yaw gyro’s feedback and so on, are
coupled with the measurable states/outputs, and cannot be set independently. Others, this
reference input often comes from position track planning, which changes quickly for flight
and often cause a step-like signal for tracking. To avoid the step signal reference tracking,
which is dangerous for unmanned helicopter system, we use a low pass filter to calculate
the set-point inputs of the output in the future i-th step, i=1, …, p.
Let
1l
t
SP R
be the set-point input at time t, then we have
1
(),1
tki t tki t
rSPr SP ip
(12)
where is the cut-off frequency of the filter, the initial value
|
ˆ
tk tkt
ry
,
tki
r
is the i-th
set-point input, and
|
ˆ
tkt
y
is the estimate of output at time t+k.
Thus, the set-point problem is solved and the output prediction can be implanted based on
increment model (11) as follows:
Advanced Model Predictive Control
252
When the prediction step i is less than time-delay k,
1
|1| 1| 1|
ˆˆ ˆ ˆ
tit tit d tit d ti k tit
XX AX Bu X
(13)
When the prediction step is larger than time-delay k, let
111
|| 1|
ˆˆˆ
tit tit ti t
XXX
Then,
|1| 1|
11
1| 1|
11
00
11
1
|
00
ˆˆ ˆ
ˆˆ
{}
ˆ
{},1
tkit tki t d tki t d ti
tki t d tki t
iim
n
dd tm
mn
iim
n
tkit d d tm
mn
XX AX Bu
XAX
AB u
XABuip
(14)
Hence, the above problem 1), which comes from working mode change, is solved because
0
x
disappears in predictive equation (14).
We can obtain the following prediction matrix for the output, which is often cared in
helicopter tracking problem, from Eq. (12) and (13):
1| 2| |
11 1
1| 2| |
11
1
ˆ
ˆˆ ˆ
ˆˆ ˆ
T
ttkttkt tkpt
T
dtk t dtk t dtkpt
T
TT T
tt tp
t
Yy y y
CX CX CX
Gu u u
YGU
(15)
where
1
t
Y
is the known part of p steps’ prediction, which cannot be influenced by current
control input, and matrix G has the following form:
12
00
0 0
0
dd
dd d dd dd
pp
ii
ddd ddd dd
ii
CB
CB CAB CB
G
CAB CAB CB
(16)
Compared with the normal GPC, the prediction of SIPC has better characteristics that can be
described by the following theorem, which solves the above problem 2) in Section IV.A.
Theorem: for nominal model (11), when the nominal model parameters(,)
dd
AB change
into
(,)
dr dr
A
B .
Predictive Control for Active Model and its Applications on Unmanned Helicopters
253
1.
,0
M
NR
, let the matrix norms satisfy
,
dd
AMBM
,
dr dr
A
NB N
2.
Define
max
{}R is the operator for the maximum of eigenvalue of matrix ●.
Thus, if
max
max
{}0
{}0
dr
d
RA
RA
Then, the state prediction obtained by Eqs. (13-14) maintains unbiased, and the characteristic is
also guaranteed in traditional GPC conditions, i.e. Eq. (4), where
t
W is normal distribution.
Proof: See Appendix B.
In Eq. (14), U , including p control inputs, need to be optimized, while only the first one is
used for control. This will occupy a great deal of computation resource and result in very
low computational efficiency, especially with respect to the fast applications.
In order to reduce the computational burden of Eq. (14), we propose here a ‘step plan’
technique,
1ti ti
uu
(17)
where
is an mm
diagonal matrix presenting the length of one step, which will be a
parameter to be selected. Then, we can simplify Eq. (14) by only calculating the unknown
control, which has smaller dimensions.
1
1
1
2
ˆ
T
p
tt mm t
tt
YY GI u
YGu
(18)
where
mm
I
is an mm
unit matrix. Thus, the number of the unknown control input vector
(from current time t to the future time
t+p-1) is reduced from p to 1, and the dimension of
predictive matrix is changed from
p
lpm
to
p
lm
. This reduction brings low computer
memory consuming and simplifies the receding horizon optimization in the following
calculation.
To complete the horizon optimization and obtain the control input, the cost function of the
stationary increment predictive control is designed as:
ˆˆ
()()
TT
tt tt t t
JRYWRY u u
(19)
where
12
T
TT T
ttk tk tkp
Rr r r
,
l
p
l
p
WR
is the weight matrix for tracking error,
and
mm
R
is the weight matrix of the control increment.
In order to minimize the cost function of Eq. (19), we can calculate the control vector as
follows: