Biosensors for Health Environment and Biosecurity Part 8 pot
Bạn đang xem bản rút gọn của tài liệu. Xem và tải ngay bản đầy đủ của tài liệu tại đây (3.41 MB, 35 trang )
Biosensors for Health, Environment and Biosecurity
236
Damos, F.S., Mendes, R.K. & Kubota, L.T. (2004). Applications of QCM, EIS and SPR in the
Investigation of Surfaces and Interfaces for the Development of (Bio)Sensors,
Química Nova, Vol.27, No.6, (December 2004) p.p. 970-979, ISSN 1678-7064.
Esteban-Salan, M., Aguilar-Doreste, J.A., Arranz-Pena, M.L., Juve-Cuxart, S., Gich-Salarich,
I., Zapico-Muniz, E. & Ordonez-Llanos, J. (2008). Multicentric evaluation of the
homogeneous LDL-cholesterol Plus assay: comparison with beta-quantification and
Friedewald formula. Clinical Biochemistry, Vol.41, No.16-17, (August 2008), p.p.
1402-1409, ISSN: 0009-9120.
Faulin, T.E.S., Sena, K.C.M., Telles, A.E.R., Grosso, D.M., Faulin, E.J.B. & Abdalla, D.S.P.
(2008). Validation of a novel ELISA for measurement of Electronegative LDL.
Clinical Chemistry and Laboratory Medicine, Vol.46, No.12, (August 2008), p.p. 1769-
1775, ISSN: 1434-6621.
Fowler, J.M., Wong, D.K.Y., Halssal, H.B. & Heineman, W.R. (2008). Recent Developments
in Electrochemical Immunoassays and Immunosensors, In: Electrochemical Sensors,
Biosensors and their Biomedical Applications, Zhang, X., Ju, H. & Wang, J. (Eds.), 115-
140, Academic Press Elsevier Inc., ISBN 978-012-3737-38-0, United States of
America.
Freire, R.S., Thongngamdee, S., Duran, N., Wang, J. & Kubota, L.T. (2002). Mixed Enzyme
(Laccase/Tyrosinase)-based Remote Electrochemical Biosensor for Monitoring
Phenolic Compounds. Analyst, Vol.127, Issue2, p.p. 258–261, ISSN 0003-2654.
Friedewald, W.T., Levy, R.I. & Fredrickson, D.S. (1972). Estimation of the Concentration of
Low-Density Lipoprotein Cholesterol in Plasma, without use of the Preparative
Ultracentrifuge. Clinical Chemistry, Vol.18, (March 1972), p.p. 499–502, ISSN 1530-
8561.
Gaus, K. & Hall, E.A.H. (2003). Short Peptide Receptor Mimics for Atherosclerosis Risk
Assessment of LDL. Biosensors and Bioelectronics, Vol.18, (March 2003), p.p. 151-164,
ISSN 0956-5663.
Green, R.J., Frazier, R.A., Shakesheff, K.M., Davies, M.C., Roberts, C.J. & Tendler, S.J.B.
(2000). Surface Plasmon Resonance Analysis of Dynamic Biological Interactions
with Biomaterials. Biomaterials, Vol.21, Issue18, (September 2000) p.p. 1823-1835,
ISSN 0142-9612.
Hansson, G.K., & Libby, P. (2006). The immune response in atherosclerosis: a double-edged
sword. Nature Reviews Immunology, Vol.6, No.7, (July 2006), p.p. 508-519, ISSN:
1474-1733.
Miller, Y.I., Choi, S.H., Fang, L. & Tsimikas, S. (2010). Lipoprotein modification and
macrophage uptake: role of pathologic cholesterol transport in atherogenesis, In:
Cholesterol binding and cholesterol transport proteins. Structure and function in health and
disease, Harris, J.R., pp. 229-251, Springer, ISBN 978-90-481-8621-1, Dordrecht,
Heidelberg, London and New York.
Hedrick, C.C., Thorpe, S.R., Fu, M X., Harper, C.M., Yoo, J., Kim, S M., Wong, H. & Peters,
A.L. (2000). Glycation Impairs High-Density Lipoprotein Function. Diabetologia,
Vol.43, (March 2000), p.p. 312–320, ISSN 0012-186X.
Helali, S., Ben Fredj, H., Cherif, K., Abdelghani, A., Martelet, C. & Jaffrezic-Renault, N.
(2008). Surface Plasmon Resonance and Impedance Spectroscopy on Gold Electrode
for Biosensor Application. Materials Science and Engineering: C, Vol.28, Issue5-6,
(July 2008) p.p. 588-593, ISSN 0928-4931.
Biosensors for Detection of Low-Density Lipoprotein and its Modified Forms
237
Hodgkinson, C.P., Laxton, R.C., Patel, K. & Ye, S. (2008). Advanced glycation end-product of
low density lipoprotein activates the Toll-like 4 receptor pathway implications for
diabetic atherosclerosis. Arteriosclerosis, Thrombosis, and Vascular Biology, Vol.28,
No.12, (September 2008), p.p.2275–2281, ISSN: 1079-5642.
Homola, J., Yee, S.S. & Gauglitz, G. (1999). Surface Plasmon Resonance Sensors: Review.
Sensors and Actuators B, Vol.54, Issues1-2, (January 1999) p.p. 3–15, ISSN 0925-4005.
Höök, F. & Rudh, M. (2005). Quartz Crystal Microbalances (QCM) in Biomacromolecular
Recognition. Biotech International, Vol.2, (March 2005), p.p. 1-5, ISSN 2032-2887.
Ishigaki, T., Ohki, I., Utsunomiya-Tate, N. & Tate, S I. (2007). Chimeric Structural Stabilities
in the Coiled-Coil Structure of the NECK Domain in Human Lectin-Like Oxidized
Low-Density Lipoprotein Receptor 1 (LOX-1). The Journal of Biochemistry, Vol.141,
Issue6, (March 2007), p.p. 855-866, ISSN 0021-924X.
Itabe, H. & Ueda, M. (2007). Measurement of plasma oxidized low-density lipoprotein and
its clinical implications. Journal of atherosclerosis and thrombosis, Vol.14, No.1,
(February 2007), p.p. 1-11, ISSN: 1340-3478.
Jambunathan, K. & Hillier, A.C. (2003). Measuring Electrocatalytic Activity on a Local Scale
with Scanning Differential Electrochemical Mass Spectrometry. Journal of the
Electrochemical Society, Vol.150, No.6, (June 2003), E312-E320, ISSN 0013-4651.
Johnson, P.B. & Christy, R.W. (1972). Optical Constants of the Noble Metals, Physical Review
B, Vol.6, Issue12, (December 1972) p.p. 4370-4379, ISSN 1098-0121.
Kanazawa, K.K. & Gordon II, J.G. (1985). Frequency of a Quartz Microbalance in Contact
with Liquid. Analytical Chemistry, Vol.57, Issue8, (July 1985), p.p. 1770-1771, ISSN
1177-3901.
Kretschmann, E. & Raether, H. (1968). Radiative Decay of Non-Radiative Surface Plasmons
Excited by Light. Zeitschrift für Naturforschung B, Vol.23A, p.p. 2135–2136, ISSN
0932-0776.
Kudo, Y., Fukuchi, Y., Kumagai, T., Ebina, K. & Yokota, K. (2001). Oxidized Low-Density
Lipoprotein-Binding Specificity of Asp-hemolysin from Aspergillus fumigates.
Biochimica et Biophysica Acta, Vol.1568, (December 2001), p.p. 183-188, ISSN 0304-
4165.
Laffont, I., Shuvaev, V.V., Briand, O., Lestavel, S., Barbier, A., Taniguchi, N., Fruchart, J C.,
Clavey, V. & Siest, G. (2002). Early-Glycation of Apolipoprotein E: Effect on its
Binding to LDL Receptor, Scavenger Receptor A and Heparan Sulfates. Biochimica et
Biophysica Acta, Vol.1583, (June 2002) p.p. 99– 107, ISSN 0304-4165.
Levitan, I., Volkov, S. & Subbaiah, P.V. (2010). Oxidized LDL: Diversity, Patterns of
Recognition, and Pathophysiology. Antioxidants & Redox Signaling, Vol.13, No.1,
(July 2010), p.p. 39-75, ISSN: 1523-0864.
Libby, P., Ridker, P.M., & Hansson, G.K. (2009). Leducq Transatlantic Network on
Atherothrombosis. Inflammation in atherosclerosis: from pathophysiology to
practice. Journal of the American College of Cardiology, Vol.54, No.23, (December
2009), p.p. 2129-2138, ISSN: 0735-1097.
Liu, D., He, B., Han, S., Wang, S., Liu, Q., Jun-ichic, A., Osa, T. & Chen, Q. (2007). An
Adsorption Behavior of low-Density Lipoprotein onto Cholesterol-Modified
Dextran Studied by a Quartz Crystal Microbalance. Materials Science and
Engineering: C, Vol.27, Issue4, (May 2007), p.p. 665-669, ISSN 0928-4931.
Biosensors for Health, Environment and Biosecurity
238
Lundstrom I. (1994). Real-Time Biospecific Interaction Analysis. Biosensors and Bioelectronics,
Vol.9, Issues9-10, (January 2002), pp. 725-736, ISSN 0956-5663.
Luppa, P.B., Sokoll, L.J. & Chan, D.W. (2001). Immunosensor principles and applications to
clinical chemistry. Clinica Chimica Acta, Vol.314, Issue1-2, (December 2001), p.p. 1-
26.
Macdonald, J.R. (1987). Impedance spectroscopy: emphasizing solid materials and systems, John
Wiley and Sons, Inc., ISBN 978-047-1831-22-8, New York, United States of America.
Malhotra, B.D., Chaubey, A. & Singh, S.P. (2006). Prospects of Conducting Polymers in
Biosensors. Analytica Chimica Acta, 2006, Vol.578, Issue1, (September 2006), p.p. 59–
74, ISSN 0003-2670.
Malle, E., Marsche, G., Arnhold, J. & Davies, M.J. (2006). Modification of low-density
lipoprotein by myeloperoxidase-derived oxidants and reagent hypochlorous acid.
Biochimica et Biophysica Acta, Vol.1761, No.4, (April 2006), p.p. 392–415, ISSN: 0304-
4165.
Mamo, J.C.L., Szeto, L. & Steiner, G. (1990). Glycation of Very Low Density Lipoprotein
from Rat Plasma Impairs its Catabolism. Diabetologia, Vol.33, No.6, (June 1990), p.p.
339–345, ISSN 0012-186X.
Marshall, W.J. & Bangert, S.K. (2008). Clinical chemistry, Mosby Elsevier, ISBN
9780723434559, Philadelphia.
Marx, K.A. (2003). Quartz Crystal Microbalance: A Useful Tool for Studying Thin Polymer
Films and Complex Biomolecular Systems at the Solution-Surface Interface.
Biomacromolecules, Vol.4, No.5, (October 2002), p.p. 1099-1120, ISSN 1525-7797.
Matharu, Z., Bandodkar, A.J., Sumana, G., Solanki, P.R., Ekanayake, E.M., Kaneto, K.,
Gupta, V. & Malhotra, B.D. (2009a) Low Density Lipoprotein Detection Based on
Antibody Immobilized Self-Assembled Monolayer: Investigations of Kinetic and
Thermodynamic Properties. The Journal of Physical Chemistry B, Vol.29, No.118,
Issue43, (October 2009), p.p. 14405-14412, ISSN 1089-5647.
Matharu, Z., Sumana, G., Gupta, V. & Malhotra, B.D. (2010). Langmuir–Blodgett films of
polyaniline for low density lipoprotein detection. Thin Solid Films, Vol.519 (August
2010) p.p. 1110–1114, ISSN 040-6090.
Matharu, Z., Sumana, G., Pandey, M.K., Gupta, V. & Malhotra, B.D. (2009b) Low Density
Lipoprotein Sensor Based on Surface Plasmon Resonance. Thin Solid Films, Vol.518,
Issue2, (November 2009) p.p. 719-723, ISSN 0040-6090.
Matsuura, E., Hughes, G.R. & Khamashta, M.A. (2008). Oxidation of LDL and its clinical
implication. Autoimmunity Reviews, Vol.7, No.7, (July 2008), p.p. 558–566, ISSN:
1568-9972.
McGill, H.C. Jr, McMahan, C.A., Herderick, E.E., Malcom, G.T., Tracy, R.E. & Strong, J.P.
(2000). Origin of atherosclerosis in childhood and adolescence. The American Journal
of Clinical Nutrition, Vol.72, No.5, (November 2000), p.p. 1307S-1315S, ISSN: 0002-
9165.
Novotny, L. & Hecht, B. (2006). Principles of Nano-Optics, Cambridge University Press, ISBN
978-052-1832-24-3, Cambridge, UK.
Ohki, I., Amida, H., Yamada, R., Sugihara, M., Ishigaki, T. & Tate, S I. (2011). Surface
Plasmon Resonance Study on Functional Significance of Clustered Organization of
Lectin-like Oxidized LDL Receptor (LOX-1). Biochimica et Biophysica Acta, in press,
ISSN 1570-9639.
Biosensors for Detection of Low-Density Lipoprotein and its Modified Forms
239
Oliveira, M.D.L., Correia, M.T.S. & Diniz, F.B. (2009). Concanavalin A and Polyvinyl Butyral
use as a Potential Dengue Electrochemical Biosensor. Biosensors and Bioelectronics,
Vol.25, Issue4, (December 2009), pp. 728-732, ISSN 0956-5663.
Oliveira, M.D.L., de Melo, C.P., Glaucius, O. & Andrade, C.A.S. (2011). Development of
Impedimetric and Optical Calcium Biosensor by Using Modified Gold Electrode
with Porcine S100A12 protein. Colloids and Surfaces B – Biointerfaces, Vol.82, Issue2,
(February 2011), p.p. 365-370, ISSN 0927-7765.
Otto, A. (1968). Excitation of Surface Plasma Waves in Silver by the Method of Frustrated
Total Reflection. Zeitschrift für Physik, Vol.216, p.p. 398–410, ISSN 0340-2347.
Prassl, R. & Laggner, P. (2009). Molecular structure of low density lipoprotein: current status
and future challenges. European Biophysical Journal, Vol.38, No.2, (September 2008),
p.p. 145-158, ISSN: 0175-7571.
Raether, H. (1988). Surface Plasmons on Smooth and Rough Surfaces and on Gratings, Springer-
Verlag, ISBN 978-038-7173-63-4, Berlin.
Rifai, N., Iannotti, E., DeAngelis, K. & Law, T. (1998). Analytical and clinical performance of
a homogeneous enzymatic LDL-cholesterol assay compared with the
ultracentrifugation-dextran sulfate-Mg2+ method. Clinical Chemistry, Jun;Vol.44,
No.6, p.p. 1242-1250, ISSN: 1530-8561.
Robbio, L.L., Uboldi, P., Marcovina, S., Revoltella, R.P. & Catapano, A.L. (2001). Epitope
Mapping Analysis of Apolipoprotein B-100 using a Surface Plasmon Resonance-
Based Biosensor. Biosensors and Bioelectronics, Vol.16 (February 2001), p.p. 963–969,
ISSN 0956-5663.
Sauerbrey, G. (1959). Verwendung von Schwingquarzen zur Wägung dünner Schichten und
zur Mikrowägung. Zeitschrift für Physik, Vol.155, Issue2, (April 1959), p.p. 206–222,
ISSN 0340-2347.
Sawamura, T., Kume, N., Aoyama, T., Moriwaki, H., Hoshikawa, H., Aiba, Y., Tanaka, T.,
Miwa, S., Katsura, Y., Kita, T. & Masaki, T. (1997). An Endothelial Receptor for
Oxidized Low-Density Lipoprotein. Nature, Vol.386, (March 1997), p.p. 73–77, ISSN
0028-0836.
Schumaker, V.N., Phillips, M.L. & Chatterton, J.E. (1994). Apolipoprotein B and Low-
Density Lipoprotein Structure: Implications for Biosynthesis of Triglyceride-Rich
Lipoproteins, In: Advances in Protein Chemistry, Anfinsen, C.B., Edsall, J.T., Richards,
F.M. & Eisenberg, D.S. (Eds.), 205-248, Calif. Academic Press, ISBN 978-012-0342-
47-1, San Diego.
Skålén, K., Gustafsson, M., Rydberg, E.K., Hultén, L.M., Wiklund, O., Innerarity, T.L. &
Borén, J. (2002). Subendothelial Retention of Atherogenic Lipoproteins in Early
Atherosclerosis. Nature, Vol.417, (June 2002), p.p. 750–754, ISSN 0028-0836.
Smith, A. (2008). The Quartz Crystal Microbalance, In: Handbook of Thermal Analysis and
Calorimetry, Brown, M. & Gallagher, P. (Eds.), 133-169, Vol.5, Elsevier B.V., ISBN
978-044-4531-23-0, Amsterdam.
Smith, E.A. & Corn, R.M. (2003). Surface Plasmon Resonance Imaging as a Tool to Monitor
Biomolecular Interactions in an Array Based Format, Applied Spectroscopy, Vol.57,
No.11, (November 2003), p.p. 320A-332A, ISSN 0003-7028.
Snellings, S., Fuller, J., Pitner, M. & David, P.W. (2003). An Acoustic Wave Biosensor for
Human Low-Density Lipoprotein Particles: Construction of Selective Coatings.
Biosensors for Health, Environment and Biosecurity
240
Biosensors and Bioelectronics, Vol.19, Issue4, (December 2003), p.p. 353-363, ISSN
0956-5663.
Srivastava, A.K. & Sakthivel, P. (2001). Quartz-Crystal Microbalance Study for
Characterizing Atomic Oxygen in Plasma Ash Tools. Journal of Vacuum Science &
Technology A, Vol.19, Issue1, (January 2001), p.p. 97-100 ISSN 1520-8567.
Stefan, R.I., van Staden, J.F. & Aboul-Enein, H.Y. (2000). Immunosensor in clinical analysis.
Fresenius Journal of Analytical Chemistry, 366 (December 1999) p.p. 659-668, ISSN
0937-0633.
Stocker, R. & Keaney, J.R. (2004). Role of oxidative modifications in atherosclerosis.
Physiological Reviews, Vol.84, No.4, (October 2004), p.p. 1381–1478, ISSN: 0031-9333.
Stura, E., Bruzzese, D., Valerio, F., Grasso, F., Perlo, P. & Nicolini, C. (2007). Anodic Porous
Alumina as Mechanical Stability Enhancer for LDL-Cholesterol Sensitive
Electrodes. Biosensors and Bioelectronics, Vol.23, (July 2007), p.p. 655–660, ISSN 0956-
5663.
Tan, X., Li, M., Cai, P., Luo, L. & Zou, X. (2005). An Amperometric Cholesterol Biosensor
Based on Multivalent Carbon Nanotubes and Organically Modified Sol-
Gel/Chitosan Hybrid Composite Film. Analytical Biochemistry, Vol.337, Issue1,
(February 2005), p.p. 111-120, ISSN 1096-0309.
Thevenot, D.R., Toth, K., Durst, R.A. & Wilson, G.S. (1999). Electrochemical Biosensors:
Recommended Definitions and Classification. Pure and Applied Chemistry, Vol.71,
No.12, (January 2001), p.p. 2333-2348, ISSN 1365-3075.
Tudos, A.J. & Schasfoort, R.B.M. (2008). Introduction to Surface Plasmon Resonance, In:
Handbook of Surface Plasmon Resonance, Tudos, A.J. & Schasfoort, R.B.M. (Eds.), 1-14,
RSC Publishing, ISBN 978-085-4042-67-8, Cambridge UK.
Viigimaa, M., Abina, J., Zemtsovskaya, G., Tikhaze A, Konovalova, G., Kumskova, E. &
Lankin, V. (2010). Malondialdehyde-modified low density lipoproteins as
biomarker for atherosclerosis. Blood Pressure, Vol.19, No.3, (June 2010), p.p. 164–168,
ISSN: 0803-7051.
Wood, R.W. (1902). On a Remarkable Case of Uneven Distribution of Light in a Diffraction
Grating Spectrum. Proceedings of the Physical Society of London, Vol.18, No.1, p.p. 269-
275, ISSN 0370-1328.
Yan, W., Chen, X., Li, X., Feng, X. & Zhu, J J. (2008). Fabrication of a Label-Free
Electrochemical Immunosensor of Low-Density Lipoprotein. The Journal of Physical
Chemistry B, Vol.112, No.4, (January 2008), p.p. 1275–1281, ISSN 1089-5647.
Yang, C.Y., Chen, S.H., Gianturco, S.H., Bradley, W.A., Sparrow, J.T., Tanimura, M., Li,
W.H., Sparrow, D.A., DeLoof, H., Rosseneu, M., Lee, F.S., Gu, Z.W., Gotto, A.M.Jr.
& Chan, L. (1986). Sequence, Structure, Receptor-Binding Domains and Internal
Repeats of Human Apolipoprotein B-100. Nature, Vol.323, (October 1986), p.p. 738-
742, ISSN 0028-0836.
Zhao, H. & Ju, H. (2006). Multilayer Membranes for Glucose Biosensing via Layer-by-Layer
Assembly of Multiwall Carbon Nanotubes and Glucose Oxidase. Analytical
Biochemistry, Vol.350, Issue1, (March 2006), p.p. 138–144, ISSN 1096-0309.
10
Multiplexing Capabilities of Biosensors for
Clinical Diagnostics
Johnson K-K Ng and Samuel S Chong
National University of Singapore
Singapore
1. Introduction
The detection of biomolecules, be it proteins or nucleic acids such as DNA or RNA, is a
critical process in biomedical research and clinical diagnostics. With the former, it helps us
to unravel the complexity of our human body, and provides important information down at
the cellular and sub-cellular level that allows us to better understand what our bodies are
comprised off, how they function, how they respond to disease and aging, or why they fail
to respond. This information, when applied to clinical diagnostics, help better manage our
health and enhance the quality of life.
To generate any meaningful or conclusive information for clinical diagnostics, it is often
needed to detect several targets simultaneously. Therefore technologies for performing
biomolecular detection must be able to interrogate several targets at one time i.e. perform
multiplexing. These targets can be proteins or nucleic acid targets from different cellular
species, such as for infectious disease diagnosis, or from the same species i.e. along the same
genome, such as single-nucleotide polymorphisms (SNPs) genotyping for
pharmacogenomics. It can also be for identifying aberrant biomolecules from normal ones,
such as mutation detection in cancer diagnostics and prognostics. Therefore having a
platform capable of performing multiplexed biological detection is an indispensable tool for
accurate clinical diagnostics.
Through advancement in molecular biology as well as in areas such as microelectronics,
microfabrication, material science, and optics, there have been a proliferation of
miniaturized platforms, or biosensors, for performing biological analysis based on a variety
of multiplexing technologies. These ranged from those capable of detecting a few targets to
those capable of interrogating hundreds or even thousands of targets. Here we attempt to
provide a concise overview of such technologies, as well as provide some insight into a
simple technology that we developed in-house. Due to the enormous amount of progress in
this area, this is by no means a comprehensive overview.
2. Review of current technologies
2.1 Solution-based
One of the most widely used technologies for multiplexed detection involves performing the
detection within a single homogeneous solution. The best example of this is the multiplexed
polymerase chain reaction (PCR). PCR, which is one of the most common techniques used in
Biosensors for Health, Environment and Biosecurity
242
molecular biology, involves using a pair of primers to amplify a certain fragment of a target
DNA or RNA manifold, until there is sufficient amount for detection or further downstream
analysis. In multiplex PCR, several pairs of primers are used to simultaneously amplify
different fragments. It is relatively easy to perform multiplexing in PCR, because the
primers can first be designed to amplify fragments of different sizes, and these fragments
can then be detected based on their size differences, either using gel electrophoresis or high-
resolution melting on real-time PCR systems. Alternatively, the different fragments can also
be targeted by different probes conjugated to fluorescent dyes of a specific color. Upon
hybridizing to the targets, the probes emit an optical signal corresponding to their dye,
which is detected in a real-time PCR system.
Multiplex PCR is one of the most common techniques used in clinical diagnostics because
the technology has matured significantly since its invention almost three decades ago. This
is also rather easy to implement on biosensors, as the process can be carried out in
microchambers (Merritt , 2010), or coupled to a capillary electrophoretic module (Thaitrong,
2009). The ability to perform multiplexed detection in PCR results from (a) the unique
feature in PCR that allows primers to be designed to amplify fragments of different sizes, (b)
the ability of the gel electrophoresis or real-time PCR system to differentiate the fragments
by size as a result of their difference in electrophoretic mobility or melting temperature, and
(3) the ability to differentiate the probes through color-emitting dyes. Probes used in
multiplex PCR are conjugated with fluorescent dyes that emit different wavelengths of light,
allowing them to be differentially detected. As a result, there is always a need for powerful
optical detection, being capable of exciting and detecting one or multiple wavelengths of
light. Due to limitations in the number of different wavelengths of light that can be excited
and detected, the number of different multiplexed targets that can be detected in a single
reaction is generally not high. One way to overcome this limitation is to combine multiplex
PCR with other technologies, such as microarrays.
2.2 2-D microarray
The development of microarrays is driven by the demand for high throughput multiplexed
analysis, such as the mapping of the human genome. This platform enables hundreds of
thousands of proteins or DNA probes to be precisely immobilized onto designated locations
within a microscopic area of a silicon or glass substrate (Ramsay, 1998; Schena et al, 1995),
with the different probes identified through their unique locations. The proteins or
oligonuleotides can be immobilized onto the surface using a high precision robotic arrayer
or synthesized in-situ using light-directed chemistry. With such high density chips, it
becomes possible to perform massively parallel interrogation of a large number of targets,
making microarrays a platform of choice for applications such as gene expression analysis
(Rahmatpanah, 2009), SNP genotyping (Wang et al, 1998; Lindroos et al, 2001) and
transciptome analysis (Li et al, 2006).
Since the inception of the microarrays about two decades ago, there has been a host of
companies offering the technology commercially. United States-based Affymetrix is one of
the first companies to offer commercial oligonucleotide microarrays, with its GeneChip one
of the most widely-used microarrays in a variety of applications, such as in prediction of
tumour relapse in hepatocecullar carcinoma patients (Roessler, 2010). Other companies
include Agilent, which uses inkjet printing for oligo synthesis on its 2D microarrays (Fig. 1),
Applied Microarrays and Roche NimbleGen. CombiMatrix's CMOS arrays have addressable
Multiplexing Capabilities of Biosensors for Clinical Diagnostics
243
electrodes that have been developed for both DNA detection and immunoassays (Gunn,
2010; Cooper, 2010). With the advent of microfabrication technology and with increased
competition, the prices of these microarrays have come down significantly over the years,
making the technology more accessible to the research and clinical diagnostics community.
Fig. 1. Agilent's inkjet printing technology for oligonucleotide synthesis on 2D microarrrays
A: the first layer of nucleotides is deposited on the activated microarray surface. B: growth
of the oligos is shown after multiple layers of nucleotides have been precisely printed. C:
close-up of one oligo as a new base is being added to the chain, which is shown in figure D.
(Courtesy of Agilent Technologies. All rights reserved).
2.3 3-D microarray
Despite its high-throughput potential, the 2-D microarray format is restricted by the
diffusion-limited kinetics, and electrostatic repulsion between the solution-phase targets and
the densely localized solid-phase probes. Furthermore, the amount of probes that can be
immobilized on the planar substrate, and hence the sensitivity and signal-to-noise ratio
(SNR), is also somewhat limited. The introduction of 3-D microarrays go some way toward
overcoming these limitations. These 3-D microarrays comprised of additional
microstructures that are fabricated onto planar substrates to provide a high surface-density
platform that increases the immobilization capacity of capture probes, enhances target
accessibility and reduces background noise interference in DNA microarrays, leading to
improved signal-to-noise ratios, sensitivity and specificity.
An example of an early 3-D microarray is the gel-based chip (Kolchinsky & Mirzabekov,
2002). The use of an array of nanoliter-sized polyacrylamide gel pads on a glass slide
provides distinct 3D microenvironments for the immobilization of oligonucleotides.
Compared to planar glass substrates, the gel-based format can be applied with a higher
probe concentration of up to 100 fold, thereby increasing the SNR. The near solution-phase
interaction between targets and probes within individual gel pads can also potentially
Biosensors for Health, Environment and Biosecurity
244
alleviate the problems associated with diffusion-limited kinetics. These gel-based
microarrays have been successfully demonstrated for the detection of SNPs associated with
β-thalassemia mutations (Drobyshev et al, 1997), and for the identification of
polymorphisms in the human mu-opioid receptor gene (LaForge et al, 2000).
Other 3-D structures fabricated onto planar surfaces include conical dendrons as well as
micropillars (Hong et al, 2005). By fabricating conical dendrons, nano-controlled spacings
can be created to provide enough room for the target strand to access each probe, thereby
creating a reaction format resembling that in a solution (Fig. 2). As a result, the
hybridization time can be reduced to significantly to allow effective discrimination of single-
nucleotide mismatches (Hong et al, 2005).
Fig. 2. Schematic diagram showing improved DNA hybridization onto a dendron-modified
substrate as compared to that of a normal substrate.
Ramanamurthy et al (2008) reported the fabrication of ordered, high-aspect ratio
nanopillar arrays on the surface of silicon-based chips to enhance signal intensity in DNA
microarrays (Fig. 3). These 150-nm diameter nanopillars were found to enhance the
hybridization signals by up to 7 times as compared to flat silicon dioxide substrates. In
addition, hybridization of synthetic targets to capture probes that contained a single-base
variation showed that the perfect matched duplex signals on dual-substrate nanopillars
can be up to 23 times higher than the mismatched duplex signals. The Z-Slides microarray
from United States-based company Life Bioscience comprises micropillars and nanowells
to enhance spot morphology and eliminate cross-talk between probe sites. By detecting
only the pillar surfaces which are several hundred microns from the base, background
noise is removed from the microarray scan.
A 3-D microarray which is markedly different from the above-mentioned approaches
involves immobilizing oligonucleotide probes onto a single thread instead of a planar
Multiplexing Capabilities of Biosensors for Clinical Diagnostics
245
substrate (Stimpson et al, 2004). The thread is subsequently wound around a core to form a
compact, high-density SNP detection platform. Hybridization can be carried out by
immersing the thread-and-core structure into a target solution, and completed within
approximately 30 min. This platform has been demonstrated for the analysis of SNPs in
CYP2C19, an important cytochrome P450 gene (Tojo et al, 2005).
Fig. 3. SEM images of the nanopillars fabricated on silicon-based biosensors. (a) Single-
substrate nanopillars consisting SiO
2
. (b) Dual-substrate nanopillars consisting SiO
2
layer
atop the Si pillar. (c) Very high-aspect ratio dual-substrate nanopillars. (d) Dense array of
ordered dual-substrate nanopillars. Scale bars are all 500 nm.
2.4 Bead microarray
One of the best examples of 3-D microarrays, and perhaps also one of the most successful
commercially available platforms, is the bead microarray. Unlike 2-D microarrays, the high
surface-to-volume ratio of beads allows a larger amount of probes to be immobilized to
improve the detection signals and signal-to-noise ratios. The small size of beads can further
reduce the reaction volume, and the use of microfluidics in bead arrays can shorten the
hybridization time to < 10 min, a 50 to 70-fold reduction as compared to conventional
microarrays (Ali et al, 2003). Unlike 2-D or the 3-D microarrays discussed, probes are usually
conjugated onto the beads prior to them being immobilized onto the microarrays. The major
challenge, therefore, in developing bead arrays is to identify the identities or their
corresponding immobilized probes of those randomly assembled beads in multiplexed
analyses.
The most common strategy is to encode beads with colorimetric signatures using
semiconductor nanocrystals, visible dyes or fluorophores, and subsequently decode them
Biosensors for Health, Environment and Biosecurity
246
through visual or fluorescence detection (Mulvaney et al, 2004). Color-encoded beads are
produced by embedding them with semiconductor nanocrystals, visible dyes, or
fluorophores and subsequently decoded through visual or fluorescence detection. For
example, Li et al (2001) mixed blue, green and orange fluorophores to yield 39 different
codes for encoding 3.2 μm-diameter polystyrene beads assembled onto a wafer.
Alternatively, two fluorophores can be mixed in different proportions to yield 100
distinguishable bead types that are subsequently decoded using two laser beams, as in the
Luminex xMAP technology (Dunbar, 2006) (Fig. 4). The emission characteristics of organic
fluorescent dyes are affected by changes in temperature, which may result in some bias
when used in temperature-dependent studies (Liu et al, 2005). The fluorescent dyes also
suffer from photobleaching and this can significantly affect the discriminability between
color codes, particularly if they are distinguished by the difference in their intensities.
Quantum dots, which are photostable, have size-tunable emission wavelengths, and can be
excited by a single wavelength to emit different colors at one time, are widely used to
distinguish beads. Han et al. (2001) incorporated quantum dots at different intensities and
colors to yield spectrally distinguishable polymeric beads of up to 10 distinct types (Fig. 4).
Using 5-6 colors, each at 6 intensity levels, it is possible to achieve up to 40 000 codes using
this approach, although this has yet to be demonstrated. These techniques for color
encoding beads are straightforward in that the color-emitting agents are directly
impregnated into the beads. However, this also means that the encoder signals cannot be
removed, resulting in possible interference between the encoder and reporter signals. To
avoid this, the number of reporter dyes available for use would inadvertently be reduced.
Also, encoding the beads into unique color codes is challenging as the color-emitting agents
must be mixed in precise proportions. The difficulty in distinguishing a large number of
color codes further means that only up to 100 color codes have been demonstrated so far,
limiting them to low or medium throughout applications (Xu et al, 2003; Li et al, 2004).
Fig. 4. (a) A set of 100 distinguishable bead types can be created by mixing precise
proportions of two fluorescent dyes, and subsequently detected using a flow cytometer with
two laser beams. (Courtesy of Luminex Corporation. All rights reserved). (b) Quantum dot
nanocrystals of 10 different emission colors incorporated into the beads to create spectrally
distinguishable types. (Adapted by permission from Macmillan Publishers Ltd: Nature
Biotechnology, copyright 2001).
Multiplexing Capabilities of Biosensors for Clinical Diagnostics
247
Beads within an array can also be individually addressed using barcodes. A graphical
barcode can also be written inside fluorescently dyed beads through a technique termed
“spatial selective photobleaching of the fluorescence” (Braeckmans, 2001). Using a specially
adapted laser scanning confocal microscope, any sort of pattern can be photobleached at any
depth inside the fluorescently dyed bead. This technique was used to photobleach a barcode
of different band widths onto 45 μm-diameter fluorescent beads. The advantages of this
technique are that only a single fluorescent dye is needed in the encoding scheme, and the
number of codes achievable is virtually unlimited. However, there is still the problem of
interference between the encoder and reporter fluorescence signals, while the effects of
photobleaching during the decoding stage might alter or degrade the barcode.
A widely used bead microarray platform for biological detection and clinical diagnostics is
the commercial BeadArray from Illumina, a market leader in high-throughput bead
microarrays. It assembles 3-micron silica beads onto a fiber optic of planar silica slides, for a
range of DNA and RNA analyses. There is also the Veracode technology, which uses digital
holographic barcode to identify the beads (Lin et al, 2009) (Fig. 5). When excited by a laser,
each microbead, which has a pillar-like rather than spherical shape, emits an image
resembling a barcode. Using this method, it becomes possible to have virtually unlimited
number of different bead types. The platform can be applied to both protein-based or DNA-
based assays.
Fig. 5. Illumina's BeadArray (top panel) and Veracode technology (bottom panel). (Courtesy
of Illumina. All rights reserved)
Biosensors for Health, Environment and Biosecurity
248
3. A simple spatially addressable bead-based biosensor
We describe here some of our own work in developing a biosensor that allow different bead
types to be incorporated and addressed with minimal efforts for encoding and decoding,
simplifying the development and usage of such devices (Ng et al, 2010). To achieve that,
different bead types are incorporated and identified based on their spatial addresses (akin to
microarrays) without the need for color-coding (Fig. 6). Beads of a certain type are spotted
onto a polymeric micro-matrix (or gel pad) fabricated on the surface of the biosensor. The
natural immobilization of the beads by the gel pad allows each bead to be anchored within
the gel pad on a unique location, acquiring spatial addresses that can be easily recorded via
an acquired image. Beads of a second type spotted over the same gel pad take up spatial
addresses distinct from those of the first bead type, allowing the two bead types to be easily
distinguished. This is repeated for immobilizing and distinguishing further bead types on
the gel pad, obviating the need for prior encoding and tedious decoding of beads. The
throughput can be increased by further spotting many different bead types onto the
hundreds of gel pads on each biosensor. We demonstrate the use of this bead-based
biosensor for detection of six common South-east Asian beta-globin gene mutations within
30 min, demonstrating its potential as a simple tool for rapid beta-thalassemia carrier
screening.
Fig. 6. Schematic representation of the spatially addressable bead-based biosensor (Adapted
from Ng et al, 2010, copyright Elsevier Inc).
3.1 Biosensor fabrication
The biosensor consisted an array of 19 x 24 polyacrylamide gel pads fabricated on a glass
slide (Corning, Corning, NY) pre-treated with Bind Silane (GE Healthcare, Piscataway, NJ).
Multiplexing Capabilities of Biosensors for Clinical Diagnostics
249
The gel pads had horizontal and vertical pitch of 300 μm, and each gel pad further
comprised a 10 x 10 array of micropillars (10x10x10 μm) with horizontal and vertical pitch of
10 μm (Fig. 7). A photopolymerization process described previously was used to create the
array of gel pads (Proudnikov et al., 1998), after which the glass slide was treated in 0.1M
NaBH
4
for 30 min to reduce gel pads auto-fluorescence.
The Biochip Arrayer (PerkinElmer, Boston, MA) was used to spot beads onto singular gel
pads on the device. Each gel pad was spotted with about 5 nL of a particular bead solution
(~ 9000 beads/µL), and then left to dry at room temperature for 2-3 min to allow beads
immobilization to the gel. Beads can also be spotted manually using a pipette, although this
required a larger amount of bead solution (0.25 μL) per spot and the beads usually covered
2-4 gel pads simultaneously. Positions of each spotted bead type were then recorded via
autofluorescence images for determining their spatial addresses. This was repeated until all
bead types for detecting a particular target were immobilized on the same gel pad. The
device can then be capped with a microfluidic module for sample flow-through, or the
buffer can also be applied over the spotted beads without the module. The
polydimethylsiloxane (PDMS) module was fabricated using common soft lithographic
techniques (Duffy et al., 1998).
Fig. 7. The bead-based biosensor. (A) The device comprised an array of polyacrylamide gel
pads on a glass slide. Each gel pad further comprised an array of micropillars. (B) Image
after spotting the first bead type onto the gel pad. The spatial address for each bead is
recorded in terms of their x, y coordinates. (C) Image after spotting a second bead type
(black arrows) and finally (D) a third bead type (white arrows). (Adapted from Ng et al,
2008, copyright Elsevier Inc).
Biosensors for Health, Environment and Biosecurity
250
3.2 Oligonucleotide probes and targets
The six common South-east Asian beta-globin gene mutations selected for this study were -
28 A→G, -29 A→G, IVSI5 G→C, IVSI1 G→T, Cd26 GAG→AAG, and IVSII654 C→T. For
each mutation, allele-specific probes were designed to hybridize with perfect
complementary to either the wildtype or mutant variant (Table 1). A biotin moiety was
added to the 5’ end of each probe, and conjugation of probes to 9.95 µm streptavidin-
modified polystyrene beads was carried out according to previously described protocol (Ng
et al., 2008).
PCR was carried out to amplify two fragments of the beta-globin gene, with the first
fragment (319 bp) encompassing the Exon 1 which incudes all the targeted mutations other
than IVSII654 C→T, which was contained in the second fragment (128 bp). Primer sequences
were: Frag1-F: 5’-Cy3-ACggCTgTCATCACTTAgAC-3’ (Genbank HUMHBB sequence
62010-62029); Frag1-R: 5’-CCCAgTTTCTATTggTCTCC-3’ (HUMHBB sequence 62328-
62309); Frag2-F: 5’- Cy3-TgTATCATgCCTCTTTgCACC-3’ (HUMHBB sequence 63227-
63247); and Frag2-R: 5’-CAATATgAAACCTCTTACATCAg-3’ (HUMHBB: 63354-63332).
Genomic DNA (100 ng) was amplified in a total volume of 50 µL containing 0.5 µM each of
the two sets of primers, 200 µM of each deoxynucleotide triphosphate, and 1 U of
HotStarTaq DNA polymerase in 1× supplied PCR buffer (Qiagen). Amplification was
carried out in an iCycler thermal cycler (BioRad) with an initial denaturation at 95 ºC for 15
min, followed by 35 cycles at 98 ºC for 30 s, 55 ºC for 30 s, and 72 ºC for 30 s, and a final
extension at 72 ºC for 5 min. Products were then re-amplified with only the forward primers
to generate ssDNA for allele-specific hybridization.
Probe name Mutation targeted Sequence (5’-3’)
-28,-29_WT -28/-29 WT CCTgACTTTTATgCCCAg
-28_MT -28 MT CCTgACTTCTATgCCCAg
-29_MT -29 MT CCTgACTTTCATgCCCAg
IVSI5,1_WT IVSI5/1 WT CTTgATACCAACCTgCCC
IVSI5_MT IVSI5 MT CTTgATAgCAACCTgCCC
IVSI5_WT IVSI1 MT CTTgATACCAAACTgCCC
Cd26_WT Cd26 WT gggCCTCACCACCAAC
Cd26_MT Cd26 MT gggCCTTACCACCAAC
IVSII654_WT IVSII654 WT TTgCTATTgCCTTAACCC
IVSII654_MT IVSII654 MT TTgCTATTACCTTAACCC
WT: wild-type, MT: mutant
Table 1. Probe sequences for targeting each of the beta-globin gene mutations selected for
this study. (Adapted from Ng et al, 2010, copyright Elsevier Inc).
3.3 Hybridization and signal detection
Re-amplified PCR products were purified using the Microcon YM-30 filter device
(Millipore) before being diluted to a 10 µL hybridization solution containing 500 mM NaCl
and 30% formamide. Hybidization was carried out by pipetting the solution over the
spotted beads. After 30 min incubation, the device was rinsed briefly with a solution
Multiplexing Capabilities of Biosensors for Clinical Diagnostics
251
containing only 500 mM NaCl and 30% formamide, and signal capture was carried out by
fluorescence imaging. The imaging system comprised an epifluorescence microscope (BX51,
Olympus), 100 W mercury lamp and fluorescence filter set 41007 (Chroma Technology).
MetaMorph 5.0 (Molecular Devices) was used to control acquisition of 12-bit monochrome
bead images at 2 s exposure from a SPOT-RT Slider cooled-CCD camera (Diagnostic
Instruments), and bead signals were quantitated using the modified version of a software
developed in-house previously (Ng and Liu, 2005).
3.4 Results and discussion
To demonstrate detection of the six beta-globin gene mutations, six human samples
heterozygous for -28 A→G, -29 A→G, IVSI5 G→C, IVSI1 G→T, Cd26 GAG→AAG, and
IVSII654 C→T, and one homozygous for IVSII654 C→T were analyzed using the bead-based
biosensor. All samples were genotyped previously by direct sequencing or multiplexed
minisequencing (Wang et al., 2003). Wildtype and mutant probes targeting each mutation
were conjugated to distinct bead sets, spotted onto a particular gel pad on the device, and
distinguished based on their spatial addresses (Fig. 8A). Probes were designed with the
targeted mutation as near as possible to its centre region, in order to increase the
discrimination between matched and mismatched duplexes. Due to the proximity between
the -28 and -29 mutations, as well as between the IVSI1 and IVSI5 mutations, each pair of
mutations must be detected simultaneously on a single gel pad by four sets of probes to
cover all possible genotypes. However, due to the lack of samples compound heterozygous
for -28/-29 and IVSI1/IVSI5, only three sets of probes were required in this study for each
pair of mutations.
Fig. 8B shows the signal intensity from the wildtype and mutant probes used to target each
mutation. All seven different samples were correctly genotyped using the device. For
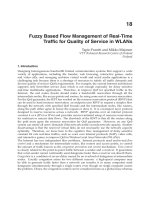
heterozygous mutations, signal intensities from the wildtype probes did not differ
significantly from that of the mutant probes, attaining student t-test p-values > 0.05 for all
except IVSII654 which had a slightly lower p-value of about 0.01. In the absence of a
mutation, the wildtype probe intensities were significantly higher than that of the mutant
probes, with p-values far lower than 0.001. For the homozygous IVSII654 mutation, the
mutant probe intensity was significantly higher than the wildtype probe, attaining a p-value
< 0.0001. This similarity or significant difference between wildtype and mutant probe
intensities allowed correct identification of the heterozygous mutant and homozygous
wildtype (or mutant) samples respectively.
The spatially addressable bead-based biosensor offers an alternative tool for simple yet
efficient and rapid detection of beta-thalassemia mutations. The device is comprised simply
of a glass slide fabricated with a thin polyacrylamide matrix on its surface using a
photopolymerization process that is faster (~ 45 min) and far less complicated than
conventional photolithographic techniques for making silicon chips. The main advantage of
the device is its ability to distinguish different bead types without the need for prior time-
consuming and laborious techniques such as color-encoding (Braeckmans et al., 2002). This
is due to the natural immobilization of the beads to the polyacrylamide gel pads, thus
allowing the beads to acquire unique spatial addresses. Detection is achieved by applying
the solution of PCR-amplified targets over the region of the spotted beads for passive
hybridization to occur, which obviates the need for microfluidic mixing and thus
microchannels. This further simplifies the fabrication process, lowers the cost of the device,
Biosensors for Health, Environment and Biosecurity
252
Fig. 8. Allele-specific hybridization on the device. (A) Typical example of the beads spotted
onto a gel pad. Probe-beads targeting Cd26 wildtype variant were spotted onto a gel pad,
followed by those targeting the mutant variant (red arrows). Difference in probe intensities
showed sample to be of homozygous Cd26 normal genotype. (B) Signal intensity from the
wide-type (■) and mutant (■) probe-bead targeting each of the six mutations selected for this
study. (Adapted from Ng et al, 2010, copyright Elsevier Inc).
Multiplexing Capabilities of Biosensors for Clinical Diagnostics
253
and reduces the sample volume required (< 10 µL). Despite the lack of microfluidic mixing,
detection is achieved in 30 min, although this might possibly be even faster, given that we
have achieved hybridization on this device within 10 min, albeit with synthetic targets (Ng
et al., 2008).
4. Conclusion
The advent of biosensors has allowed biomedical research and clinical diagnostics to
leverage upon the advantages of miniaturization, such as reduced sample volumes, faster
reaction times, and the possibility of multiplexed detection. The last point is of particular
importance, since the simultaneous detection of multiple targets at once has resulted in
significant time savings, particularly for applications requiring high-throughput. Often,
multiple targets must be detected in order to draw any meaningful conclusion in clinical
diagnosis. So much progress has been made in this field such that it is now possible to
utilize high throughput platforms such as microarrays to interrogate thousands of targets at
once. The crucial role played by these technologies, such as multiplex PCR and the various
forms of 2D, 3D and bead-based microarrays, in the past decades is indisputable, and will
continue to be so. However several challenges exist.
First, it is important to reduce the cost of some of these technologies so as to make it more
affordable, particularly for clinical diagnostics. For example, systems for real-time PCR can
be quite costly, due in part to the high precision optical detection modules found within.
With advances in optics, both light sources (e.g. LEDS) and detectors (e.g. digital cameras)
are getting more affordable, which would help to bring down the costs of such systems.
Also, part of the costs are attributable to the licensing issues. Manufacturers of real-time
PCR systems and reagents have to pay a license fee including royalties to the original patent
owners. With time, some of the patent protections will expire soon, so prices should also
come down, as in the case of the patent expiry of the Taq polymerase in 2006. The
manufacturing costs for microarrays and its bead-based counterpart are also high.
Hopefully with advances in manufacturing technologies, the cost can eventually be reduced.
Second, it is important for these technologies to be of sufficient sensitivity and specificity in
order to meet the standards required in clinical diagnostics. Real-time PCR has no problems
with that, since it is not uncommon for it to achieve a sensitivity and specificity close to
100%. 2-D microarrays, on the other hand, might face more of a challenge. The diffusion-
limited kinetics, steric hindrances and high noise contributed by the planar surface might
somewhat affect sensitivity and specificity. It is important to ascertain that the microarrays
can reproducibly meet the required levels of sensitivity and specificity before its application
to clinical diagnostics.
Third, the reaction times for some applications can still be rather high, particularly for the
microarrays. It is desirable to reduce these times further since clinical diagnostics often
require a fast turn around time to minimize patient anxiety and to aid decision making in
disease management.
Finally, with the advent of modern technologies, some of the multiplexing technologies
discussed here might find themselves being slowly displaced. Sequencing is a method used
to decipher the order of bases along a DNA. Traditionally slow, it is now possible to
perform massively parallel sequencing on high-throughput platforms to speed up its rate.
Known as next generation sequencing, thousands of sequences can now be generated at
once, using commercial sequencers from companies such as Illumina (Solexa), Roche (454)
Biosensors for Health, Environment and Biosecurity
254
and Applied Biosystems. Some of these platforms, like the SOLiD system from Applied
Biosystems, can generate up to 60 gigabases of DNA sequence per run. With these advances
in next generation sequencing comes the race for rapid and low cost full genome
sequencing. The Archon X Prize for Genomics was established in October 2006 to award
US$10 million to "the first Team that can build a device and use it to sequence 100 human
genomes within 10 days or less, with an accuracy of no more than one error in every 100,000
bases sequenced, with sequences accurately covering at least 98% of the genome, and at a
recurring cost of no more than $10,000 per genome”. As of January 2011, the prize is yet
unclaimed. However, the possibility of being able to sequence an entire human genome
accurately, cheaply and rapidly in future might supplant some of today’s multiplexing
technologies like the DNA microarray.
In summary, multiplexing capabilities in biosensors have come a long way and will
continue to advance rapidly in the next decade, with a large number of companies pouring
in large sums of monies into research and development. The ideal platform will be one
offering high-throughput, rapid and low cost diagnostics. Whether that can be realised in
the near future remains to be seen.
5. References
Ramsay, G. (1998). DNA chips: State-of-the art. Nat Biotech 16, 40.
Ali, M.F., Kirby, R., Goodey, A.P., Rodriguez, M.D., Ellington, A.D., Neikirk, D.P. &
McDevitt, J.T. (2003). DNA hybridization and discrimination of single-nucleotide
mismatches using chip-based microbead arrays. Anal Chem 75, 4732-4739.
Braeckmans, K. (2001). A new generation of encoded microcarriers. Drug Discovery
Technology 12-17 Aug, Boston
Chen, J., Iannone, M.A., Li, M S., Taylor, J.D., Rivers, P., Nelsen, A.J., Slentz-Kesler, K.A.,
Roses, A. & Weiner, M.P. (2000). A Microsphere-Based Assay for Multiplexed
Single Nucleotide Polymorphism Analysis Using Single Base Chain Extension.
Genome Res. 10, 549-557.
Cooper, J., Yazvenko, N., Peyvan, K., Maurer, K., Taitt, C.R., Lyon, W. & Danley, D.L. (2010).
Targeted deposition of antibodies on a multiplex CMOS microarray and
optimization of a sensitive immunoassay using electrochemical detection. PLoS
One. 19, e9781.
Daelemans C, Ritchie ME, Smits G, Abu-Amero S, Sudbery IM, Forrest MS, Campino S,
Clark TG, Stanier P, Kwiatkowski D, Deloukas P, Dermitzakis ET, Tavaré S, Moore
GE, Dunham I. (2010). High-throughput analysis of candidate imprinted genes and
allele-specific gene expression in the human term placenta. BMC Genet. 19, 25
Drobyshev, A., Mologina, N., Shik, V., Pobedimskaya, D., Yershov, G. & Mirzabekov, A.
(1997). Sequence analysis by hybridization with oligonucleotide microchip:
identification of beta-thalassemia mutations. Gene 188, 45-52.
Duffy, D.C., McDonald, J.C., Schueller, O.J.A. & Whitesides, G.M. (1998). Rapid Prototyping
of Microfluidic Systems in Poly(dimethylsiloxane). Anal. Chem. 70, 4974-4984.
Dunbar, S.A. (2006). Applications of Luminex(R) xMAP(TM) technology for rapid, high-
throughput multiplexed nucleic acid detection. Clinica Chimica Acta 363, 71.
Gunn, S., Yeh, I.T., Lytvak, I., Tirtorahardjo, B., Dzidic, N., Zadeh, S., Kim, J., McCaskill, C.,
Lim, L., Gorre, M., Mohammed, M. (2010). Clinical array-based karyotyping of
Multiplexing Capabilities of Biosensors for Clinical Diagnostics
255
breast cancer with equivocal HER2 status resolves gene copy number and reveals
chromosome 17 complexity. BMC Cancer. 28, 396
Han, M., Gao, X., Su, J.Z. & Nie, S. (2001). Quantum-dot-tagged microbeads for multiplexed
optical coding of biomolecules. Nat Biotechnol 19, 631-635.
Hong, B.J., Oh, S.J., Youn, T.O., Kwon, S.H. & Park, J.W. (2005). Nanoscale-controlled
spacing provides DNA microarrays with the SNP discrimination efficiency in
solution phase. Langmuir 21, 4257-4261.
Hong, B.J., Sunkara, V. & Park, J.W. (2005). DNA microarrays on nanoscale-controlled
surface. Nucl. Acids Res. 33, e106.
Iannone, M.A., Taylor, J.D., Chen, J., Li, M.S., Rivers, P., Slentz-Kesler, K.A. & Weiner, M.P.
(2000). Multiplexed single nucleotide polymorphism genotyping by oligonucleotide
ligation and flow cytometry. Cytometry 39, 131-140 .
Kolchinsky, A. & Mirzabekov, A. (2002). Analysis of SNPs and other genomic variations
using gel-based chips. Hum Mutat 19, 343-360 .
LaForge, K.S., Shick, V., Spangler, R., Proudnikov, D., Yuferov, V., Lysov, Y., Mirzabekov,
A. & Kreek, M.J. (2000). Detection of single nucleotide polymorphisms of the
human mu opioid receptor gene by hybridization or single nucleotide extension on
custom oligonucleotide gelpad microchips: potential in studies of addiction. Am J
Med Genet 96, 604-615.
Li, A.X., Seul, M., Cicciarelli, J., Yang, J.C. & Iwaki, Y. (2004). Multiplexed analysis of
polymorphisms in the HLA gene complex using bead array chips. Tissue Antigens
63, 518-528.
Li, Y., Elashoff D., Oh, M., Sinha, U., St John, M.A., Zhou, X., Abemayor, E., & Wong, D.T.
(2006). Serum circulating human mRNA profiling and its utility for oral cancer
detection. J Clin Oncol. 24, 1754.
Lin, C.H., Yeakley, J.M., McDaniel, T.K. & Shen, R. (2009). Medium- to high-throughput SNP
genotyping using VeraCode microbeads. Methods Mol Biol. 496, 129-42
Lindroos, K., Liljedahl, U., Raitio, M. & Syvanen, A.C. Minisequencing on oligonucleotide
microarrays: comparison of immobilisation chemistries. Nucleic Acids Res 29, E69-69
(2001).
Liu, W T., Wu, J H., Li, E.S Y. & Selamat, E.S. (2005). Emission Characteristics of
Fluorescent Labels with Respect to Temperature Changes and Subsequent Effects
on DNA Microchip Studies. Appl. Environ. Microbiol. 71, 6453-6457.
Merritt, A.J., Keehner, T., O'Reilly, L.C., McInnes, R.L. & Inglis, T.J. (2010). Multiplex
amplified nominal tandem-repeat analysis (MANTRA), a rapid method for
genotyping Mycobacterium tuberculosis by use of multiplex PCR and a
microfluidic laboratory chip. J Clin Microbiol. 48, 3758-61
Mulvaney, S.P., Mattoussi, H.M. & Whitman, L.J. (2004). Incorporating fluorescent dyes and
quantum dots into magnetic microbeads for immunoassays. Biotechniques 36, 602-
606, 608-609.
Ng, J.K. & Liu, W.T. (2005). LabArray: real-time imaging and analytical tool for microarrays
. Bioinformatics. 21, 689-690.
Ng, J.K., Selamat, E.S. & Liu, W.T. (2008). A Spatially Addressable Bead-based Biosensor for
Simple and Rapid DNA Detection. Biosens Bioelectron. 23, 803-810.
Biosensors for Health, Environment and Biosecurity
256
Ng, J.K., Wang, W., Liu, W.T., & Chong, S.S. (2010). Spatially addressable bead-based
biosensor for rapid detection of beta-thalassemia mutations. Anal Chim Acta. 658:
193-196.
Proudnikov, D., Timofeev, E. & Mirzabekov, A., (1998). Immobilization of DNA in
polyacrylamide gel for the manufacture of DNA and DNA-oligonucleotide
microchips. Anal Biochem. 259, 34-41.
Rahmatpanah, F.B., Carstens, S., Hooshmand, S.I., et al. (2009). Large-scale analysis of DNA
methylation in chronic lymphocytic leukemia. Epigenomics. 1, 39
Ramanamurthy, B., Ng, K.K.J., Shah, E.S., Balasubramaniam, N., and Liu, W.T. (2008).
Silicon nanopillars substrate for enhancing signal intensity in DNA microarrays.
Biosensors and Bioelectronics. 24, 723
Roessler, S., Jia, H.L., Budhu, A., Forgues, M., Ye, Q.H., Lee, J.S., Thorgeirsson, S.S., Sun, Z.,
Tang, Z.Y., Qin, L.X. & Wang, X.W. (2010). A Unique Metastasis Gene Signature
Enables Prediction of Tumor Relapse in Early-Stage Hepatocellular Carcinoma
Patients Cancer Res 70, 10202-10212.
Schena, M., Shalon, D., Davis, R.W. & Brown, P.O. (1995). Quantitative monitoring of gene
expression patterns with a complementary DNA microarray. Science 270, 467-470.
Stimpson, D.I., Knepper, S.M., Shida, M., Obata, K. & Tajima, H. (2004). Three-dimensional
microarray platform applied to single nucleotide polymorphism analysis.
Biotechnol Bioeng 87, 99-103.
Taylor, J.D., Briley, D., Nguyen, Q., Long, K., Iannone, M.A., Li, M.S., Ye, F., Afshari, A., Lai,
E., Wagner, M., Chen, J. & Weiner, M.P. (2001). Flow cytometric platform for high-
throughput single nucleotide polymorphism analysis. Biotechniques 30, 661-666,
668-669.
Thaitrong N, Toriello NM, Del Bueno N, Mathies RA. (2009). Polymerase chain reaction-
capillary electrophoresis genetic analysis microdevice with in-line affinity capture
sample injection. Anal Chem. 81, 1371-7
Tojo, Y., Asahina, J., Miyashita, Y., Takahashi, M., Matsumoto, N., Hasegawa, S., Yohda, M.
& Tajima, H. (2005). Development of an automation system for single nucleotide
polymorphisms genotyping using bio-strand, a new three-dimensional microarray.
J Biosci Bioeng 99, 120-124 .
Wang, D.G., Fan, J.B., Siao, C.J., Berno, A., & Young, P. et al. (1998). Large-scale
identification, mapping, and genotyping of single-nucleotide polymorphisms in the
human genome. Science 280, 1077-1082.
Wang, W., Kham, S.K., Yeo, G.H., Quah, T.C. & Chong, S.S. (2003). Multiplex
minisequencing screen for common Southeast Asian and Indian beta-thalassemia
mutations. Clin Chem. 49, 209-218.
Xu, H., Sha, M.Y., Wong, E.Y., Uphoff, J., Xu, Y., Treadway, J.A., Truong, A., O'Brien, E.,
Asquith, S., Stubbins, M., Spurr, N.K., Lai, E.H. & Mahoney, W. (2003). Multiplexed
SNP genotyping using the Qbead system: a quantum dot-encoded microsphere-
based assay. Nucleic Acids Res 31, e43.
11
Quartz Crystal Microbalance
in Clinical Application
Ming-Hui Yang
1
, Shiang-Bin Jong
2,3
, Tze-Wen Chung
1
,
Ying-Fong Huang
2,3
and Yu-Chang Tyan
2,4,5
1
Department of Chemical and Material Engineering,
National Yulin University of Science and Technology
2
Department of Medical Imaging and Radiological Sciences,
Kaohsiung Medical University
3
Department of Nuclear Medicine, Kaohsiung Medical University
Chung-Ho Memorial Hospital
4
National Sun Yat-Sen University - Kaohsiung Medical University Joint Research Center
5
Center for Resources, Research and Development, Kaohsiung Medical University
Taiwan
1. Introduction
Human serum albumin (HSA), with a molecular weight of approximately 67 kDa, is a
negative acute-phase protein and is the most abundant and characteristic globular
unglycosylated serum protein. It is predominantly synthesized in the liver and mainly plays
a role in mediating blood volume and regulated by the colloid osmotic pressure (COP) of
interstitial fluid bathing the hepatocyte (West, 1990; Peters, 1996). HSA plays an important
physiological role as a transporter for various substances. It has a good binding capacity for
water, metals (Ca
2+
, Na
+
, K
+)
, fatty acids, hormones, bilirubin, ligands, therapeutic drugs
and metabolites (Prinsen & de Sain-van der Velden, 2004). In plasma, albumin was
comprised about 50% of total plasma protein. This implies that 10-15 g of albumin is
produced per day in healthy subjects, which is about 0.4 mg albumin per gram liver per
hour. The high steady-state concentration in plasma is 30 to 50 mg/mL (Ballmer et al., 1990).
The albumin is minimal urinary loss in healthy subjects. Around 70 kg of albumin that
passes
through the kidneys each day, only a few grams pass through
the glomerular
membrane. Nearly all of this is reabsorbed, and
urinary loss is usually no more than 10–20
mg per day.
Therefore, HSA level in plasma is confirmed to be as a reliable indicator for the
prognosis and severity of several diseases, such as liver disease, renal function, infectious
disease, and cancer. Hypoalbuminemia, lack of albumin, results from liver disease, over
excretion from kidney, excess loss in gastrointestinal system, burns, acute disease, drug
effect or malnutrition. Hyperalbuminemia is a sign of serve dehydration or maybe result
from the retinol deficiency that all-trans retinoic acid moderate HSA (Rothschild et al., 1988;
Moshage et al., 1987; Mariani et al., 1976; Chlebowski et al., 1989; Phillips et al., 1989; Gross
et al., 2005).
Biosensors for Health, Environment and Biosecurity
258
Self-assembled monolayers (SAMs) have received a great deal of attention for their
fascinating potential technical applications such as nonlinear optics and device patterning
(Horne & Blanchard, 1998; Morhard et al., 1997; Bierbaum et al., 1995). They also have been
used as an ideal model to investigate the effects of intermolecular interactions in the
molecular assembly systems (Schertel et al., 1995; Yan et al., 2000; Himmel et al., 1997; Jung
et al., 1998). SAMs have been traditionally prepared by immersing a substrate into a solution
containing a ligand that is reactive to the substrate surface or by exposing the substrate to
the vapor of the reactive species. The most common utilization of the SAMs system is the
application of alkanethiolates (AT) on gold (Au), rather than other metals such as platinum,
copper, or silver, because gold does not have stable oxide compounds and easily forms a
bond with sulfur. The AT SAMs not only provides an excellent model system to study
fundamental aspects of surface properties such as wetting (Laibinis et al., 1992) and
tribology (Joyce et al., 1992), but also is a promising candidate for potential applications in
the fields of biosensors (Gooding &Hibbert, 1999), biomimetics (Erdelen et al., 1994) and
corrosion inhibition (Laibinis & Whitesides, 1992).
The quartz crystal microbalance (QCM) with an A-T cut quartz slide equipped with
electrodes has been used in various fields, such as environmental protection, chemical
technology, medicine, food analysis, and biotechnology (King, 1964; Guilbault, 1983;
Guilbault et al., 1988; Guilbault & Luong, 1988; Guilbault et al., 1992; Fawcett et al., 1988). It
has been widely used for substance measurement in liquid environments. Previously,
research has revealed that measurements in liquid environments are very complicated.
Several variations in liquid environments, such as characteristics of crystals and factors of
surface interactions, should be controlled and calibrated with accurate and precise machines
and mathematical formulas (Attli & Suleman, 1996; Nie et al., 1992; Muramatsu et al., 1988;
Voinova et al., 2002). Besides, the amount of sample used in aqueous environments often
requires more than can be acquired for analysis from the human body and may be a
limitation for use as a clinical immunosensor. The detection theory for QCM can be
explained by the Sauerbrey equation, which calculates that the mass change is proportional
to the oscillation frequency shift of the piezoelectric quartz crystal (O'Sullivan & Guilbault,
1999). Equation 1 shows the Sauerbrey equation in gas phase. ΔF: the frequency shift (Hz); F:
basic oscillation frequency of piezoelectric quartz (Hz); A: the active area of QCM (cm
2
); ΔM:
the mass change on QCM (g).
2
6
2.3 10
FM
F
A
(1)
This experiment completes a study for a potential biomedical application of functionalized
SAMs with the immobilized anti-HSA monoclonal antibody, and a QCM system using the
SAMs chip for HSA quantification. The attachment of anti-HSA monoclonal antibody to a
SAMs surface was achieved using water soluble N-ethyl-N'-(3-dimethylaminopropyl)
carbodiimide hydrochloride (EDC) and N-hydroxysuccinimide (NHS) as coupling agents.
Surface analyses were utilized by Atomic force microscopy (AFM), X-ray photoelectron
spectroscopy (XPS) and Fourier-transformed infrared reflection-reflectance absorbance
spectroscopes (FTIR-RAS). The quantization of immobilized antibody was characterized by
the frequency shift of QCM and the radioactivity change of
125
I labeled antibody. In
summary, the limit of detection (LOD) and linear range of the calibration curve of the QCM
method were 10 ng/ml and 10 to 1000 ng/ml. The correlation coefficients of HSA
Quartz Crystal Microbalance in Clinical Application
259
concentration between QCM and ELISA were 0.9913 and 0.9864 for the standards and serum
samples, respectively. This report illustrates an investigation of SAMs for the preparation of
covalently immobilized antibody biosensors.
2. Surface formation, modification and characterization
QCM chips (16MHz, diameter of quartz: 0.8 cm, diameter of Au: 0.5 cm, Yu-kuei, Taiwan)
were cleaned by the soxhlet extraction process using a solution (methanol and acetone 1:1)
for 24 hrs. Then, the QCM chips were cleaned with ultra pure ethanol (RDH 32205, Riedel-
deHaën), and dried with nitrogen. The QCM chips were immersed into a 0.5 mM 11-
mercaptoundecanoic acid (11-MUA, C
11
H
22
O
2
S, 450561, Aldrich) ethanol solution for 8
hours and rinsed with pure ethanol twice. The alkanethiols adsorbed spontaneously from
solution onto the Au surface. The functionalized thiol groups were chemisorbed onto the Au
surface via the formation of thiolate bonds. After being dried by nitrogen, the surface
analysis was performed by X-ray photoelectric spectroscopy (XPS) and Fourier-transformed
infrared spectroscopy (FTIR).
2.1 Atomic force microscopy image of QCM ship surface
The QCM chip surface was analyzed by the Atomic force microscopy (AFM). The AFM
image was acquired with a Slover PRO (NT-MDT, Russia) atomic force microscopy in
ambient pressure. The semi-contact mode was used with a frequency of 0.5 μm/s to scan an
area of 10×10 μm
2
. The AFM probe was a golden silicon probe (NSG11, NT-MDT, Russia)
with the length, width, thickness, resonant frequency and force constant as 100 mm, 35 μm,
2.0 μm, 255 kHz and 11.5 N/m
2
, respectively.
A rough chip exterior may cause an uneven SAMs surface. To investigate the topology
characteristics of the surface, AFM was used to observe the QCM chip surface. In Figure 1,
the image of the topographical map taken in the semi-contact mode of a 10×10 μm
2
zone is
shown. Figure 1(a) is a surface image of the QCM chip, and Figure 1(b) shows the three-
dimensional structure. This impressive image in Figure 1(b) shows a very clear set of surface
roughness with a mean depth of about 1.2 μm. A rough surface may provide the
opportunity to increase the reaction surface and the effectiveness antibody immobilization.
Most SAMs studies were established on the ideal, well-ordered and smooth single-crystal
silicon (100 or 111) wafers primed with a metal adhesion layer (Weng et al., 2004, 2006). On
the single-crystal silicon wafers, theoretically, all alkanethiols should be bound onto the
SAMs surface as an Au-S-C- structure. Unlike the surface of ideal single-crystal silicon
wafers, the rough QCM chip surface may be composed of three types of SAMs structures:
alkanethiol bound, attachment by adhesion, and sulfonite-Au bonding. The XPS (S 2p,
dialkylsulfide and sulfonite species) indicated that the SAMs deposited onto the QCM
surface was non-regular.
2.2 Contact angle measurement
The contact angles (θ) were measured in air using a goniometer (Krüss apparatus). A Milli-Q
grade water (Millipore Co., Inc.) was used to contact with the sampling dimension by the
sessile drop method. For this measurement, 1 μl droplet was placed slightly on the specimen
with the needle of a syringe. The value of θ was determined as the volume of the droplet
was slowly increased
Biosensors for Health, Environment and Biosecurity
260
(a)
(b)
Fig. 1. AFM images of the Au-covered QCM chip. (a) blank, 10×10 μm, (b) blank, 3D
structure. AFM measurements could also be used for measuring the surface roughness of
the QCM chip. The mean surface roughness was 1.2 nm.
QCM chip surface Contact angles (deg)
Au chip 64.1± 2.3
11MUA/Au chip 12.3± 1.6
Table 1. Water Contact Angles Measurement of the SAMs on QCM chip