Photodiodes Communications Bio Sensings Measurements and High Energy Part 7 ppt
Bạn đang xem bản rút gọn của tài liệu. Xem và tải ngay bản đầy đủ của tài liệu tại đây (1.92 MB, 20 trang )
Single Shot Diagnostics of Quasi-Continuously Pumped Picosecond Lasers Using Fast Photodiode and Digital Oscilloscope 7
4. Experimental investigation of picosecond laser pulses
4.1 Experimental determination of the measuring system minimal FWHM
Minimal FWHM was determined experimentally using an experimental fiber laser generating
mode-locked pulses at 1.5 μm with duration less than 2 ps (measured by the autocorrelator).
Pulse of this duration can be assumed as Dirac delta function for our measuring system. In
order to avoid nonlinearities in the photodiode and oscilloscope, during all the measurements
the oscilloscope vertical resolution was set at 5 mV/div and the signal amplitude was
about 20 mV. The oscilloscope bandwidth was set to maximal analogue bandwidth of
9 GHz with the sampling frequency of 40 GS/sec. The oscilloscope enables two regimes of
waveform acquisition and display - linear (only measured points are displayed) and sin(x)/x
(approximation by this function). It was experimentally found that the FWHM measurement
difference using these two acquisition regimes is about 1 ps and can be neglected. Therefore,
most of further described measurements were performed in the linear acquisition regime.
There are two possibilities how to determine the FWHM of the measured pulse. The first is use
of build-in function of the oscilloscope - Width at 50 %. The oscilloscope also enables to show
histogram or statistics of these measured values. The second possibility is to save the data
and perform a curve fit by Gaussian function. It has been found that using a Gaussian fit is for
our pulses adequate and the determined FWHM of a such pulse with duration below 80 ps is
about 18 % shorter than the value measured by the oscilloscope. Because of this uncertainty,
most of FWHM values presented below were determined by the Gaussian fit of the measured
pulse shape. All the presented values represent average value of about 100 pulses.
Recorded pulse from the 1.5 μm fiber laser with duration of 2 ps using sin(x)/x waveform
approximation is shown in Fig. 1. The width measured by the oscilloscope was 75.5
±1.5 ps.
Fig. 1. Oscilloscope trace of the measured 2 ps long pulse using sin(x)/x approximation.
In Fig. 2 similar pulse recorded in the linear acquisition regime is shown. The width measured
by the oscilloscope was 76
±2 ps. According to the Gaussian fit the pulse width was 63 ±2 ps.
There is a difference of about 13 ps in comparison with theoretically calculated minimal
FWHM of
∼50 ps given in Table 1 which can be explained by uncertainity of used constants
K, datasheet values, and influence of the cable and connectors.
There is also the second possibility to determine the FWHM
SY STEM
using the longer pulse
with known duration FWHM
REA L
and from the measured FWHM
MEAS
to calculate the
111
Single Shot Diagnostics of Quasi-Continuously
Pumped Picosecond Lasers Using Fast Photodiode and Digital Oscilloscope
8 Will-be-set-by-IN-TECH
Fig. 2. Measured 2 ps long pulse (dots) and its Gaussian fit (green line) and Spline fit (red
curve).
system response. In our experiments we have used a laboratory designed mode-locked
Nd:YAG laser providing stable 22
±2 ps pulses (measured by the streak camera and
autocorrelator) with repetition rate of 10 Hz at the wavelength of 1.06 μm (Jelinek, 2011;
Kubecek, 2011). The laser system schematic is shown in Fig. 3. From the Gaussian fit
of the measured pulse the width of 64
±2 ps was determined and using this value the
FWHM
SY STEM
of 60 ps was calculated. This value is in good agreement with experimentally
determined value of 63 ps obtained using fiber laser.
Fig. 3. Schematic of the Nd:YAG laser system generating 22 ±2 ps pulses.
4.2 Duration estimation of pulses shorter than system impulse response time
In order to determine how short pulses can be reliably measured using our calibrated
measuring system, pulses generated by two other passively mode-locked laser sources were
measured and the real pulse width was calculated using both constants FWHM
SY STEM
.The
first source was continuously pumped and mode locked Nd:YAG laser generating pulses in
range of 17 to 21 ps (measured by the autocorrelator) with repetition rate of 110 MHz. The
112
Photodiodes – Communications, Bio-Sensings, Measurements and High-Energy Physics
Single Shot Diagnostics of Quasi-Continuously Pumped Picosecond Lasers Using Fast Photodiode and Digital Oscilloscope 9
second source was quasi-continuously pumped and mode-locked Nd:GdVO
4
laser generating
after cavity dumping from the Q-switched trains single pulses with duration of 56 ps
(measured by the autocorrelator and streak camera) at the repetition rate of 30 Hz (Kubecek,
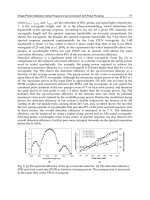
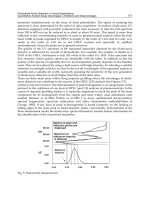
2010). Calculated pulse widths are shown in Table 2 and also in Fig. 4 together with calibration
curves for both FWHM
SY STEM
constants.
Pulse width FWHM [ps]
Laser Measured real LeCroy Gaussian Calculated value
(autocorrelator value approximation for FWHM
SY STEM
:
or streak) (our value) 60 ps 63 ps
Er fiber CW ML
2
2 76 ±2 63 ±2 19±7 -
Nd:YAG SP ML
2
22 ±2 79 ±2 64 ±2 22 ±5 11 ±8
Nd:YAG CW ML
2
17 - 21 79 ±2 66 ±3 27 ±7 20 ±9
Nd:GdVO
4
SP ML
2
56 ±8 90 ±6 82 ±12 56 ±16 52 ±18
Table 2. Measured and calculated pulse widths for all studied laser sources.
Fig. 4. Calibration curves for our measuring photodiode-oscilloscope system (for
FWHM
SY STEM
of 60 and 63 ps) and calculated real pulse durations of three measured laser
sources
It can be seen that the real pulse width calculation from the measured
∼20 ps pulses is
possible, but error up to 50 % may be introduced according to FWHM
SY STEM
constant choice
and the uncertainty of the measurement and the Gaussian fit. The real pulse width calculation
for
∼50 ps pulses is more realistic and for both calibration curves (for different FWHM
SY STEM
constants) does not introduce significant error. The uncertainty originates mainly from the
laser stability itself.
2
ML: mode-locking, CW: continuous wave, SP: single pulse
113
Single Shot Diagnostics of Quasi-Continuously
Pumped Picosecond Lasers Using Fast Photodiode and Digital Oscilloscope
10 Will-be-set-by-IN-TECH
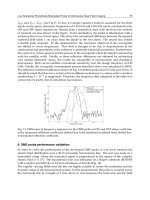
4.3 Single pulse duration stability investigation
The oscilloscope - photodiode system can be used for the single pulse duration stability
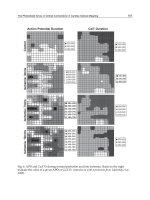
investigation. An example of such measurement is shown in Fig. 5. Duration of the single
pulses from the mode-locked Nd:GdVO
4
laser was measured using oscilloscope’s build-in
function and histogram from
∼2000 successive pulses was shown. In spite of the fact that
using the oscilloscope - photodiode system there may be some uncertainty in the absolute
pulse width calculation, the width stability from many pulses can studied.
Fig. 5. Single pulse stability investigation using the oscilloscope statistical functions. Upper
trace: measured pulse, lower trace: pulse width histogram from
∼2000 successive pulses.
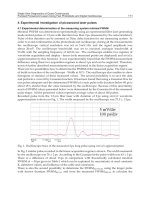
4.4 Investigation of the pulse shortening along the Q-switched mode-locked train
Using the oscilloscope - photodiode system it is possible to measure not only the temporal
and energetic stability of the single pulses, but moreover to study some special effects, such
as pulse width shortening along the laser output train containing tens to hundreds of pulses.
Investigation of such effect in single output train cannot be performed by available optical
measuring methods. As it was mentioned in the previous chapter, in spite of the fact that
using the oscilloscope - photodiode system there may be uncertainty in the absolute pulse
width, the pulse shortening effect studied in two pulsed laser systems can be clearly observed.
The first laser system was based on Nd:GdVO
4
active material and passively mode locked by
the semiconductor saturable absorber. The active medium was quasi-continuously pumped
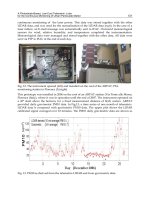
by the laser diode at repetition rate of 30 Hz. The 30 μJ laser output pulse train consisted of 12
pulses and its oscillogram is shown in Fig. 6. Lower traces show details of the highest pulse
- pulse no. 3 in the train and later pulse no. 9. Fig. 7 shows plotted dependence of pulse
duration evolution along the train measured from single laser shot and recalculated. It can
be seen that the pulse duration decreased from the initial 160 to 55 ps at the end of the train
(Kubecek, 2010).
114
Photodiodes – Communications, Bio-Sensings, Measurements and High-Energy Physics
Single Shot Diagnostics of Quasi-Continuously Pumped Picosecond Lasers Using Fast Photodiode and Digital Oscilloscope 11
Fig. 6. Nd:GdVO
4
laser system output pulse train oscillogram (upper trace) and zoomed
pulses no. 3 and 9 (lower traces).
Fig. 7. Calculated pulse duration evolution along the trains generated by the Nd:GdVO
4
and
Nd:YAG laser systems.
Similar pulse shortening effect was also observed in the output train of the passively
mode-locked Nd:YAG laser with passive negative feedback when output trains containing
hundred of pulses can be generated. Stretched 100 ns long pulse train shown in Fig. 8 has
total energy of 60 μJ and contains
∼40 pulses. The pulse duration evolution along this train
is shown in Fig. 7. The pulse shortening effect from original 190 ps in the beginning of the
115
Single Shot Diagnostics of Quasi-Continuously
Pumped Picosecond Lasers Using Fast Photodiode and Digital Oscilloscope
12 Will-be-set-by-IN-TECH
train to the final 70 ps was observed (Kubecek, 2009) resulting from the combined effect
of the saturable absorber nonlinear transmission and passive negative feedback due to the
beam defocusing via two-photon absorption in GaAs substrate of the semiconductor saturable
absorber (Agnesi, 1992).
Fig. 8. Nd:YAG laser system output pulse train oscillogram (upper traces) and details of the
pulse shapes from the beginning and end of the train (lower traces).
5. Conclusion
The aim of this chapter was the investigation of capabilities of the photodiode - oscilloscope
measuring system for the single shot diagnostics of quasi-continuously pumped picosecond
lasers. After the introduction, physics of light detection and photodiodes with emphasis
on the response time of the PIN photodiodes was shortly discussed. In the third section,
the oscilloscope - photodiode measuring system response and minimal pulse width was
theoretically analyzed. According to this analysis, calculations based on datasheet values
were performed for the used system consisting of the real time digital oscilloscope LeCroy
SDA-9000 and PIN photodiode EOT ET-3500. The minimal pulse width (FWHM of the
impulse response) of 50 ps was estimated. In the next section, this minimal pulse width was
measured experimentally. Dependence of the width on different oscilloscope settings and
waveform fitting was discussed. Measured minimal pulse width resulted in values between
60 and 63 ps and according to these results two calibration curves were obtained. In order
to determine how short pulses can be reliably measured using the calibrated measuring
system, pulses generated by two other laser sources were measured and their real widths
were calculated and compared. It has been shown that even for pulses shorter than the
minimal pulse width the useful real pulse width estimation can be obtained. Measurement
and subsequent width calculation of the pulses with the duration comparable to the minimal
pulse width can be performed with sufficient precision. The advantages of the calibrated
measuring system were demostrated on the study of the laser pulse width stability and also
on the investigation of the special effect - pulse shortening along the laser output pulse train.
6. Acknowledgements
The authors gratefully acknowledge the assistance of Pavel Honzatko, PhD and the
consultations with David Vyhlidal.
This research has been supported by the Czech Science Foundation under grant No.
102/09/1741, the research projects of the Czech Ministry of Education MSM 6840770022
116
Photodiodes – Communications, Bio-Sensings, Measurements and High-Energy Physics
Single Shot Diagnostics of Quasi-Continuously Pumped Picosecond Lasers Using Fast Photodiode and Digital Oscilloscope 13
“Laser Systems, radiation and modern optical applications” and ME 10131 “Picosecond solid
state lasers and parametric oscillators for sensors of rotation and other physical quantities.”
7. References
Agilent. Evaluating oscilloscope bandwidths for your application. Agilent Application note
1588, URL: cp.literature.agilent.com/litweb/pdf/5989-5733EN.pdf.
Agnesi, A., et al. (1992). Generation of Extended Pulse Trains of Minimum Duration by
Passive Negative Feedback Applied to Solid-state Q-Switched Lasers. IEEE Journal
of Quantum Electronics, Vol. 28, No. 3, 710–719.
Andrews, J.R. (1989). TDR, step response and S parameter measurements in
the time domain Picosecond pulse labs - Application note AN-4, URL:
www.picosecond.com/objects/AN-04.pdf.
Berger, P.R. (1996). MSM Photodiodes IEEE Potentials, 25–29.
Bitter, M. (2000). InP/InGaAs pin-Photodiode Arrays for Parallel Optical Interconnects, Dissertation
to the Swiss Federal Institute of Technology Zuerich, Switzerland.
Diels, J C. & Rudolph, W. (1995). Ultrashort laser pulse phenomena, Academic Press, ISBN
0-12-215492-4, USA.
Effenberger, F.J. & Joshi, A.M. (1996) Ultrafast, Dual-Depletion Region InGaAdInP p-i-n
Detector. Journal of lightwave technology, Vol. 14, No. 8, 1859–1864.
Electro-Optics Technology, Inc. 10GHz GaAs and InGaAs Photodetectors datasheet, Jan 2011.
Gibbons, G. (1987). Gallium arsenide electronics. Phys. Technol., Vol. 18, 5–16.
Ishibashi, T., et al. (2000). InP/InGaAs uni-traveling-carrier photodiodes. IEICE Trans.
Electron., Vol. E83-C, 938
˝
U-949.
Jelínek, M., et al. (2011). 0.8 mJ quasi-continuously pumped sub-nanosecond highly doped
Nd:YAG oscillator-amplifier laser system in bounce geometry. Laser Physics Letters,
Vol. 8, No. 3, 205–208.
Johnson, H.W. & Graham, M. (1993). High Speed Digital Design: A Handbook of Black Magic,
Prentice Hall, ISBN 0133957241, USA.
Kache, S. (2005). Optimization of charge collection efficiency in MSM photodetector. Master thesis
to University of Missouri-Columbia, USA.
Keller, U. (2002). Ultrakurzzeit-Laserphysik, Eidgenossische Technische Hochschule (ETH),
Zurich, Switzerland.
Keller, U. (2007) Ultrafast solid-state lasers Laser Physics and Applications, Subvolume B: Laser
Systems. Springer, ISBN 978-3-540-26033-2, Berlin, Germany.
Kubeˇcek, V., et al. (2009). Pulse shortening by passive negative feedback in mode-locked train
from highly-doped Nd:YAG in a bounce geometry. Proc. SPIE, Vol. 7354, 73540R.
Kubeˇcek, V., et al. (2010). 0.4 mJ quasi-continuously pumped picosecond Nd:GdVO
4
laser
with selectable pulse duration. Laser Physics Letters, Vol. 7, No. 2, 130–134.
Kubeˇcek, V., et al. (2011). Cavity dumping of single 19 ps pulses from passively mode-locked
quasi-continuously pumped highly doped Nd:YAG laser. Proceedings of CLEO Europe,
Munich, Germany, May 2011.
LeCroy. Serial Data Analyzers (9 GHz - 18 GHz) datasheet, 2009.
Liu, K., et al. (2010). ZnO-Based Ultraviolet Photodetectors. Sensors, Vol. 10, 8604–8634, ISSN
1424-8220.
117
Single Shot Diagnostics of Quasi-Continuously
Pumped Picosecond Lasers Using Fast Photodiode and Digital Oscilloscope
14 Will-be-set-by-IN-TECH
Malyshev, S. & Chizh, A. (2004). State of the art high-speed photodetectors for microwave
photonics application. Proc 15th Int. Conf. Microwaves, Radar and Wireless
Communications, Vol. 3, 765–775.
Nagatsuma, T. & Ito, H. (2011). High-Power RF Uni-Traveling-Carrier Photodiodes
(UTC-PDs) and Their Applications. Advances in photodiodes. InTech, ISBN
978-953-307-163-3, Rijeka, Croatia.
Rulliere, C. (2003). Femtosecond laser pulses, Springer, ISBN 0-387-01769-0, USA.
Saleh, B.E.A. & Teich, M.C. (2007). Fundamentals of photonics, Wiley, ISBN 978-0-471-35832-9,
USA.
Tektronix. XYZs of Oscilloscopes. Tektronix Application note, URL: www.tek.com.
Wang, J., at al. (2008). Evanescent-coupled Ge p-i-n photodetectors on Si-waveguide with
SEG-Ge and comparative study of lateral and vertical p-i-n configurations. IEEE
Electron Device Letters, Vol. 29, No. 5, 445–448.
118
Photodiodes – Communications, Bio-Sensings, Measurements and High-Energy Physics
7
A Photodiode-Based, Low-Cost
Telemetric- Lidar for the Continuous
Monitoring of Urban Particulate Matter
Massimo Del Guasta, Massimo Baldi and Francesco Castagnoli
Istituto Fisica Applicata “Nello Carrara” (IFAC) CNR
Italy
1. Introduction
Photodiodes are widely used in LIDARs (Light Detection And Ranging) (Measures, 1988). In
ordinary LIDARs, a pulsed laser source is used to probe the atmosphere, while a fast
photomultiplier or Avalanche photodiode (APD) is used to receive the high-frequency
return from the atmosphere. APDs are used mainly in the near infrared, where
photomultipliers are blind. APDs were used in both analog (Porter et al., 2002) and photon
counting mode ( Tatsumi & Tadashi, 1999) for the fast detection of IR LIDAR signals. In our
simple telemetric LIDAR, a “vintage” technique used in the 1930s for pioneer studies on
atmospheric aerosols (Duclaux,1936) and since then seldom reassessed (Meki et al.,1996),
has been re-examined for the remote measurement of urban aerosols. Indeed, it represents
a simplified and less expensive version of the elastic-backscatter LIDAR for short-range
applications in which a continuous monitoring of particulate matter (PM) is required. It
meets the requisite of being a simple instrument for the unattended, real time monitoring of
PM to be used in urban pollution monitoring networks. For short-distance applications in
which aerosols are to be measured within one hundred meters, a telemetric LIDAR can
replace an ordinary LIDAR with a cost that is approximately 40 times lower than that of any
ordinary LIDAR. The technique consists of illuminating the atmosphere with a laser beam
modulated at low frequency, and then collecting the light scattered by aerosols by means of
a photodiode array placed at the output of a telescope located at a certain distance from the
laser. The observation angle defines the distance of the probed air volume through
triangulation; the received intensity is related to PM10 in non-condensing conditions. The
instrument is inexpensive, rugged, and suitable for outdoor operation, 24 h/day; it
provides, moreover, all-weather measurement of PM with a time resolution of a few
minutes. In the prototype, a green laser is modulated (on/off) at 620 Hz and emitted into
the atmosphere. The choice of a visible wavelength simplifies both the alignment of the
system and the calibration of the system in terms of volume backscatter (ch.2). The light
backscattered by clean air and suspended matter is observed by means of a simple refractive
telescope placed at a distance of 50 cm. The light received, which is filtered by means of an
interference filter, is focused on a photodiode array placed on the telescope-focus surface.
Each photodiode receives light scattered from different distances due to the telemetric
geometry. A single photodiode may be selected for continuous measurements at a fixed
Photodiodes – Communications, Bio-Sensings, Measurements and High-Energy Physics
120
distance, while a cyclic scan of different photodiodes is possible in order to measure it at
different distances. A lock-in filter centred at the modulation frequency extracts and
amplifies the weak signal produced by molecular air and aerosols. The DC signal produced
by the lock-in is easily acquired by the digital electronics, which is based on a Microchip
PIC18F6720 microcontroller. The telemetric-LIDAR data are acquired together with meteo
and house-keeping data. The same board controls the laser, the meteorological sensors, and
a GPS-GSRM module for the remote transmission of data. Remote PM measurements at
distances of between a few meters and a maximum of 100 m can be obtained using this
instrument. The signal obtained is almost proportional to the mass concentration of urban
aerosols, as will be shown in this chapter through comparisons with standard PM10
instruments.
2. Theory of operation
Urban atmospheric aerosol is composed of particles of varying sizes. The size distribution
N(r) for LIDAR applications can be modelled as the sum of two lognormal modes (John et
al.,1990): the “accumulation mode”, composed of mature aerosol particles, and the “coarse
mode”, composed of dust that has a short life in the atmosphere:
2
2
imi
2
i1
ii
r
ln ( )
dN(r) N r
exp
dr
rln(s) 2 2ln s
(1)
where r is the particle radius, r
mi
is the median radius, Ni the total concentration, while s
i
is
the geometric width for the i-th mode. The elastic-backscatter LIDAR technique (including
the telemetric LIDAR described here) measures the light backscattered at almost 180° by
gases (Rayleigh scattering) and aerosols. The interpretation of LIDAR measurements in
terms of aerosol quantities is based on a simulation of the scattering of the light by means of
particles of known composition, shape and size. The scattering by a generic, spherical
particle is described by the EM field transformation matrix:
()
1
0
2
()
() 0
*
()
0()
itkR
sso
pp
EE
S
e
EE
S
ikR
(2)
where
is the scattering angle, R is the distance vector, ,
p
s
EE are the EM field components
with polarization parallel and perpendicular, respectively, to the incidence plane, and
()
i
S
are elements defined by the geometry and composition of the particle. The scattering
by homogeneous, spherical particles is formally solved (Mie scattering), and simple series
expansions provide good numerical approximations (Van de Hulst, 1957).
The differential scattering cross section, defined by:
22
12
2
() ()
'( )
2
SS
k
(3)
is simplified in the case of LIDARs into the backscatter (
=180°) differential cross section:
A Photodiode-Based, Low-Cost Telemetric- Lidar
for the Continuous Monitoring of Urban Particulate Matter
121
2
1
2
(180 )
'(180 )
S
k
(4)
This quantity represents the power received by the LIDAR per unit of solid angle divided by
the power of the incident plane wave for a single scatterer. In the presence of a volume
concentration of N [part/m
3
] of identical spheres, the volume backscatter coefficient is
defined by β=N*β’(180°) [m
-1
sr
-1
]. In general, both aerosols and gases contribute to the
backscatter. After conversion of the backscattered light into electrical signals, the LIDAR
signal
V(z) received from distance z from the elastic-backscatter LIDAR can be expressed
as (Collis & Russel, 1976) :
'
0
2(')(')'
0
2
1
() () ()
z
am
zzdz
am
Vz kE z z e
z
(5)
where Eo is the emitted laser power,
k is an instrumental constant, and a and m refer,
respectively, to the aerosol and molecular components. The exponential term accounts for
the dispersion of the laser beam in the atmosphere due to the extinction by aerosols (σ
a
) and
gases (σ
m
). In the instrument described here, the extinction terms can be disregarded due to
the short working distances, and thus the LIDAR signal can be simplified to:
0
2
1
() () ()
am
Vz kE z z
z
(6)
By assuming a discrete number of measurement distances, for each j-th measurement
distance, and by assuming a constant laser power Eo, the telemetric-LIDAR output is simply
proportional to the volume backscattering cross section:
jj
a
j
m
VK
(7)
The molecular component of the backscatter
m
(Penndorf, 1955; Bucholz, 1995) is practically
constant in the first 100 meters of atmosphere, and is numerically well-known (
m
=1.59E-6
[m
-1
sr
-1
] at 532 nm and NPT conditions). This quantity is proportional to
-4
In conditions of
clean air (β
a
<<β
m
) the constants K
j
can thus be obtained from the signal V
j
:
clean
j
m
Vj
K
(8)
(being V
j
clear
proportional to
-4
, the use of visible, green light makes this calibration easier
than using of IR light). After this measurement, the instrument is calibrated in terms of
volume backscatter units [m
-1
sr
-1
], and the aerosol volume backscatter can be derived from
the calibrated measurement as:
a
= -
m
. The aerosol volume backscatter is related, in a
complex and nonlinear way, to the concentration, size distribution, shape and composition
of the aerosol particles . Scattering simulations performed at 532 and 1064 nm (Kent, 1978;
Del Guasta & Marini, 2000) on spherical particles of different nature showed that
a is,
roughly, directly proportional to the aerosol wet-mass concentration [µg/m
3
] in most of the
practical cases encountered in the urban environment. The proportionality factor as
obtained by simulation (Del Guasta & Marini, 2000) is found to be ≈2 *10
7
5*10
6
Photodiodes – Communications, Bio-Sensings, Measurements and High-Energy Physics
122
[(ug/m
3
)/(1/m sr)] at 532 nm. The aerosol mass concentration was relatively independent
from particle size distribution and composition in simulated urban conditions. The simple
proportionality between wet-mass aerosol concentration and
a
could be used in the
presence of relative humidity in the 70%<RH<98% range and in the absence of strong coarse
aerosol (dust) loadings. In all the other cases the uncertainty in the conversion could
increase significantly. The main indication resulting from these simulations is that the
output of a simple elastic backscatter LIDAR (like the telemetric instrument described here)
is roughly proportional to the wet-mass concentration of urban aerosols. The instrument
output could thus simply be calibrated in terms of urban aerosol mass concentration in
many conditions. This technique has been utilized experimentally with the use of an
ordinary backscatter LIDAR (Del Guasta, 2002). The LIDAR-derived PM concentration is
affected by much larger uncertainty than standard techniques are. Nevertheless, the
capability of this optical technique to provide unattended remote measurements with a time
resolution of minutes makes it a precious complementary tool for urban pollution studies.
We can also point out that the wet mass concentration measured by LIDAR refers to aerosol
in equilibrium with environmental humidity, and it must be corrected by means of a proper
aerosol growth factor (McMurry & Stolzenburg, 1989) used together with the measured
relative humidity when the dry aerosol mass concentration (assimilable to the well known
PM10) is the final, required quantity. In cases of RH<80% the wet and dry aerosol mass
concentrations coincide, at least for monitoring purposes.
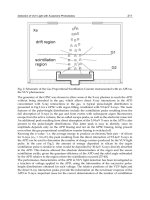
3. The instrument
3.1 Overview
The system (Fig.1) is basically composed of a modulated laser source and a receiving
system. The backscattered light coming from different ranges is focused on different pixels
of a photodiode array. The signal from the photodiodes is amplified, filtered and
demodulated by means of lock-in electronics. The final DC voltage is acquired and stored in
a microcontroller board. The microcontroller communicates with the external PC, and also
manages meteorological and ancillary sensors. A description of the different components
follows.
Telemetric LIDAR specifications
Laser 532 nm, 100 mW, 620 Hz modulation
Telescope Ø 80 mm, f=300 mm
Laser-telescope Distance 0.5 m
Interference Filter BW 10 nm
Photodiode (pixel) size 0.9 x 1.45 mm
Photodiode Preamp Gain 1E7 V/A
Lock-in 0.12 Hz BW, 1E6 Gain
3.2 Laser
The laser is a commercial, low-cost solid-state CW Nd-YAG laser, operating in the green,
and equipped with on/off 620 Hz modulation. The laser modulation is obtained by means
of a 620Hz quartz oscillator provided with two outputs: the first output drives the laser,
while the second is the reference signal to the Lock-in. The delay between the two outputs is
adjusted in order to nullify the lag between the TTL modulation of the laser and the effective
modulation of the laser emission.
A Photodiode-Based, Low-Cost Telemetric- Lidar
for the Continuous Monitoring of Urban Particulate Matter
123
Fig. 1. Schematic of the telemetric-LIDAR
3.3 Receiver optics
The receiver is a refractive telescope equipped with a lens of 300 mm focal length, 80 mm
diameter (NA= 3.75). The light cone produced by the lens has a semi-aperture of 8°. The
cone crosses an interference filter in order to reduce the background light received by the
photodiodes . The broad bandwidth (10 nm) of the interference filter permits the passage of
the whole cone of light from the lens without consistent losses, as shown in Fig.2.
The instrument focuses on the photodiode array the light backscattered by air volumes
located at distances of between 10 and 100 m, illuminated by a laser beam which is
displaced with respect to the optical axis of the telescope. The focusing of the telescope at
different distances thus moves along both the telescope axis and off-axis. In order to have all
the pixels of the photodiode array on the focus of the telescope for all distances, the array
was tilted by 67° with respect to the telescope axis. Fig.3 shows the simulated displacements
of the focus at different measurement distances with respect to the focus at infinity f
∞
=(0,0).
A field diaphragm was obtained by gluing a 0.5 mm linear slit directly onto the photodiode
array window. In this way, the FOV of the telescope was reduced to
2 mrad in the direction
perpendicular to the telemeter plane. The photodiode physical width (0.9 mm) defines the
FOV (
4 mrad) in the direction parallel to the telemetric plane.
Photodiodes – Communications, Bio-Sensings, Measurements and High-Energy Physics
124
Fig. 2. Interference filter relative transmission for off-axis rays. The aperture of the light cone
of the telescope is highlighted
Fig. 3. On-axis and off-axis displacement of the focus for different observation distances
3.4 Measurement range and range resolution
The measurement distance is determined by the angle between the observation direction
and the laser beam direction. In this way, by selecting a particular pixel of the array it is
possible to receive the light backscattered from distances comprised between 5 and 100
meters. In the configuration described, the field depth (2 x dz) of the instrument is a function
of the nominal distance of the measuring volume, as in Fig.4.
As shown in the simulations of Fig. 5, the range resolution of this instrument is similar to or
better than that of an ordinary LIDAR for distances below 50 meters. However, it becomes
practically useless at distances greater than 80-100 m.
A Photodiode-Based, Low-Cost Telemetric- Lidar
for the Continuous Monitoring of Urban Particulate Matter
125
Fig. 4. Field depth calculation
Fig. 5. Field-depth at different measurement distances
3.5 Photodiode and preamplifier
The detector chosen was a 16-element array of silicon photodiodes (Hamamatsu) S4114-
16Q. Each pixel is used in photovoltaic mode and preamplified by means of a (Analog
Devices) AD743 OPAMP. An ordinary photodiode was chosen for this application for the
following reasons:
1.
The application is a low frequency one: in this case, ordinary photodiodes are superior
to APDs because, since their S/N in the dark is limited by thermal noise, this quantity
can be simply increased by increasing the feedback resistor of the preamplifier. I.e. the
dark noise expected from a Hamamatsu APD S5344+AD743 was found to be 2.5E-6
V/√Hz @625Hz, more than 6 times greater than the noise of the S4114+AD743 (Fig.6), if
we assume the overall gain, wavelength and operating frequency to be the same.
2.
This rugged application requires a constant gain with temperature. This condition is
easily obtained by means of a photodiode in photovoltaic mode, while APDs always
require a thermal stabilization.
Photodiodes – Communications, Bio-Sensings, Measurements and High-Energy Physics
126
Photodiode array characteristics (S4114-16)
Sensitivity 0.35 A/W @ 532 nm
Pixel size 1.45 * 0.9 mm
Dark current 5 pA
Shunt resistance 250 GΩ
Terminal capacity 200 pF
Rise time 0.5 μs
Operating mode photovoltaic
Opamp characteristics (OPA743)
input noise voltage 4.5E-9
input noise current 2.5E-15
Feedback resistor (thin film Ni Barrier) 10E6 MΩ
Noise Index of Feedback resistor -20 dB
Feedback Capacity 2.7 pF
Operating temperature 25°C
Bandwidth (-3dB) 3kHz
The correct choice of the components made it possible to limit the dark noise of the
photodiode-preamplifier system to the thermal noise of the amplifier feedback resistor
(Graeme, 1996). In Fig.6, the different contributions to noise are shown as a function of the
frequency.
Fig. 6. The noise components of the photodiode-preamplifier as simulated with MATLAB.
Yellow line= operating frequency
3.6 Selective filter
The preamplified photodiode pixels are multiplexed into the (unique) lock-in electronics.
The choice of the active pixel and thus of the measurement distance is made via software.
The multiplexer (MUX) output is the input of a tuned preamplifier that is used to pre-filter
A Photodiode-Based, Low-Cost Telemetric- Lidar
for the Continuous Monitoring of Urban Particulate Matter
127
the signal for the lock-in board. The selective filter, together with the optical filtering
provided by the interference filter, contributes to the reduction of the noise received by the
system during daylight operation.
The selective amplifier, which is based on an OPAMP gyrator (Fig.7), provides a narrow-
band pass filtering (2.4 Hz (-3 dB) Bandwidth, Gain=5000) of the signal received, that is
centered around the 620 Hz modulation frequency. Thanks to an appropriate choice of the
passive components, the adopted circuit (Fig.7) was found to be stable with temperature,
with a drift of the resonant frequency of less than 0.065 Hz/°C in the temperature range of
-25°/+50°C, and a corresponding gain drift of less than 0.05 dB/°C. The phase shift is
practically zero in the same temperature range.
Fig. 7. Schematic of the selective amplifier
3.7 Lock-in
An analog lock-in (Horowitz, 1989), tuned to the modulation frequency (620 Hz), is used to
convert the AC signal in phase with the modulating signal into a DC voltage. This lock-in is
based on a AD630 modulator-demodulator chip followed by a Sallen-Key, II order active
low-pass filter with 0.1 Hz bandwidth and Gain=10. The active filter is followed by a final
amplifier with gain=10, and low-pass cutoff of 1 Hz. The final output of the lock-in circuitry
is limited to 0-5V in order to match the voltage span of the microcontroller AD inputs.
The step response at the output of the lock-in is shown in Fig.8. It is possible to sample the
output 100 msec after the application of the step. The sampling rate of the lock-in output by
means of the microcontroller board was thus set at 20 Hz.
3.8 Microcontroller board
The microcontroller board, which controls the whole instrument and acquires the telemetric
LIDAR signals, is based on a Microchip PIC18F6720, that is programmed in PicBasicPro. The
board manages the whole instrument by converting and averaging the lock-in output, and
Photodiodes – Communications, Bio-Sensings, Measurements and High-Energy Physics
128
acquiring meteo and house-keeping data. The board communicates with the PC via RS232,
allowing a 20 meters distance between the instrument and the PC. Data are both logged and
sent to the remote PC. The same serial line link is used to change the micro controller
firmware and to change the measurement settings.
Fig. 8. Step response at the output of the Lock-in
4. Testing the instrument
4.1 Indoor test: signal to noise
MATLAB simulations of noise and signal as expected at the end of the whole chain in
conditions of clear atmosphere and in day/night conditions were performed for different
operating conditions and distances, as shown in Fig 9. For daylight simulations we assumed
a Sun elevation of 30° and a pure molecular atmosphere. In these conditions the sky
irradiance observed by the telescope was calculated by assuming pure Rayleigh scattering.
Fig. 9. Clean-air signal and noise as expected from the MATLAB simulations
A Photodiode-Based, Low-Cost Telemetric- Lidar
for the Continuous Monitoring of Urban Particulate Matter
129
In the case of nighttime operation, the dark noise of the system was considered. An output
average power of 50mW for the laser source, a transmission of 0.7 for the interference filter
and an overall optical efficiency of 0.6 for the rest of the optics were assumed.
In the prototype, the measurement of the noise at the output of the complete chain in the
dark was 160 mV rms, close to the simulated dark noise in Fig. 9. The different photodiodes
showed slight differences in terms of dark noise.
From simulations a S/N>4 was found in daylight conditions for any distance. In practice,
when operating the instrument in the atmosphere, a S/N close to 1 was obtained in daylight
conditions at the output of the chain. An empirical integration time of 5 minutes was thus
chosen for operating the instrument in daytime with a S/N>4.
4.2 Indoor test: inter-calibration of the photodiode outputs
Four pixels of the photodiode array were selected for routine measurements. The pixels
corresponded to the following measurement ranges: CH1: 9÷12 m, CH2: 16÷30 m, CH3:
30÷56 m, and CH4: 60÷160 m. The system outputs for these four channels require a cross-
calibration because the four measurement volumes are different. The calibration was easily
performed by running the instrument horizontally-oriented, and by assuming an
homogeneous aerosol loading along the horizontal direction within 100-200 meters from the
instrument. The DC offset of each channel is first measured by shutting the laser off, via
software. The four channels were thus cyclically measured. After a few days of
measurement, the output of the four channels was plotted against a reference channel
(CH1). The linear fit of the three scatter plots CH2-CH1, CH3-CH1, and CH4-CH1 provides
the inter-calibration constants as shown in Fig.10. By using these constants, the output of all
the four channels became proportional to the volume backscatter by the same factor.
Fig. 10. Scatter plot used for the inter-calibration of the four channels (left) and the same plot
after renormalization of the channels.
4.3 Outdoor test in Prato (Italy)
A first prototype of telemetric-LIDAR was first used in a field campaign in Prato (Italy)
during the September-October 2005 period. The instrument was installed on the roof of a
conventional ARPAT (Agenzia Regionale Ambiente Toscana) monitoring station equipped
with a MP101M (Environment S.A.) beta attenuation PM10 instrument. The telemetric-
Photodiodes – Communications, Bio-Sensings, Measurements and High-Energy Physics
130
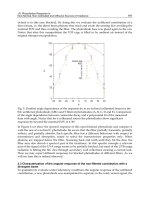
LIDAR instrument operated 30° above the horizon. Data obtained every 5 minutes for a
fixed measurement altitude of 6(±1) meters were compared with the hourly beta-attenuation
PM10 data (Fig. 11). The calibration of the telemetric LIDAR output in terms of PM10 was
obtained from a linear regression between the hourly-averages of the LIDAR signal and the
beta-attenuation data.
Fig. 11. Comparison between LIDAR-derived and β-attenuation PM10 data (Prato, Italy).
Relative humidity is also plotted
The comparison of the two time series shows a general agreement even if some peaks are
uncorrelated. On 2-5 October rain events occurred, a fact which explains the overestimation
of PM in the LIDAR data. LIDAR measured the wet PM, which in this case was larger than
the dry PM measured by the MP101M instrument. On the other hand, in the case of high RH
the sampling head of the MP101M cut out the large water droplets, thus leading to an
underestimate the PM concentration. Furthermore, the beta attenuation instrument is not
reliable when used with integration times as short as one hour.
4.4 Outdoor measurements in Florence (Italy)
A second, rugged prototype for fully outdoor operation was developed in 2005. In this
prototype, the window of the telescope was equipped with two optical sensors that were
developed at IFAC CNR: one sensor detected, from inside the box, the dust-cover of the
external face of the optical window. This is an important measurement in the urban
environment, because sooty/oily particles tend to stick rapidly onto the window, thus
increasing the optical losses of the instrument and spoiling the calibration. The other sensor
detected dew forming on the optical window in the case of foggy weather. Data from both
sensors were managed and stored together with the other data. The Telemetric LIDAR was
equipped with a GPS-GSRM-GPS module for the remote transmission of data and alarms. In
the case of a dirty or wet window, an alarm message was automatically sent to IFAC via E-
mail and SMS. The new prototype was also equipped with a laser power sensor for the