Photodiodes Communications Bio Sensings Measurements and High Energy Part 9 ppt
Bạn đang xem bản rút gọn của tài liệu. Xem và tải ngay bản đầy đủ của tài liệu tại đây (1.36 MB, 20 trang )
The Photodiode Array: A Critical Cornerstone in Cardiac Optical Mapping
151
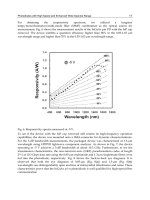
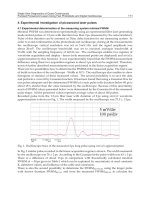
Fig. 6. APD and Ca
i
T-D during normal perfusion and into ischemia. Scales to the right
indicate the color of a given APD or Ca
i
T-D. (reproduced with permission from Lakireddy et al.,
2005).
Photodiodes – Communications, Bio-Sensings, Measurements and High-Energy Physics
152
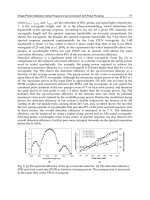
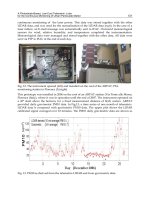
Fig. 7. Concealed spontaneous calcium oscillations (S-CaOs). Recordings were obtained
from an experiment in which localized S-CaOs developed during an episode of self-
terminating VF and continued uninterrupted after the resumption of spontaneous cardiac
rhythm. Panel I illustrates the initiation of VF. Panel II shows recordings from three
representative pixels (marked by different colors in the map of the optical field, seen to the
right of the traces). After the self-termination of VF (at approximately 12 seconds), the
majority of the optical field showed a pause with no electrical activity (trace C of panel II),
while the localized S-CaOs continued. (reproduced with permission from Lakireddy et al., 2006).
considered when interpreting intramural data (El-Sherif, 2007). Photodiodes have played a
dominant role in the construction of optrodes (Caldwell et al., 2005; Kong et al., 2007; Byars
et al., 2003).
Several groups have recently begun to use multiple cameras to simultaneously interrogate
opposing sides of the ventricular wall (Evertson et al., 2008; Kay & Rogers, 2006; Kay et al.,
2004; Kay et al., 2006; Rogers et al., 2007). In addition, some of these groups use additional
cameras to recreate the geometry of the heart in order to properly orient optical maps from
several cameras on the epicardial surface (Kay et al., 2004; Evertson et al., 2008). Most
Panoramic optical mapping systems are based on CCD technology, however systems have
also been built using multiple PDAs (Qu et al., 2007). Panoramic optical mapping does not
address the problem of lost depth information, but does provide a significant improvement
over traditional optical mapping which only maps a limited region on the epicardial surface.
The Photodiode Array: A Critical Cornerstone in Cardiac Optical Mapping
153
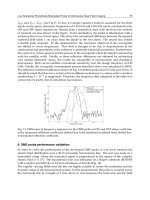
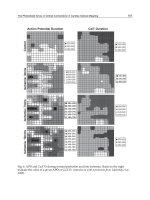
Fig. 8. Calcium oscillations confined to a site within the mapping field. The top, middle, and
bottom traces show recordings from the red, green, and blue regions of the mapping field,
respectively. The top trace shows regular calcium oscillations driving V
m
. The middle trace
shows the presence of calcium oscillations which are significantly depressed with respect to
those in the top trace, and do not precede V
m
. The bottom row shows that the calcium
transients are being driven by voltage, implying that the calcium oscillations in the red
region of the map have failed to escape the red/green region of the map and propagate
through to the blue region. (reproduced with permission from Lakireddy et al., 2006).
The use of monolayer cell cultures in COM also represents an important advance, allowing
for highly controlled studies of basic conduction as well as studies to elucidate fundamental
arrhythmic mechanisms (Bub et al., 1998; Entcheva et al., 2000; Fast et al., 2000; Iravanian et
al., 2003; Tung & Cysyk, 2007). An appealing aspect of the cardiac monolayer is that it
allows us to study conduction in cardiac tissue without the complexity associated with the
three-dimensional whole-heart Langendorff model. Since the cardiac monolayer is
essentially two-dimensional (only tens of micrometers thick while being tens of millimeters
in diameter), the entire monolayer may be mapped; therefore data interpretation is not
complicated by the absence of missing depth information. And although the monolayer is
technically three-dimensional, typical optical mapping systems interrogate at sufficient
depths so that no information is lost beneath the surface (Ding et al., 2001). Despite being
similar to whole-heart mapping in many respects, the actual practice of monolayer mapping
Photodiodes – Communications, Bio-Sensings, Measurements and High-Energy Physics
154
carries with it significant challenges, and is in many respects more difficult than whole-heart
mapping (Entcheva & Bien, 2006).
5. Conclusion
Photodiodes have played an essential role in the development of the field of COM. They
were used in the earliest COM systems and continue to have widespread use today, both in
typical applications as well as more modern designs such as optrodes and panoramic
systems. Applications for photodiodes within COM continue to emerge, and will likely
remain a vital part of this important and ever-expanding branch of cardiac
electrophysiology research.
6. List of abbreviations
AP – action potential
AP-A – anthopleurin-A
APD – action potential duration
Ca
i
– intracellular calcium
Ca
i
T – intracellular calcium transient
Ca
i
T-D – intracellular calcium transient duration
CCD - charge-coupled device
CL – cycle length
CMOS - complimentary metal-oxide semiconductor
COM – cardiac optical mapping
GP – guinea pig
I/R – ischemia/reperfusion
LQTS – long QT syndrome
LQT3 – long QT syndrome 3
PB – premature beat
PDA - photodiode array
PMT - photomultiplier tube
TdP – Torsades de Pointes
VF – ventricular fibrillation
V
m
– transmembrane voltage
VT – ventricular tachycardia
7. References
Allison JS, Qin H, Dosdall DJ, Huang J, Newton JC, Allred JD, Smith WM, Ideker RE. The
transmural activation sequence in porcine and canine left ventricle is markedly
different during long-duration ventricular fibrillation. J Cardiovasc Electrophysiol
2007;18:1306-1312.
Al-Khadra A, Nikolski V, Efimov IR. The role of electroporation in defibrillation. Circ Res
2000;87:797-804.
Antzelevitch C. Role of spatial dispersion of repolarization in inherited and acquired
sudden cardiac death syndromes. Am J Physiol Heart Circ Physiol 2007;293:H2024–
H2038.
The Photodiode Array: A Critical Cornerstone in Cardiac Optical Mapping
155
Baker LC, Wolk R, Choi BR, Watkins S, Plan P, Shah A, Salama G. Effects of mechanical
uncouplers, diacetyl monoxime, and cytochalasin-D on the electrophysiology of
perfused mouse hearts. J Physiol Heart Circ Physiol 2004;287:H1771-H1779.
Baxter WT, Mirinov SF, Zaitsev AV, Jalife J, Pertsov AM. Visualizing excitation waves inside
cardiac muscle using transillumination. Biophys J 2001;80:516-530.
Berenfeld O, Pertsov AM, Jalife J. Letter to the editor: What is the organization of waves in
ventricular fibrillation. Circ Res 2001;89:e22.
Bers DM. Calcium and cardiac rhythms: physiological and pathophysiological. Circ Res
2002;90:14-17.
Biermann M, Rubart M, Moreno A, Wu J, Josiah-Durant A, Zipes DP. Differential effects of
cytochalasin D and 2,3 butanedione monoxime on isometric twitch force and
transmembrane action potential in isolated ventricular muscle: implications for
optical measurements of cardiac repolarization. J Cardiovasc Electrophysiol
1998;9:1348-1357.
Bub G, Glass L, Publicover NG, Shrier A. Bursting calcium rotors in cultured cardiac
myocyte monolayers. Proc Natl Acad Sci USA 1998;95:10283-10287.
Bub G, Shrier A, Glass L. Global organization of dynamics in oscillatory heterogeneous
excitable media. Physical Review Lett 2005;94:028105.
Byars JL, Smith WM, Ideker RE, Fast VG. Development of an optrode for intramural
multisite optical recordings of Vm in the heart. J Cardiovasc Electrophysiol
2003;14:1196-1202.
Cabo C, Pertsov AM, Baxter WT, Davidenko JM, Gray RA, Jalife J. Wave-front curvature as
a cause of slow conduction and block in isolated cardiac muscle. Circ Res
1994;75:1014-1028.
Caldwell J, Burton FL, Smith GL, Cobbe ST. Heterogeneity of ventricular fibrillation
dominant frequency during global ischemia in isolated rabbit hearts. J Cardiovasc
Electrophysiol 2007;18:854-861.
Caldwell BJ, Legrice IJ, Hooks DA, Tai D, Pullan AJ, Smaill BH. Intramural measurement of
transmembrane potential in the isolated pig heart: Validation of a novel technique.
J Cardiovasc Electrophysiol 2005;16:1001-1010.
Chen J, Mandapati R, Berenfeld O, Skanes AC, Jalife J. High-frequency periodic sources
underlie ventricular fibrillation in the isolated rabbit heart. Circ Res 2000;86:86-93.
Chen PS, Wu TJ, Ting CT, Karagueuzian HS, Garfinkel A, Lin SF, Weiss JN. A tale of two
fibrillations. Circulation 2003;108:2298-2303.
Cheng Y. Optical mapping of shock-induced arrhythmogenesis in the rabbit heart with
healed myocardial infarction: fluorescent imaging with a photodiode array.
Methods Mol Med 2006;129:149-61.
Choi BR, Burton F, Salama G. Cytosolic Ca2+ triggers early afterdepolarizations and torsade
de pointes in rabbit hearts with type 2 long QT syndrome. J Physiol 2002;543:615-631.
Choi BR, Hatton WJ, Hume JR, Liu T, Salama G. Low osmolarity transforms ventricular
fibrillation from complex to highly organized, with a dominant high-frequency
source. Heart Rhythm 2006;3:1210-1220.
Choi BR, Jang W, Salama G. Spatially discordant voltage alternans cause wavebreaks in
ventricular fibrillation. Heart Rhythm 2007; 4:1057–1068.
Choi BR, Liu T, Lavasani M, Salama G. Fiber orientation and cell-cell coupling influence
ventricular fibrillation dynamics. J Cardiovasc Electrophysiol 2003;14:851-860.
Choi BR, Salama G. Simultaneous maps of optical action potentials and calcium transients in
guineapig hearts: mechanisms underlying concordant alternans. J Physiol
2000;529:171-188.
Photodiodes – Communications, Bio-Sensings, Measurements and High-Energy Physics
156
Coraboeuf E, Weidmann S. Potentiels d’action du muscle obtenus à l’aide de
microélectrodes intracellulaires. Présence d’une inversion de potential. CR Soc Biol
(Paris) 1949;143:1360-1360.
Coraboeuf E, Weidmann S. Potentiels de repos et potentials d’action du muscle cardiaque,
mesurés á l’aide d’électrodes intracellulaires. CR Soc Biol (Paris) 1949; 143:1329-1331.
Draper MH, Weidmann S. Cardiac resting and action potentials recorded with an
intracellular electrode. J Physiol 1951;115:74-94.
Ding L; Splinter, R.; Knisley, S.B. Quantifying spatial localization of optical mapping using
Monte Carlo simulations. IEEE Trans Biomed Eng 2001;48:1098-1107.
Efimov IR, Ermentrout B, Huang DT, Salama G. Activation and repolarization patterns are
governed by different structural characteristics of ventricular myocardium:
Experimental study with voltage-sensitive dyes and numerical simulations. J
Cardiovasc Electrophysiol 1996;7:512-530.
El-Sherif N. The challenge of cardiac tridimensional mapping. Heart Rhythm 2007;4:1437-
1440.
El-Sherif N, Caref EB, Yin H, Restivo M. The electrophysiological mechanism of ventricular
arrhythmias in the long QT syndrome. Circ Res 1996;79:474-492.
Entcheva E, Bien H. Macroscopic optical mapping of excitation in cardiac cell networks with
ultra-high spatiotemporal resolution. Progress in Biophysics and Molecular Biology
2006;92:232–257.
Entcheva E, Lu SN, Troppman RH, Sharma V, Tung L. Contact fluorescence imaging of
reentry in monolayers of cultured neonatal rat ventricular myocytes. J Cardiovasc
Electrophysiol 2000;11:665-676.
Evertson DW, Holcomb MR, Eames MDC, Bray MA, Sidorov VY, Xu J, Wingard H,
Dobrovolny HM, Woods MC, Gauthier DJ, Wikswo JP. High-resolution high-speed
panoramic cardiac imaging system. IEEE Trans Biomed Eng 2008;55:1241-1243.
Fast VG. Simultaneous optical imaging of membrane potential and intracellular calcium. J
Electrocardiol 2005;38:107-112.
Fast VG, Ideker RE. Simultaneous optical mapping of transmembrane potential and intracellular
calcium in myocyte cultures. J Cardiovasc Electrophysiol 2000;11:547-556.
Fast VG, Sharifov OF, Cheek ER, Newton JC, Ideker RE. Intramural virtual electrodes
during defibrillation shocks in left ventricular wall assessed by optical mapping of
membrane potential. Circulation 2002;106:1007-1014.
Fedorov VV, Kostecki G, Hemphill M, Efimov IR. Atria are more susceptible to
electroporation than ventricles: Implications for atrial stunning, shock-induced
arrhythmia and defibrillation failure. Heart Rhythm 2008;5:593-604.
Fedorov VV, Lozinsky IT, Sosunov EA, Anyukhovsky EP, Rosen MR, Balke W, Efimov IR.
Application of blebbistatin as an excitation– contraction uncoupler for
electrophysiologic study of rat and rabbit hearts. Heart Rhythm 2007;4:619-626.
Girouard SD, Pastore JM, Laurita KR, Gregory KW, Rosenbaum DS. Optical mapping in a
new guinea pig model of ventricular tachycardia reveals mechanisms for multiple
wavelengths in a single reentrant circuit. Circulation 1996;93:603-613.
Gold MR, Bloomfield DM, MD, Anderson KP, El-Sherif N, Wilber DJ, Groh WJ, Estes M,
Kaufman ES, Greenberg ML, Rosenbaum DS. A comparison of T-wave alternans,
signal averaged electrocardiography and programmed ventricular stimulation for
arrhythmia risk stratification. JACC 2000;36:2247-2253.
Hayashi H, Miyauchi Y, Chou CC, Karagueuzian HS, Chen PS, Lin SF. Effects of
cytochalasin D on electrical restitution and the dynamics of ventricular fibrillation
in isolated rabbit heart. J Cardiovasc Electrophysiol 2003;14:1077-1084.
The Photodiode Array: A Critical Cornerstone in Cardiac Optical Mapping
157
Himel IV, HD, Bub G, Yue Y, and El-Sherif N. Early voltage/calcium uncoupling
predestinates the duration of ventricular tachyarrhythmias during
ischemia/reperfusion. Heart Rhythm 2009;6:1359-1365.
Himel IV, HD, Dumas JH, Kiser AC, Knisley SB. Translesion stimulus-excitation delay
indicates quality of linear lesions produced by radiofrequency ablation in rabbit
hearts. Physiol. Meas. 2007;28:611–623.
Himel IV, H.D., Knisley, S.B. Imaging of cardiac movement using ratiometric and
nonratiometric optical mapping: effects of ischemia and 2, 3-butaneodione
monoxime. IEEE Trans Med Imaging 2006;25:122-127.
Hohnloser SH, Klingenheben T, Li YG, Zabel M, Peetermans J, Cohen RJ. T wave alternans
as a predictor of recurrent ventricular tachyarrhythmias in ICD recipients:
Prospective comparison with conventional risk markers. J Cardiovasc
Electrophysiol 1998;9:1258-1268.
Hooks DA, LeGrice IJ, Harvey JD, Smaill BH. Intramural multisite recording of
transmembrane potential in the heart. Biophys J 2001;81:2671-2680.
Hyatt CJ, Mirinov SF, Vetter FJ, Zemlin CW, Pertsov AM. Optical Action Potential Upstroke
Morphology Reveals Near-Surface Transmural Propagation Direction. Circ Res
2005;97:277-284.
Ikeda T, Yoshino H, Sugi K, Tanno K, Shimizu H, Watanabe J, Kasamaki Y, Yoshida A, Kato
T. Predictive value of microvolt T-wave alternans for sudden cardiac death in
patients with preserved cardiac function after acute myocardial infarction. JACC
2006;48:2268-2274.
Iravanian S, Nabutovsky Y, Kong CR, Saha S, Bursac N, Tung L. Functional reentry in
cultured monolayers of neonatal rat cardiac cells. Am J Physiol Heart Circ Physiol
2003;285:H449–H456.
Jalife J, Berenfeld O, Skanes A, Mandapati R. Mechanisms of atrial fibrillation: mother rotors
or multiple daughter wavelets, or both? J Cardiovasc Electrophysiol 1998;9:S2-12.
Joel SE, Hsia PW. Discovery of gradient pattern in dominant frequency maps during
fibrillation: implication of rotor drift and epicardial conduction velocity changes. J
Electrocardiol 2005;38:159-165.
Jung P, Wang J, Wackerbauer R, Showalter K. Coherent structure analysis of spatiotemporal
chaos. Physical Review E 2000;61:2095-2098.
Kay MW, Amison PM, Rogers JM. Three-dimensional surface reconstruction and panoramic
optical mapping of large hearts. IEEE Trans Biomed Eng 2004;51:1219-1229.
Kay MW, Rogers JM. Epicardial rotors in panoramic optical maps of fibrillating swine
ventricles. Conf Proc IEEE Med Biol Soc 2006;1:2268-2271.
Kay MW, Walcott GP, Gladden JD, Melnick SB, Rogers JM. Lifetimes of epicardial rotors in
panoramic optical maps of fibrillating swine ventricles. Am J Physiol Heart Circ
Physiol 2006;291:1935-1941.
Knisley SB, Baynham T. Line stimulation parallel to myofibers enhances regional uniformity
of transmembrane voltage changes in rabbit hearts. Circ Res 1997;81:229-241.
Knisley SB, Hill BC. Effects of bipolar point and line stimulation in anisotropic rabbit
epicardium: assessment of the critical radius of curvature for longitudinal block.
IEEE Trans Biomed Eng 1995;42:957-966.
Knisley SB, Hill BC, Ideker RE. Virtual electrode effects in myocardial fibers. Biophys J
1994;66:719-728.
Knisley SB, Justice RK, Kong W, Johnson PL. Ratiometry of transmembrane voltage-
sensitive fluorescent dye emission in hearts. Am J Physiol Heart Circ Physiol 2000;
279: H1421–H1433.
Photodiodes – Communications, Bio-Sensings, Measurements and High-Energy Physics
158
Knisley SB, Trayanova N, Aguel F. Roles of electric field and fiber structure in cardiac
electric stimulation. Biophys J 1999;77:1404-1417.
Kong W, Fakhari N, Sharifov OF, Ideker RE, Smith WM, Fast VG. Optical measurements of
intramural action potentials in isolated porcine hearts using optrodes. Heart
Rhythm 2007;4:1430-1436.
Kong W, Walcott GP, Smith WM, Johnson PL, Knisley SB. Emission ratiometry for simultaneous
calcium and action potential measurements with coloaded dyes in rabbit hearts:
reduction of motion and drift. J Cardiovasc Electrophysiol 2003;14:76-82.
Lakireddy V, Baweja P, Syed A, Bub G, Boutjdir M, El-Sherif N. Contrasting effects of
ischemia on the kinetics of membrane voltage and intracellular calcium transient
underlie electrical alternans. Am J Physiol Heart Circ Physiol 2005; 288:400-407.
Lakireddy V, Bub G, Baweja P, Syed A, Boutjdir M, El-Sherif N. The kinetics of spontaneous
calcium oscillations and arrhythmogenesis in the in vivo heart during
ischemia/reperfusion. Heart Rhythm 2006;3:58-66.
Lan DZ, Pollard AE, Knisley SB. Optical mapping of Vm and Cai 2+ in a model of
arrhythmias induced by local catecholamine application in patterned cell cultures.
Eur J Physiol 2007;453:871–877.
Laurita KR, Singal A. Mapping action potentials and calcium transients simultaneously
from the intact heart. Am J Physiol Heart Circ Physiol 2001;280: H2053–H2060.
Lee JJ, Kamjoo K, Hough D, Hwang C, Fan W, Fishbein MC, Bonometti C, Ikeda T,
Karagueuzian HS, Chen PS. Reentrant wave fronts in wiggers' stage II ventricular
fibrillation. Circ Res 1996;78:660-675.
Lee MH, Lin SF, Ohara T, Omichi C, Okuyama Y, Chudin E, Garfinkel A, Weiss JN,
Karagueuzian HS, Chen PS. Effects of diacetyl monoxime and cytochalasin D on
ventricular fibrillation in swine right ventricles. Am J Physiol Heart Circ Physiol
2001;280: H2689–H2696.
Li D, Nattel S. Pharmacological elimination of motion artifacts during optical imaging of
cardiac tissues: Is blebbistatin the answer? Heart Rhythm 2007;4:627-628.
Li L, Jin Q, Huang J, Cheng KA, Ideker RE. Intramural foci during long duration fibrillation
in the pig ventricle. Circ Res 2008;102:1256-1264.
Liu YB, Pak HN, Lamp ST, Okuyama Y, Hayashi H, Wu TJ, Weiss JN, Chen PS, Lin SF.
Coexistence of two types of ventricular fibrillation during acute regional ischemia
in rabbit ventricle. J Cardiovasc Electrophysiol 2004;15:1433-1440.
Marban E, Kitakaze M, Koretsune Y, Yue DT, Chacko VP, Pike MM. Quantification of
[Ca2+]
i
in perfused hearts: critical evaluation of the 5F-BAPTA and nuclear
magnetic resonance method as applied to the study of ischemia and reperfusion.
Circ Res 1990;66:1255-1267.
Matiukas A, Mitrea BG, Pertsov AM, Wuskell JP, Wei M, Watras J, Millard AC, Loew LM.
New near-infrared optical probes of cardiac electrical activity. Am J Physiol Heart
Circ Physiol 2006;290: H2633–H2643.
Matiukas, A, Mitrea BG, Qin M, Pertsov AM, Shvedko AG, Warren MD, Zaitsev AV,
Wuskell JP, Wei M, Watras J, Loew LM. Near-infrared voltage-sensitive fluorescent
dyes optimized for optical mapping in blood-perfused myocardium. Heart Rhythm
2007;4:1441-1451.
Milberg P, Reinsch P, Wasmer K, Mönnig G, Stypmann P, Osada N, Breithardt G, Haverkamp
W, Eckardt L. Transmural dispersion of repolarization as a key factor of
arrhythmogenicity in a novel intact heart model of LQT3. Circ Res 2005;65:397-404.
Moe GK. On the multiple wavelet hypothesis of atrial fibrillation. Arch Int Pharmacodyn
Ther 1962;140:183–188.
The Photodiode Array: A Critical Cornerstone in Cardiac Optical Mapping
159
Morad M, Dillon S. A new laser scanning system for measuring action potential propagation
in the heart. Science 1981; 214:453-456.
Morad M, Salama G. Optical probes of membrane potential in heart muscle. J Physiol
1979;292:267-295.
Moreno J, Zaitsev AV, Warren M, Berenfeld O, Kalifa J, Lucca E, Mironov S, Guha P, Jalife J.
Effect of remodelling, stretch and ischaemia on ventricular fibrillation frequency
and dynamics in a heart failure model. Cardiovasc Res 2005;65:158-166.
Nash MP, Mourad A, Clayton RH, Sutton PM, Bradley CP, Hayward M, Paterson DJ,
Taggart P. Evidence for multiple mechanisms in human ventricular fibrillation.
Circulation 2006;114:536-542.
Neunlist M, Tung L. Spatial distribution of cardiac transmembrane potentials around an
extracellular electrode: Dependence on fiber orientation. Biophys J 1995;68:2310-2322.
Omichi C, Lamp ST, Lin SF, Yang J, Baher A, Zhou S, Attin M, Lee MH, Karagueuzian HS,
Kogan B, Qu Z, Garfinkel A, Chen PS, Weiss JN. Intracellular Ca dynamics in
ventricular fibrillation. Am J Physiol Heart Circ Physiol 2004;286: H1836–H1844.
Pastore JM, Girouard SD, Laurita KR, Akar FG, Rosenbaum DS. Mechanism linking T-wave
alternans to the genesis of cardiac fibrillation. Circulation 1999;99:1385-1394.
Perez FJ, Wood MA, Schubert CM. Effects of gap geometry on conduction through
discontinuous radiofrequency lesions. Circulation 2006;113:1723-1729.
Pham Q, Quan KJ, Rosenbaum DS. T-wave alternans: marker, mechanism, and
methodology for predicting sudden cardiac death. J Electrocardiol 2003;36:75-81.
Pruvot EJ, Katra RP, Rosenbaum DS, Laurita KR. Role of calcium cycling versus restitution
in the mechanism of repolarization alternans. Circ Res 2004;94:1083-1090.
Qu F, Ripplinger CM, Nikolski VP, Grimm C, Efimov IR. Three-dimensional panoramic
imaging of cardiac arrhythmias in rabbit heart. J Biomed Opt. 2007;12:044019.
Rashba EJ, Osman AF, Macmurdy K, Kirk MM, Sarang SE, Peters RW, Shorofsky SR, Gold
MR. Enhanced detection of arrhythmia vulnerability using T wave alternans, left
ventricular ejection fraction, and programmed ventricular stimulation: A
prospective study in subjects with chronic ischemic heart disease. J Cardiovasc
Electrophysiol 2004;15:170-176.
Rogers JM, Huang J, Smith WM, Ideker RE. Incidence, evolution, and spatial distribution of
functional reentry during ventricular fibrillation in pigs. Circ Res 1999;84:945-954.
Rogers JM, Walcott GP, Gladden JD, Melnick SB, Kay MW. Panoramic optical mapping
reveals continuous epicardial reentry during ventricular fibrillation in the isolated
swine heart. Biophys J 2007;92:1090-1095.
Rosenbaum DS, Jackson LE, Smith JM, Garan H, Ruskin JN, Cohen RJ. Electrical alternans
and vulnerability to ventricular arrhythmias. N Engl J Med 1994;330:235-241.
Sakai T. Optical mapping analysis of the spatiotemporal pattern of experimental
tachyarrhythmia in improved isolated rat atrium preparation. J Physiol Sci
2008;58:87-97.
Salama G. Merocyanine 540 as an optical probe of transmembrane electrical activity in the
heart. Science 1976;191:485-487.
Salama G, Choi BR, Azour G, Lavasani M, Tumbev V, Salzberg BM, Patrick MJ, Ernst LA,
Waggoner AS. Properties of new, long-wavelength, voltage-sensitive dyes in the
heart. J. Membrane Biol 2005;208:125–140.
Salama G, Hwang SM. Simultaneous optical mapping of intracellular free calcium and
action potentials from langendorff perfused hearts. Curr Protoc Cytom 2009;
Chapter 12: Unit 12.17.
Photodiodes – Communications, Bio-Sensings, Measurements and High-Energy Physics
160
Sano T, Ohtsuka E, Shimamoto T. “Unidirectional” atrioventricular conduction studied by
microelectrodes. Circ Res 1960;8:600-608.
Sano T, Takayama N, Shimamoto T. Directional difference of conduction velocity in the
cardiac ventricular syncytium studied by microelectrodes. Circ Res 1959;7:262-267.
Scherz P. Practical Electronics for inventors. Second edition. New York, NY: McGraw-Hill; 2007.
Shabetai R, Surawicz B, Hammill W. Monophasic Action Potentials in Man. Circulation
1968;38:341-352.
Shimizu W, Antzelevitch C. Sodium channel block with mexiletine is effective in reducing
dispersion of repolarization and preventing torsade de pointes in LQT2 and LQT3
models of the long-QT syndrome. Circulation 1997;96:2038-2047.
Steenbergen C, Murphy E, Levy L, London RE. Elevation in cytosolic free calcium
concentration early in myocardial ischemia in perfused rat heart. Circ Res
1987;60:700-707.
Tung L, Cysyk J. Imaging fibrillation: defibrillation in a dish. J Electrocardiol 2007;40:S62-S65.
Tung L, Zhang Y. Optical imaging of arrhythmias in tissue culture. J Electrocardiol
2006;39:S2-S6.
Valderrábano M, Lee MH, Ohara T, Lai AC, Fishbein MC, Lin SF, Karagueuzian HS, Chen
PS. Dynamics of intramural and transmural reentry during ventricular fibrillation
in isolated swine ventricles. Circ Res 2001;88:839-848.
Valderrábano M, Yang J, Omichi C, Kil J, Lamp ST, Qu Z, Lin SF, Karagueuzian HS,
Garfinkel A, Chen PS, Weiss JN. Frequency analysis of ventricular fibrillation in
swine ventricles. Circ Res 2002;90:213-222.
Weidmann, S. Effect of current flow on the membrane potential of cardiac muscle. J Physiol
1951;115:227-236.
Wu J, Biermann M, Rubart M, Zipes DP. Cytochalasin D as excitation-contraction uncoupler
for optically mapping action potentials in wedges of ventricular myocardium. J
Cardiovasc Electrophysiol 1998;9:1336-1347.
Wu S, Weiss JN, Chou CC, Attin M, Hayashi H, Lin SF. Dissociation of membrane potential
and intracellular calcium during ventricular fibrillation. J Cardiovasc
Electrophysiol 2005;16:186-192.
Wu TJ, Lin SF, Baher A, Qu Z, Garfinkel A, Weiss JN, Ting CT, Chen PS. Mother rotors and
the mechanisms of D600-induced type 2 ventricular fibrillation. Circulation
2004;110:2110-2118.
Wu TJ, Lin SF, Hsieh YC, Ting CT, Chen PS. Ventricular fibrillation during no-flow global
ischemia in isolated rabbit hearts. J Cardiovasc Electrophysiol 2006;17:1112-1120.
Zaitsev AV, Guha PK, Sarmast F, Kolli A, Berenfeld O, Pertsov AM, de Groot JR, Coronel R,
Jalife J. Wavebreak formation during ventricular fibrillation in the isolated,
regionally ischemic pig heart. Circ Res 2003;92:546-553.
Wu TJ, Lin SF, Weiss JN, Ting CT and Chen PS. Two types of ventricular fibrillation in
isolated rabbit hearts: Importance of excitability and action potential duration
restitution. Circulation 2002;106:1859-1866.
Zaitsev AV, Berenfeld O, Mirinov SF, Jalife J, Pertsov AM. Distribution of excitation
frequencies on the epicardial and endocardial surfaces of fibrillating ventricular
wall of the sheep heart. Circ Res 2000;86:408-417.
Zemlin CW, Bernus O, Matiukas A, Hyatt CJ, Pertsov AM. Extracting intramural wavefront
orientation from optical upstroke shapes in whole hearts. Biophys J 2008;95:942-950.
9
Photodiode Array Detection in Clinical
Applications; Quantitative Analyte Assay
Advantages, Limitations and Disadvantages
Zarrin Es’haghi
Department of Chemistry, Payame Noor University, 19395-4697 Tehran,
I.R. of IRAN
1. Introduction
1.1 Optical spectroscopy
Study of the electromagnetic radiation by matter, as related to the dependence of these
processes on the wavelength of the radiation. More recently, the definition has been
expanded to include the study of the interactions between particles such as electrons,
protons, and ions, as well as their interaction with other particles as a function of their
collision energy. Spectroscopic analysis has been crucial in the development of the most
fundamental theories in physics, including quantum mechanics, the special and general
theories of relativity, and quantum electrodynamics.
Spectroscopic techniques have been applied in virtually all technical fields of science and
technology. One of the most famous kinds of spectroscopy, optical spectroscopy is used
routinely to identify the chemical composition of matter and to determine its physical
structure.Spectroscopic techniques are extremely sensitive. Single atoms and even different
isotopes of the same atom can be detected among 10
20
or more atoms of a different species.
Isotopes are all atoms of an element that have unequal mass but the same atomic number.
Isotopes of the same element are virtually identical chemically. Trace amounts of pollutants
or contaminants are often detected most effectively by spectroscopic techniques. Because of
this sensitivity, the most accurate physical measurements have been frequency
measurements.
Spectroscopy now covers a sizable fraction of the electromagnetic spectrum. The table (1)
summarizes the electromagnetic spectrum over a frequency range of 16 orders of magnitude.
Spectroscopic techniques are not confined to electromagnetic radiation, however. Because the
energy E of a photon (a quantum of light) is related to its frequency ν by the relation E = hν,
where h is Planck’s constant, spectroscopy is actually the measure of the interaction of photons
with matter as a function of the photon energy. In instances where the probe particle is not a
photon, spectroscopy refers to the measurement of how the particle interacts with the test
particle or material as a function of the energy of the probe particle.
Electromagnetic radiation is composed of oscillating electric and magnetic fields that have
the ability to transfer energy through space. The energy propagates as a wave, such that the
crests and troughs of the wave move in vacuum at the speed of 299,792,458 metres per
second.
Photodiodes – Communications, Bio-Sensings, Measurements and High-Energy Physics
162
Electromagnetic phenomena
Gamma rays
(γ rays)
<5 × 10
−12
>6 × 10
19
X-rays 5 × 10
−12
–1 × 10
−8
3 × 10
16
–6 × 10
19
Ultraviolet 1 × 10
−8
–4 × 10
−7
7 × 10
14
–3 × 10
16
Visible light 4 × 10
−7
–7 × 10
−7
4 × 10
14
–7 × 10
14
Infrared 8 × 10
−7
–1 × 10
−3
3 × 10
11
–4 × 10
14
Microwaves, Radar 1 × 10
−3
–1 3 × 10
8
–3 × 10
11
Television waves 1–10 3 × 10
7
–3 × 10
8
Radio waves 10–1,000 3 × 10
5
–3 × 10
7
Table 1. Frequency and wavelength domain of electromagnetic radiations
The decomposition of electromagnetic radiation into its component wavelengths is
fundamental to spectroscopy. Evolving from the first crude prism spectrographs that
separated white light into its constituent colours, modern spectrometers have provided
ever-increasing wavelength resolution. Large-grating spectrometers are capable of resolving
wavelengths as close as 10
−3
nanometre, while modern laser techniques can resolve optical
wavelengths separated by less than 10
−10
nanometre. The frequency with which the
electromagnetic wave oscillates is also used to characterize the radiation. The product of the
frequency (ν) and the wavelength (λ) is equal to the speed of light (c); i.e., νλ = c. The
frequency is often expressed as the number of oscillations per second, and the unit of
frequency is hertz (Hz), where one hertz is one cycle per second.
Spectroscopy is used as a tool for studying the structures of atoms and molecules. The large
number of wavelengths emitted by these systems makes it possible to investigate their
structures in detail, including the electron configurations of ground and various excited states.
Spectroscopy also provides a precise analytical method for finding the constituents in
material having unknown chemical composition. In a typical spectroscopic analysis, a
concentration of a few parts per million of a trace element in a material can be detected
through its emission spectrum.
Production and analysis of a spectrum usually require the following: (1) a source of
electromagnetic radiation, (2) a disperser to separate the light into its component
wavelengths, and (3) a detector to sense the presence of light after dispersion (See Figure 1).
The apparatus used to accept light, separate it into its component wavelengths, and detect
the spectrum is called a spectrometer. Spectra can be obtained either in the form of emission
spectra, which show one or more bright lines or bands on a dark background, or absorption
spectra, which have a continuously bright background except for one or more dark lines.
1.1.1 Optical detectors
The principal detection methods used in optical spectroscopy are photographic (e.g., film),
photoemissive (photomultipliers), and photoconductive (semiconductor). Prior to about
1940, most spectra were recorded with photographic plates or film, in which the film is
placed at the image point of a grating or prism spectrometer. An advantage of this technique
is that the entire spectrum of interest can be obtained simultaneously, and low-intensity
spectra can be easily taken with sensitive film.
Photodiode Array Detection in Clinical Applications;
Quantitative Analyte Assay Advantages, Limitations and Disadvantages
163
Fig. 1. Components of Optical Instruments. The generic spectrometer, (a) Molecular
absorption , (b) Molecular emission and (c) Atomic absorption
Photoemissive detectors have replaced photographic plates in most applications. When a
photon with sufficient energy strikes a surface, it can cause the ejection of an electron from the
surface into a vacuum. A photoemissive diode consists of a surface (photocathode)
appropriately treated to permit the ejection of electrons by low-energy photons and a separate
electrode (the anode) on which electrons are collected, both sealed within an evacuated glass
envelope. A photomultiplier tube has a cathode, a series of electrodes (dynodes), and an anode
sealed within a common evacuated envelope. Appropriate voltages applied to the cathode,
dynodes, and anode cause electrons ejected from the cathode to collide with the dynodes in
succession. Each electron collision produces several more electrons; after a dozen or more
dynodes, a single electron ejected by one photon can be converted into a fast pulse (with a
duration of less than 10
−8
second) of as many as 10
7
electrons at the anode. In this way,
individual photons can be counted with good time resolution.
Other photodetectors include imaging tubes (e.g., television cameras), which can measure a
spatial variation of the light across the surface of the photocathode, and microchannel
plates, which combine the spatial resolution of an imaging tube with the light sensitivity of a
photomultiplier. A night vision device consists of a microchannel plate multiplier in which
the electrons at the output are directed onto a phosphor screen and can then be read out
with an imaging tube.
Photodiodes – Communications, Bio-Sensings, Measurements and High-Energy Physics
164
Solid-state detectors such as semiconductor photodiodes detect light by causing photons to
excite electrons from immobile, bound states of the semiconductor (the valence band) to a
state where the electrons are mobile (the conduction band). The mobile electrons in the
conduction band and the vacancies, or “holes,” in the valence band can be moved through
the solid with externally applied electric fields, collected onto a metal electrode, and sensed
as a photoinduced current. Microfabrication techniques developed for the integrated-circuit
semiconductor industry are used to construct large arrays of individual photodiodes closely
spaced together. The device, called a charge-coupled device (CCD), permits the charges that
are collected by the individual diodes to be read out separately and displayed as an image.
1.1.2 Multichannel detectors
Multichannel detectors can be used to sense optical and ionizing radiation or convert to an
electrical signal an incoming chemical, physical, mechanical, or thermal stimulus. In other
words; multichannel detector, can measure all wavelengths dispersed by a dispersing
elemnt simultaneously.
The multichannel detector employs a light source that emits light over a wide range of
wavelengths. Employing an appropriate optical system (a prism or diffraction grating), light
of a specific wavelength can be selected for detection purposes. The specific wavelength
might be chosen where a solute has an absorption maximum to provide maximum
sensitivity. Alternatively, the absorption spectra of an eluted substances could be obtained
for identification purposes by scanning over a range of wavelengths. The latter procedure,
however, differs with the type of multichannel detector being used.
There are two basic types of multi–wavelength detector, the dispersion detector and the diode
array detector, the latter being the more popular. In fact, very few dispersion instruments are
sold today but many are still used in the field and so their characteristics will be discussed.
All multichannel detectors require a broad emission light source such as deuterium or the
xenon lamp, the deuterium lamp being the most popular.
The two types of multichannel detectors have important differences. In the dispersive
instrument, the light is dispersed before it enters the sensor cell and thus virtually
monochromatic light passes through the cell. However, if the incident light is of a
wavelength that can excite the solute and cause fluorescence at another wavelength, then
the light falling on the photo cell will contain the incident light together with any fluorescent
light that may have been generated. It follows, that the light monitored by the photocell may
not be monochromatic and light of another wavelength, if present, would impair the linear
nature of the response. This effect would be negligible in most cases but with certain
fluorescent materials the effect could be significant. The diode array detector operates quite
a differently. Light of all wavelengths generated by the deuterium lamp is passed through the
cell and then dispersed over an array of diodes. Thus, the absorption at discrete groups of
wavelengths is continuously monitored at each diode. However, light falling on a discrete
diode may not be derived solely from the incident light but may contain light generated by
fluorescence excited by light of a shorter wavelength.
The ideal multichannel detector would be a combination of both the dispersion system and
the diode array detector. This arrangement would allow a true monochromatic light beam to
pass through the detector and then the transmitted beam would itself be dispersed again
onto a diode array. Only that diode sensing the wavelength of the incident light would be
used for monitoring the transmission. Under some circumstances, measurement of
Photodiode Array Detection in Clinical Applications;
Quantitative Analyte Assay Advantages, Limitations and Disadvantages
165
transmitted light may involve fluorescent light and the absorption spectrum obtained for a
substance may be a degraded form of the true absorption curve. In this way any fluorescent
light would strike other diodes, the true absorption would be measured and accurate
monochromatic sensing could be obtained.
In a multichannel dispersive detector light from the deuterium lamp is collimated by two
curved mirrors onto a holographic diffraction grating. The dispersed light is then focused by
means of a curved mirror, onto a plane mirror and light of a specific wavelength is selected
by appropriately positioning the angle of the plane mirror. Light of the selected wavelength
is then focused by means of a lens through the flow cell. The exit beam from the cell is then
focused by another lens onto a photocell, which gives a response that is some function of the
intensity of the transmitted light. The detector is usually fitted with a scanning facility that
allows the spectrum of the solute contained in the cell to be obtained. There is an inherent
similarity between UV spectra of widely different types of compounds, and so UV spectra
are not very reliable for the identification of most solutes.
A usual use of multichannel choice is to enhance the sensitivity of the detector by selecting a
wavelength that is characteristically absorbed by the substance of interest. Conversely, a
wavelength can be chosen that substances of little interest in the mixture do not adsorb and,
thus, make the detector more specific to those substances that do.
Multichannel dispersive detectors provids adequate sensitivity, versatility and a linear
response. But, it has mechanically operated wavelength selection and requires a stop/flow
procedure to obtain spectra. In contrast, the diode array detector has the same advantages but
none of these disadvantages.
Find some important multichannel detector on the list below.
- Photodiode Array (PDA)
- Semiconductors (Silicon and Germanium) (see Figure 3)
- Group IV elements
- Formation of holes (via thermal agitation/excitation)
- Doping
- n-type: Si (or Ge) doped with group V element (As, Sb) to add electrons.
As: [Ar]4S
2
3d
10
4p
3
- p-type: Doped with group III element (In, Ga) to added holes
In: [Kr]5S
2
4d
10
5p
1
(see Figure 4)
- coupled device (CCD)
- vidicon
1.1.3 Photodiode array detectors
A photodiode array is a linear array of several hundred light sensing diodes light ranging
from 128 to 1024 – and even up to 4096 having a thousand phototubes, for every different
wavelength. The design of this kind of machine is somewhat different and simpler.
(Figures 2-4) Light passes through the sample first. Then it hits the monochromator, and
then it is dispersed onto the photodiode array.
This multichannel detector makes an ideal sensor for an entire spectrum in a UV-VIS
dispersive spectrophotometer. With that application, newer arrays have been made with
adjacent diodes 25.6 mm long and spaced 25 mm on centers.
A polychromatic beam from the source is irradiated onto the inlet slit of the polychromator
after passing through the sample compartment. The polychromator disperses the narrow
Photodiodes – Communications, Bio-Sensings, Measurements and High-Energy Physics
166
band of the spectrum onto the diode array. The photodiode converts light into electrical
signals and temporarily stores them. These signals are then read out as time-series signals
via the output line by sequentially turning on the switch array connected to each
photodiode with address pulses generated from the shift register.
A silicon photodiode consists of a reversed biased pn junction formed on a silicon chip. A
photon promotes an electron from the valence bond (filled orbitals) to the conduction bond
(unfilled orbitals) creating an electron(-) - hole(+) pair. The concentration of these electron-
hole pairs is dependent on the amount of light striking the semiconductor. Spectral
resolution limited by size of diode.
PDA detectors are useful in both research and quality assurance laboratories. In the research
laboratory, the PDA provides the analyst with a variety of approaches to the analysis. In the
quality assurance laboratory, the PDA provides several results from a single run, thereby
increasing the throughput of the HPLC.
PDA detection offers the following advantages:
- Peak measurement at all wavelengths:
In methods development, detailed information about the detector conditions required for
the analysis may not be known. When a variable wavelength detector is used, a sample
must often be injected several times, with varying wavelengths, to ensure that all peaks
are detected. When a PDA detector is used, a wavelength range can be programmed and
all compounds that absorb within this range can be detected in a single run.
- Determination of the correct wavelengths in one run:
After all peaks have been detected, the maximum absorbance wavelength for each peak
can be determined. A PDA detector can collect spectra of each peak and calculate the
absorbance maximum.
- Detection of multiple wavelengths:
A PDA detector can monitor a sample at more than one wavelength. This is especially
useful when the wavelength maxima of the analytes are different. Wavelengths can be
selected to analyze each compound at its highest sensitivity.
- Peak purity analysis:
It is difficult to determine component purity from a chromatogram. However, a PDA
detector can analyze peak purity by comparing spectra within a peak. A pure peak has
matching spectra throughout the peak (at all wavelengths).
- Positive peak identification:
In liquid chromatography, peak identification is usually based on relative retention
times. When a PDA detector is used, spectra are automatically collected as each peak
elutes. The PDA software compares the spectra with those stored in a library to
determine the best fit matches; this method increases the likelihood of correctly
identifying peaks.
- Scan spectrum very quickly:
entire spectrum in <1 second
- Provides single beam.
- Powerful tool for studies of transient intermediates in moderately fast reactions.
- Useful for kinetic studies.
- Useful for qualitative and quantitative determination of the components exiting from
a liquid chromatographic column.
In addition to above points, there are many major advantages of diode array detection. In
the first, it allows for the best wavelength(s) to be selected for actual analysis. This is
Photodiode Array Detection in Clinical Applications;
Quantitative Analyte Assay Advantages, Limitations and Disadvantages
167
particularly important when no information is available on molar absorptivities at different
wavelengths.
The second major advantage is related to the problem of peak purity. Often, the peak shape
in itself does not reveal that it actually corresponds to two or even more components. In
such a case, absorbance rationing at several wavelengths is particularly helpful in deciding
whether the peak represents a single compound or, is in fact, a composite peak.
As already mentioned, a special feature of some variable wavelength UV detectors is the
ability to perform spectroscopic scanning and precise absorbance readings at a variety of
wavelengths while the peak is passing though the flow cell. Diode array adds a new
dimension of analytical capability to liquid chromatography because it permits qualitative
information to be obtained beyond simple identification by retention time.
In absorbance rationing, the absorbance is measured at two or more wavelengths and ratios
are calculated for two selected wavelengths. Simultaneous measurement at several
wavelengths allows one to calculate the absorbance ratio. Evaluation can be carried out in
two ways:
In the first case, the ratios at chosen wavelength are continuously monitored during the
analysis: if the compound under the peak is pure, the response will be a square wave
function (rectangle). If the response is not rectangle, the peak is not pure.
Fig. 2. (a) Schematic of a silicon diode, (b) Formation of depletion layer which prevents of
flow of electricity under reverse bias [Skoog & Leary,1992].
Photodiodes – Communications, Bio-Sensings, Measurements and High-Energy Physics
168
Fig. 3. (a) n-type and (b) p-type photodiode array.
Photodiode array (PDA) detectors scan a range of wavelengths every few milliseconds and
continually generate spectral information. Wavelength, time, and absorbance can all be
plotted.
In methods development, detailed information about the detector conditions required for
the analysis may not be known. When a variable wavelength detector is used, a sample
must often be injected several times, with varying wavelengths, to ensure that all peaks are
detected. When PDA detectors provide three-dimensional information that allows an
accurate assessment of peak identity, purity, and quantitation in a single run. Software
support for PDA detectors includes peak purity and spectral library search functions to help
determine peak homogeneity and identity.
1.1.4 Photodiode array applications
Spectrometers have developed in many ways since the introduction of simple
spectrophotometers which were commercially available from the mid 1950’s. Such
improvements have enabled us to use PDA type UV-Vis. spectrophotometers.
The scope and performance of conventional single channel detector type UV-Vis
spectrophotometers were found to be somewhat limited. This encouraged a search for novel
techniques which could be applied to the development of UV-Vis. spectrophotometers.
Photodiode Array Detection in Clinical Applications;
Quantitative Analyte Assay Advantages, Limitations and Disadvantages
169
Dispersed light is focused directly onto the detector array, saving considerable time and
greatly reducing instrument complexity. The combination of dispersing element and
detector array is employed in most spectrophotometers today.
1.1.4.1 UV-Vis spectroscopy
The introduction of multichannel detectors such as the linear photodiode array (PDA),
charge coupled device (CCD) and vidicon enabled new detection systems to be developed
for UV-Vis spectrophotometers and encouraged the rapid development of polychromators
from the 1970s [Talmi, 1975,1982].
As was expressed earlier a polychromator is an enhanced monochromator which it is
accomplished by electronic scanning of the multichannel detector.Multichannel detectors
such as the photodiode array, charge coupled device or vidicon are usually flat and are best
used with a dispersing arrangement which yields a flat focal plane. Under optimum
conditions, they can detect as many wavelengths simultaneously as their number of
individual diodes, resolution elements or pixels. Stray light and background per element are
negligible because they are arrays and they have very low dark currents.
PDA, on the other hand, is more suited for applications where the light level is relatively
high. Because in the PDA the photon saturation charge is greater than CCD so the detection
range of PDA is larger than CCD. Furthermore, PDA delivers lower noise than CCD. So it
PDA was recommend in applications where higher output accuracy is needed.
This multichannel detector having numbers of elements ranging from 128 to 1024 and even
up to 4096. It makes an ideal sensor for an entire spectrum in a UV-VIS dispersive
spectrophotometer.
A polychromatic beam from the source is irradiated onto the inlet slit of the polychromator
after passing through the sample compartment. The polychromator disperses the narrow
band of the spectrum onto the diode array. The photodiode converts light into electrical
signals and temporarily stores them. These signals are then read out as time-series signals
(see Figure .4).
A spectrum for the whole wavelength range should be acquired for best results. The
correlation between wavelengths and particular detector channels in a polychromator
facilitates nearly simultaneous measurement of the intensities of the various wavelengths.
Fig. 4. Schematic of a photodiode array spectrophotometer.
Photodiodes – Communications, Bio-Sensings, Measurements and High-Energy Physics
170
The conventional UV-Vis. spectrophotometer only has one detector. But data for many
wavelengths can be acquired with the photodiode array spectrophotometer simultaneously
since there are several hundred or a thousand detectors present.Fast spectral acquisition
makes diode array spectrophometers the first choice for measurement of fast chemical
reactions and kinetics study of materials.
The duration and intensity of illumination determine both the final S/N ratio and the
exposure interval needed to acquire a spectrum. This interval is also the integration time for
the signal. A longer integration time allows a higher S/N since the signal will be larger and
noise averaged more completely towards zero.
There is no Integration function in the conventional UV-Vis spectrophotometer which
accumulates the signal. For example, the total required time will be 1000 sec. for 1000 data
points and it takes 1 sec. to measure one datum. In this case, all 1000 data have the same
signal to noise ratio (S/N). But in a PDA instrument which has a 1000 photodiode array,
1000 data points can be measured in 1 sec. and it would take 1/1000 sec. to achieve the same
result obtainable in 1 sec. in a conventional instrument. Therefore, when the same sample is
measured for 1000 sec in a PDA instrument, the signal is accumulated and is 1000 times
greater than when measuring for 1 sec. The noise will be 1000. This means that the S/N ratio
is improved by 1000.
This resulting benefit of fast data acquisition is termed Felgett’s Advantage or Multichannel
Advantage.
In a conventional UV-Vis spectrophotometer mechanical movement is required to select a
specific wavelength. But a photodiode array UV-Vis spectrophotometer acquires data at
each wavelength by electrical scanning. In this way, the wavelength reproducibility of a
PDA instrument is much better than the conventional mechanical scanning UV-Vis
spectrophotometer. In addition, a photodiode array type spectrophotometer has a reversed
optic structure which minimizes stray light problems, a serious issue in conventional UV-
Vis spectrophotometers.
On the other hand, a PDA is a solid-state device and is more secure and reliable than a PMT
(photomultiplier tube). Furthermore, a polychromator avoids the variations in optical
performance with wavelength and time that are introduced in a scanning monochromator
by moving the grating. Indeed, in a polychromator no mechanical movement is required
except perhaps the opening of a shutter at the entrance slit.
The Spectroscopy methods which are used of PDA can be divided into 3 sections: mass
spectrometry, atomic spectroscopy and molecular spectroscopy. The applications of PDA for
all 3 sections have been growing steadily. UV-Vis, FT-IR, Fluorescence, Raman and NIR
spectroscopy instruments are in the molecular group. UV-Vis, is the largest category in this
section. UV-Vis spectroscopy finds applications not only in traditional chemistry but also in
newer fields such as pharmaceuticals & life science, environment, agriculture, energy and
the petrochemical Industry.
1.1.4.2 Photodiode array and HPLC
The great importance of diode-array detection in HPLC can be characterized by the fact that
this is solely the subject of an excellent book edited by Huber and George [Huber & George,
1993].
The most important advantage of the diode-array UV detector over conventional
multiwavelength UV detectors is the speed of scanning the spectra. Using the reversed
optics of the diode-array spectrophotometer enables all points in the spectrum to be