Photodiodes Communications Bio Sensings Measurements and High Energy Part 15 potx
Bạn đang xem bản rút gọn của tài liệu. Xem và tải ngay bản đầy đủ của tài liệu tại đây (479.1 KB, 14 trang )
The New Photo-detectors for High Energy Physics and Nuclear Medicine 11
Energy (MIP) (1 MIP=0.861 MeV)
0123456
Normalized yield
0
0.02
0.04
0.06
0.08
0.1
0.12
Monte Carlo
Data
(a)
Amplitude [ADC]
0 500 1000
Entries
0
50
100
150
200
250
300
350
400
450
(b)
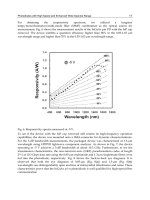
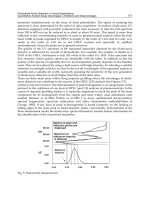
Fig. 11. Response spectrum of a scintillator/SiPM detection system to muons in the hadronic
calorimeter prototype (CALICE, 2010; D’Ascenzo, 2009).
setup is shown in Fig. 9.
The 450 GeV proton beam is used on a Beryllium target in order to generate a secondary beam
of pions with a wide momentum spectrum in the range between 30 GeV/c and 205 GeV/c.
In addition, a muon beam is also available due to contamination of the secondary pion beam.
The average muon energy is hence approximately 0.8
· E
π
.
A mathematical model of the test setup system based on the GEANT4 simulation framework
is also implemented on the basis of the mathematical model of the full detection system. The
simulation includes all the detailed components of the test beam experimental setup.
The first important goal of experimental study is the verification of the efficient detection
of the high energetic particles, minimum ionizing particle (m.i.p.), as required by the PFA
concept. As an example a 12 GeV pion s hower identified in the data is shown in Fig. 10.
Furthermore muons produced in the hadron shower are also identified as straight tracks
which escape from the calorimeter and penetrate the tail catcher (D’Ascenzo, 2009). The
study of the response to muons, which mainly deposit energy by the ionization process in
the massive volume of matter, could give a good experimental evidence.
Fig. 11a shows the signal of a single calorimeter scintillator cell read-out by a SiPM produced
by 120 GeV muons. On the same plot is presented the Monte Carlo result including
the systematic effects of the detector. The experimental results are well described by the
mathematical model.
The resolution of the m.i.p. signal in a scintillator cell of the hadronic calorimeter depends
on the statistical effects of the photon detection. The poisson fluctuation of the number
of photo-electrons (N
p.e.
) generated in the Si PM is the main source of the smearing of the
signal. Its effect on the resolution of the visible energy depends on the
N
p.e.
;themost
probable value of the m.i.p. signal is 861 keV and corresponds to 15
± 3 photo-electrons,
with a consequent relative statistical fluctuation of
√
15/15 = 25%. Moreover, the poisson
smearing doesn’t affect the energy deposited in the single cell uniformly. According to a
simulation of the energy response of the single AHCAL cell to muons, a Landau distribution
with Most Probable Value at 861 keV and width 60 keV approximates the energy deposited in
271
The New Photo-Detectors for High Energy Physics and Nuclear Medicine
12 Will-be-set-by-IN-TECH
the scintillator. The resolution is 60/861 ∼ 5%.
The muon signal measured in the data can be fitted with a Landau distribution convoluted
with a Gaussian distribution, which models the smearing of the detector read-out. The result
of the fit of the response of a single cell to a 120 GeV muon is shown in Fig. 11b. The energy
resolution of the m.i.p. signal is about 70% but the signal is well distinguished from the noise
pedestal. In the full prototype an average S/N separation of about 9 is measured (CALICE,
2010).
4. Recent advances of scintillator/SiPM detection systems in nuclear medicine
4.1 The scintillator/SiPM detection system in Positron Emission Tomography
Positron Emission Tomography is a powerful functional imaging modality that provides
dynamic, quantitative information on the biological characteristics of tumours and other
tissues. While PET has mainly found clinical application in oncology, uses in cardiology,
neurology and neuropsychiatry are expected to increase in the future. Recent studies showed
the potential of PET for the measurement of tissue activation and perfusion in specific
diseases, as brain neurological perfusion in Alzheimer and autism or hearth activation study
in case of myocardial infarction (Boddaert & Zilbovicius, 2006; Buchsbaum, 2006).
It is required to develop various PET systems with significantly better performance than
commercially available scanners, in particular concerning spatial resolution for earlier cancer
detection and more accurate staging. Also the PET camera needs higher sensitivity to reduce
scanning time, cost and patient exposure to radiation, good time resolution, operation at high
magnetic fields for a combination with Magnetic Resonance Techniques and design flexibility.
The detection system of PET is the key point which defines the main performance of the
medical imaging systems and which is triggering the new clinical applications and new
developments in molecular and cell biology. The modern advances in the SiPM development
made it possible to develop a new type of scintillation crystals/SiPM detection system for
application in Positron Emission Tomography.
The miniature size and the low material budget of SiPMs give the possibility to build flexible
PET detection systems and include complementary methods for improving the performance.
This feature is referred to as the depth of interaction (DOI) p roblem. The measurement of
the DOI is realised quite simply with SiPMs and will improve imaging quality. The excellent
time resolution of SiPMs and of the new scintillators gives the possibility of using the Time of
Flight methods with a significant improvement of the signal to noise ratio of PET images. The
effect on PET would be the ability to reduce the coincidence timing window by one order of
magnitude. This would not only result in improvements in the noise equivalent counts (NEC)
through the reduction in randoms, but also provides the ability to perform time-of-flight PET
reconstruction. With a timing resolution of less than 0.5 ns, it becomes possible to define the
site of positron annihilation within a line segment of less than 7.5 cm, and thereby to improve
the reconstruction.
4.2 Mathematical model of a PET scanner based on LSO/SiPM detectors with individual
read-out of crystals
In order to estimate the possibility to achieve the mentioned goals, a mathematical simulation
study of a PET scanner with LSO crystals individually read-out by a SiPM is performed. The
mathematical model for the LSO/SiPM detection system is developed on the basis of the
GATE framework, which allows to include the geometry and the physics processes and also
to perform the reconstruction by standard methods for the performance study (Strul, 2003).
272
Photodiodes – Communications, Bio-Sensings, Measurements and High-Energy Physics
The New Photo-detectors for High Energy Physics and Nuclear Medicine 13
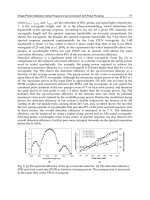
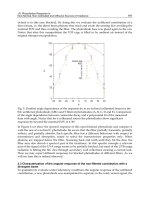
Fig. 12. Detailed geometry of the PET detection system on the basis of LSO scintillator crystal
read-out individually by SiPM.
A detailed geometrical configuration of a detector ring for a PET scanner based on the
LSO/SiPM detection system is shown in Fig. 12. One ring of 53.3 cm diameter is composed of
detection modules placed around the axis in a cylindrical symmetry. The size of the system is
typical of the state of the art high resolution brain PET scanners (Karp et al., 2003).
According to the NEMA NU2-2001 performance protocol (National Electrical Manufacturers
Association, 2001) the source configuration used for the estimation of the space resolution is
the β
+
emitter
18
F, arranged in a glass spherical capillary with internal and external radius
respectively of 0.2 mm and 0.3 mm The initial activity is 10000 Bq.
Each detector module consists of a 6
×6 array of LSO/SiPM cell. As an example, in case of
3
× 3 × 25 mm
3
crystals, the crystals pitch is 3.1 mm and the size of one detector module is
18.6
× 18.6 × 2.5 mm
3
. The ring is composed of 85 modules with an angular pitch of 4.23
◦
.
LSO c rystals are covered by a reflecting layer o f Teflon, with the correct description of the
physical and optical properties. The geometrical acceptance and the optic coupling of the
crystals with the SiPM are included according to experimental estimations.
Light propagation and collection on the face of SiPMs are also included in the physics
processes. The Photon Detection Efficiency of the SiPMs used in the simulation is shown
in Fig. 5 and is reported from experimental measurements (Stewart, 2008).
The energy deposited in each crystal is calculated in the simulation and is converted into
a photon flux via the scintillation processes. The scintillation photons are produced as
gaussian distributed with a mean value (LY) of 27000 photons/MeV (Melcher, 1992) and a
variance σ
sc
equal to the expected Poisson statistic variance multiplied by a scale factor: σ
sc
=
α
s
LY ×E
γ
,whereE
γ
is the energy of the detected photon. The scale factor α
s
= 4.41 models
the intrinsic not-linearity of LSO. The photon yield of each crystal is read-out independently
by a SiPM and the detected light output of each SiPM is calculated.
The timing performance is included in the simulation as the scintillation process time
dependence and the light propagation. The intrinsic time resolution of the SiPM is also
273
The New Photo-Detectors for High Energy Physics and Nuclear Medicine
14 Will-be-set-by-IN-TECH
[rad]θ
0 0.5 1 1.5 2 2.5 3
s [mm]
-15
-10
-5
0
5
10
15
(a) (b)
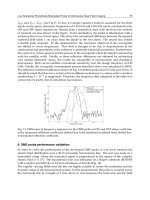
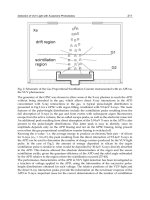
Fig. 13. Sinogram (a) and reconstructed image (b) resulting from the simulation of the
response of the PET system based on LSO/SPM detectors to a
18
Fsourceof0.2mmradius
placed at a vertical distance of 1 cm from the centre of the tomograph. The detection module
is composed of a 6
×6 array of 3 × 3 ×25 mm
3
LSO crystals.
considered in the simulation.
The coincidence condition is defined as two events in two opposite crystals with deposited
energy within
±3 σ around the photo-peak and within a coincidence time window of 80 ns.
The reconstruction of the Lines Of Response (LOR) is performed by using the position of
the centre of the two crystals found in coincidence. The sinogram is constructed from
the LORs, without applying any rebinning or geometrical correction. A standard filtered
backprojection algorithm FBP2 with Hammer filtering is applied to the sinogram for the
reconstruction of the original image and for the study of the spatial resolution. The sinogram
resulting from the simulation of the response of the P ET system is shown in Fig.13a. As
any rebinning is applied, the structure of the LSO array composing the detector block is
visible. The r econstructed i mage is shown in Fig.13b. The transverse spatial resolution is
estimated as σ
x
=
(
0.94 ±0.62
)
mm and σ
y
=
(
0.87 ± 0.46
)
mm. The estimated average
transverse resolution (FWHM) is
(
2.13 ±1.26
)
mm. The axial resolution depends uniquely on
the ring thickness. In this example case of a detecting module consisting of a 6
×6 array of
3
×3×25 mm
3
LSO crystals, the ring thickness is 18.6 mm. The corresponding axial resolution
is estimated as about 18.6/3.0
= 6.2 mm.
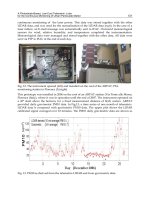
The results of the study are shown on Fig. 14. The space resolution is studied of PET systems
based on 6
× 6 arrays of 3 × 3 × 25 mm
3
,4× 4 × 25 mm
3
and 5 ×5 × 25 mm
3
individually
read-out LSO crystals. The transverse space resolution (FWHM) ranges between about 2 mm
and 4 mm. For a comparison with results reported in literature, a transverse spatial resolution
of 4 mm was measured for a high resolution brain PET scanner based on an Anger-logic
detector array with 4
× 4mm
2
GSO crystals (Karp et al., 2003). The single crystal read-out
introduces hence a sensitive improvement with respect to the traditional Anger-logic based
PET systems. The axial resolution ranges between about 6 mm and 10 mm. These value
refer to the ring thickness calculated using a 6
× 6 array of LSO crystals. The flexibility of
the LSO/SPM detection system allows to optimize the ring thickness according t o the specific
clinical needs of the tomograph, resulting in lower or higher axial resolution.
The mathematical simulation shows a significant improvement of the performances and
flexibility of the PET detection systems based on scintillator/SiPM detection systems.
274
Photodiodes – Communications, Bio-Sensings, Measurements and High-Energy Physics
The New Photo-detectors for High Energy Physics and Nuclear Medicine 15
Fig. 14. Monte Carlo estimation of the transverse (dots) and axial (triangles) space resolution
of PET systems based on 6
×6 arrays of 3 ×3 ×25 mm
3
,4×4 ×25 mm
3
and 5 ×5 ×25 mm
3
individually read-out LSO crystals. The space resolution is shown as a function of the crystal
pitch.
4.3 Experimental study of the prototype of the PET detection system based on the
LSO/SiPM detectors
The experimental study of the new detection system on the basis of LSO/SiPM
photo-detectors for applications in medical imaging systems was performed on a prototype
of PET detection system. The prototype consists of two LSO crystals coupled to a SiPM and
positioned opposite to each other at 180
◦
. The experimental setup is shown in Fig. 15a. The
scintillator crystals used in this study are two 2.5
×2.5 ×15 mm
3
LSO crystals wrapped in two
layers of 1.25 mm thick Teflon films. The crystals are fixed to two mechanical holders (plastic)
and are positioned opposite to each other on an optic bench in a light tide environment. The
distance between the LSO crystals is 1 cm in order to i ncrease the acceptance angle for the
efficient collection of the statistics. A SiPM is coupled to the surface of the LSO crystals
without any optics coupling material. The SiPMs used in t he test setup are 1 mm
2
Silicon
Photomultiplier SPM, produced by SensL (Stewart, 2008).
The SiPM signals are read out on 50 Ω load resistors directly by 4 GHz Oscilloscope (Textronix
TDS7404B) without any front end electronics. The signals is digitized with a sampling rate of
20 Gs/s, which corresponds to 100 ps time digitalising periods for two channels and 50 ps
shift between the two signals.
A point-like positron source
22
Na is placed in the middle and aligned with the line of centers
crystals connection. It is held by a thin plastic cylindrical support with 2 cm diameter and
2 mm thickness.
The digitized signal of the two SiPMs in coincidence correspondent to two 511 keV gamma
quanta is shown in Fig. 16. The signal has typical amplitude of about 100 mV. The rise
275
The New Photo-Detectors for High Energy Physics and Nuclear Medicine
16 Will-be-set-by-IN-TECH
(a) (b)
Fig. 15. Mathematical model (a) and experimental setup (b) for the analysis of two
LSO/SiPM (blue/red) system.
Fig. 16. Example of digitized signal of the two SiPMs (blue and green) when the annihilation
photons from the
22
Na are detected in coincidence in the two opposite LSO crystals in the
experimental setup.
time is 28 ns at the levels 10%-90%. The decaying component of the signal follows an
exponential distribution with typical decay time of about 60 ns. The fully digitized signal
gives a unique possibility to use powerful mathematical tools for the analysis of the main
276
Photodiodes – Communications, Bio-Sensings, Measurements and High-Energy Physics
The New Photo-detectors for High Energy Physics and Nuclear Medicine 17
Entries 27013
/ ndf
2
χ
10.94 / 11
Constant 11.3± 675.6
[keV] μ
0.8± 511.1
[keV] σ
0.86± 44.17
Energy [keV]
0 200 400 600 800 1000
entries/ 10 keV
100
200
300
400
500
600
700
Entries 27013
/ ndf
2
χ
10.94 / 11
Constant 11.3± 675.6
[keV] μ
0.8± 511.1
[keV] σ
0.86± 44.17
(a)
Entries 9922
/ ndf
2
χ
13.62 / 12
Constant 7.5± 311.7
[keV] μ
1.0± 511.5
[keV] σ
1.08± 43.51
Energy [keV]
0 200 400 600 800 1000
entries/ 10 keV
0
100
200
300
Entries 9922
/ ndf
2
χ
13.62 / 12
Constant 7.5± 311.7
[keV] μ
1.0± 511.5
[keV] σ
1.08± 43.51
(b)
Fig. 17. Monte Carlo (a) and experimental data estimation (b) of the energy resolution in the
experimental setup.
characteristics of the detection system based on the LSO/SiPM and for the precise verification
of the mathematical model.
4.3.1 E nergy resolution of the LSO/SiPM detection system
The energy spectrum measured in the test setup is shown in Fig. 17b. The energy deposited
in the LSO crystal ( n umber of photons detected in the SPM) are calculated as the integral
of the output signal. The integration is performed in an off-line analysis of the stored
digital waveforms of the two SPM signals. The typical features of a γ-ray spectrum can be
individuated: the photoelectric-peak at the energy of incident photons (511 keV), the Compton
continuum extending from the photo-electric peak down to the instrumentation threshold and
the back-scatter peak at around 200 keV, due to the Compton interaction of the incident photon
in the material around the crystal.
The energy resolution of the LSO/SiPM detection system for PET is defined in the region of
the photoelectric peak as R
≡
σ
511 keV
,whereσ is the total variance and 511 keV is the mean
value of the photo-electric peak.
The experimental energy resolution at the photo-electric peak is estimated with a gaussian fit
as R
=
(
8.51 ±0.23
)
%.
The energy resolution of a LSO/SiPM system could be described by the total variance σ as the
sum in quadrature of five independent contributions:
σ
= σ
LSO
⊕σ
stat
⊕σ
pd f
⊕σ
opt
⊕σ
el
(3)
The intrinsic variance of the scintillation photons generated in the LSO is represented by
σ
LSO
. According to the experimental e stimations reported in section 4.2, it corresponds to
aresolutionofR
LSO
=
4.41
√
LY×0.511
LY×0.511
= 3.76%.
The contribution σ
pde
describes the bro adening effect caused by the not uniform
detection efficiency in the spectral range of the scintillation emission. It is estimated
as σ
pde
[
keV
]
/511
[
keV
]
=(
3.77 ± 0.54)% for the combination of LSO/SiPM with the
radio-luminescence spectrum and photon detection efficiency.
The impact of the reflection properties of the Teflon adds to the overall variance as an
independent constant term σ
opt
.
277
The New Photo-Detectors for High Energy Physics and Nuclear Medicine
18 Will-be-set-by-IN-TECH
The optical transmission contribution of the experimental setup is estimated with the Monte
Carlo as σ
opt
[
keV
]
/511
[
keV
]
=
(
2.78 ± 0.05
)
%. Dedicated experimental estimation of this
contribution is also reported in the literature (Herbert, 2006).
The noise of the read-out electronics contributes to the total variance with a constant term σ
el
.
It is estimated from the experimental data as σ
el
[
keV
]
/511
[
keV
]
=
(
1.68 ± 0.11%
)
el
.
The binomial photo-statistics of the detection of the scintillation photons in the SiPM is
included in the term σ
stat
.
The detailed analysis of σ
stat
, σ
LSO
and σ
pd f
is performed in analytical form with a statistical
model, taking into account the photo-statistics of the generation and propagation of the optical
photons i n the crystal, the detection in the SiPM and the optical properties of the detection
system.
The probability distribution P
(n), which describes the number of photons n detected in the
SiPM if a γ-ray is detected in the LSO crystal, is expressed as:
P
(
n
)
=
1
√
2πσ
2
sc
e
−
(
N
ph
−N
LY
·E
γ
)
2
σ
2
sc
×
×
1
√
2πN
ph
α·
(
λ
)(
1−α·
(
λ
))
e
−
(
n−α·(λ)N
ph
)
2
2N
ph
α·(λ)(1−α·(λ))
dN
ph
P
(
λ
)
dλ
(4)
where:
• N
LY
is the light yield of LSO (27000 photons/MeV).
• E
γ
is the energy of the detected γ−ray. In this study E
γ
= 511 keV.
• σ
sc
= 4.41 ·
N
LY
· E
γ
is the intrinsic resolution of the LSO crystal for energy E
γ
.
• P
(
λ
)
is the radio-luminescence spectrum of LSO (Fig. 5).
•
(
λ
)
is the photo-detection efficiency of the SiPM (Fig. 5).
• α is the geometrical photon collection efficiency, which takes into account the photon losses
due to the not perfect reflectivity of the crystal/Teflon surfaces. It depends on the geometry
of the crystal and of the size of the SiPM.
The mean value of the detected photons
¯
n is from Eq. 4:
¯
n
=
n · P
(
n
)
dn =
α ·
(
λ
)
·
LY ·E
γ
P
(
λ
)
dλ = α ·
¯
· LY · E
γ
(5)
The second moment of the number of detected photons
n
2
is:
n
2
=
n
2
· P
(
n
)
dn =
=
α ·
¯
· LY · E
γ
−α
2
·
2
·LY · E
γ
+ α
2
2
σ
2
sc
+ α
2
2
·LY
2
· E
2
(6)
where the quantities are defined:
¯
=
(λ)P
(
λ
)
dλ
2
=
2
(λ)P
(
λ
)
dλσ
2
=
2
−
¯
2
(7)
The quantities
¯
and σ
represent the mean value and the total spread of the photon detection
efficiency weighted over the radio luminescence s pectrum of the LSO. The variance of the
detected photons σ
2
= n
2
−
¯
n
2
is :
α
2
¯
2
σ
2
sc
+ LY · E
γ
·α ·
¯
(
1 −α ·
¯
)
+
σ
2
σ
2
sc
+ LY · E
γ
·
(
LY ·E
γ
−1
)
(8)
278
Photodiodes – Communications, Bio-Sensings, Measurements and High-Energy Physics
The New Photo-detectors for High Energy Physics and Nuclear Medicine 19
The analytic formula for σ
LSO
, σ
stat
and σ
pd f
is extracted from Eq. 8:
σ
2
LSO
= α ·
¯
2
σ
2
sc
σ
2
stat
= LY · E
γ
·α ·
¯
(
1 −α ·
¯
)
σ
2
pde
= σ
2
σ
2
sc
+ LY · E
γ
·
(
LY ·E
γ
−1
)
(9)
The performance of the LSO/SiPM is estimated with the mathematical model of the test setup.
Thebestachievableenergyresolutionofa2.5
×2.5 ×15 mm
3
LSO crystal is calculated in the
case the crystal is read-out over the f ull area at one side by a perfect detector with photon
detection efficiency equal to 1 over the whole LSO emission spectral range. The response of the
crystal is simulated to a monochromatic 511 keV photons directed to the centre of the crystal.
The energy resolution at the photo-electric peak is estimated as R
=
(
4.73 ± 0.06
)
%, which
corresponds to a total number of about 8100 photons. The result can be interpreted using the
statistical model in Eq. 3, with the values
¯
= 1, σ
= 0, α = 8100/(27000 ·0.511)=0.587 and
σ
el
= 0:
(
4.73 ± 0.06
)
% =
(
3.76%
)
LSO
⊕
(
0.71 ± 0.01
)
stat
⊕(2.78 ± 0.05%)
opt
(10)
The scintillator/SiPM detection system has the potential to reach the intrinsic energy
resolution of the scintillator itself. This estimation is in fact in good agreement with reported
experimental results, where an energy resolution of
(
4.24 ± 0.01
)
% is obtained with a 3 ×3 ×
15 mm
3
LSO crystal read-out over the whole 3 × 3mm
2
area by a SiPM (D’Ascenzo et al.,
2007).
The energy spectrum calculated with the mathematical model corresponding to the conditions
of the experimental measurements is shown in Fig. 17a. The typical features of a γ-ray
spectrum can be individuated. An average number of 254 detected photons corresponding
to the photoelectric peak is calculated in the mathematical model. The energy resolution is
estimated with a gaussian fit around the photoelectric peak as
(
8.64 ± 0.18
)
%. The result of
the mathematical model estimation is interpreted according to the analytic model in Eq. 3,
with α
¯
= 254/(27000 ·0.511):
(
8.64 ± 0.18
)
% ≈
(
3.76%
)
LSO
⊕
(
6.21 ±0.06%
)
stat
⊕
⊕
(
3.77 ±0.54%
)
qpd
⊕
(
2.78 ±0.05%
)
opt
(11)
where σ
opt
and σ
LSO
are determined as described above, σ
stat
is determined from direct
calculation using Eq.9 and σ
qpd
is determined from a subtraction in quadrature.
The measured energy resolution can be decomposed similarly in the independent components
according to Eq. 3:
(
8.51 ± 0.23
)
% ≈
(
3.76%
)
LSO
⊕
(
5.79 ± 0.74%
)
stat
⊕
⊕
(
3.77 ± 0.54%
)
qpd
⊕
(
2.78 ± 0.05%
)
opt
⊕
⊕
(
1.68 ± 0.11%
)
el
(12)
where σ
el
, σ
opt
, σ
LSO
and σ
qpd
are determined in Eq. 11 and σ
stat
is determined subtracting in
quadrature all the determined components from the overall measured resolution.
The experimental data are well described by the mathematical model and the results in Eq. 11
and 12 are in good agreement. This proves the accuracy of the mathematical model of the PET
detection system on the basis of LSO/SiPM individual read-out.
The SiPMs used in the experimental set-up have a 1
×1mm
2
active area which is smaller than
the crystal surface. Although their average photon detection efficiency in the LSO emission
spectral region is around 20% (Fig. 5), the small active area limits the overall photon c ollection
efficiency of the LSO/SiPM system.
279
The New Photo-Detectors for High Energy Physics and Nuclear Medicine
20 Will-be-set-by-IN-TECH
(a) (b)
Entries 2035
/ ndf
2
χ
30.42 / 26
Constant 3.24± 98.93
Mean [ps]
8.498± 5.272
[ps]
t
σ
9.5± 306
t [ps]Δ
-3000 -2000 -1000 0 1000 2000 3000
-1
entries/40 [ps]
0
20
40
60
80
100
Entries 2035
/ ndf
2
χ
30.42 / 26
Constant 3.24± 98.93
Mean [ps]
8.498± 5.272
[ps]
t
σ
9.5± 306
(c)
Timing threshold (photons)
1 1.5 2 2.5 3
TIme resolution [ns]
0
0.5
1
1.5
2
2.5
3
3.5
4
(MC)
opt
σ⊕
SPM
σ⊕
LSO
σ⊕
stat
σ
(Analytic model)
stat
σ
(d)
Fig. 18. Measured (a-b) and simulated (c-d) time difference distribution of two LSO/SPM
detecting elements in coincidence of 511 keV signal from the β
+
emitter
22
Na. In (a,c) the
timing threshold is set at N
ph
= 1 photon. In (b,d) the time resolution is shown as a function
of the timing threshold. The dots are the Monte Carlo estimation of the full energy
resolution, the triangles are the analytical model described in Eq. 18.
4.3.2 T ime resolution of the LSO/SiPM detection system
The measured time difference spectrum of the LSO/SiPM detection system in response to a
Na
22
source is shown in Fig. 18a. The events are selected in coincidence and if the integral
of the corresponding signals is within a window of
±3 σ around the photo-electric peak. The
threshold is selected to N
th
= −0.1 V below the DC level of the signal. The time at which
the signal crosses the threshold N
th
is estimated with a linear fit around the negative edge of
the detected signal. The mathematical simulation of the time response corresponding to the
conditions of the experimental measurements is shown in Fig. 18c.
The time resolution σ
t
= 806 ± 26 ps is achieved from a gaussian fit to the coincidence time
280
Photodiodes – Communications, Bio-Sensings, Measurements and High-Energy Physics
The New Photo-detectors for High Energy Physics and Nuclear Medicine 21
spectrum.
The analysis of coincidence time resolution σ
t
could be expressed as the sum in quadrature of
five independent contributions:
σ
2
t
=
√
2σ
2
LSO
⊕
√
2σ
2
SP M
⊕σ
2
stat
⊕σ
2
opt
⊕σ
2
el
(13)
where σ
LSO
and σ
SP M
are the time resolution respectively of LSO and SiPM.
The intrinsic time resolution of the SiPM σ
SP M
is estimated from the rise time of the single
photoelectron signal and is experimentally determined as σ
SP M
∼ 27 ps (Saveliev, 2010).
The intrinsic timing response of the LSO crystal σ
LSO
to 511 keV photons depends on
two physics processes. The first is the time required for a 511 keV photon to undergo a
photo-electric absorption. The second is the transit time of the p hoto-electron in the LSO
crystal which determines the rise time of the scintillation photons emission. This means that if
a 511 photon interacts through photoelectric effect in the LSO crystal within a mean free path
λ, this process happens on average within σ
LSO
= λ/c ∼ 29 ps, where c is the speed of light.
The intrinsic overall coincidence time resolution of a LSO/SiPM detection system can be
estimated as
√
2σ
LSO
⊕
√
2σ
SP M
=
√
2 ·
√
29
2
+ 29
2
∼ 60 ps.
The photo-statistics of the detection of scintillation optical photons, the optical properties of
the Teflon/LSO surface and the read-out electronics affect significantly the overall coincidence
time resolution of the LSO/SiPM detection system.
The c ontribution of the band-width and of the time-jitter of the read-out electronics introduces
a constant finite resolution σ
2
el
.
The reflection of the optical photons in the LSO/Teflon surface introduces a significant
contribution to the coincidence time resolution at low photon fluxes. This effect is included
in the overall coincidence time resolution with a constant term σ
opt
. Its contribution to the
coincidence time resolution of the LSO/SPM detection system is estimated with the Monte
Carlo as σ
opt
≈ 250 ps for the experimental setup.
The effect of the binomial photon detection efficiency to the detection of the timing threshold
N
th
photon is included in the term σ
stat
and can b e described analytically with a statistical
model.
The contribution of the photo-statistics σ
stat
is the variance of the probability distribution
which describes the statistical process that after r intervals Δt,morethank photons are
detected in the SiPM. The timing threshold is k detected photons. The distribution P
(t) of
the detected scintillation photons is composed of two parts, according to the signal shape of
the L SO/SPM system. It is approximately increasing linearly in the time range
(0, τ
r
) and is
exponentially decreasing in the time range
(τ
r
, +∞):
P
(t)=
¯
αLY
·E
γ
ττ
r
t 0 < t < τ
r
¯
αLY
·E
γ
τ
e
−
t
τ
τ
r
< t < +∞
(14)
where:
• LY is the light yield of the LSO crystal.
• E
γ
is the detected energy in the crystal.
• τ
r
is the rise time of the output signal of the detection system.
• τ is the average decay time of the LSO crystal.
•
¯
and α are respectively the average efficiency of the SPM (Eq. 7) and the overall geometric
photon detection efficiency.
281
The New Photo-Detectors for High Energy Physics and Nuclear Medicine
22 Will-be-set-by-IN-TECH
The average value of the detected photons in the r
th
time interval is:
μ
(
rΔt
)
=
rΔt
(r−1)Δ t
P(t)dt (15)
The probability P
(n > k) of detecting more than k ph otons in the time interval Δt is described
by the Poisson statistics:
P
(n > k)=
+∞
∑
n=k
μ
n
(
rΔt
)
e
−μ
(
rΔt
)
n!
(16)
The probability that more than k photons are detected a fter r
× Δt ps is interpreted as the
probability that more than k photons are detected at the r
th
trial:
P
(
r
)
=
k−1
∑
n=0
μ
n
(
rΔt
)
e
−μ
(
rΔt
)
n!
r−1
×
+∞
∑
n=k
μ
n
(
rΔt
)
e
−μ
(
rΔt
)
n!
(17)
which is expressed as:
P
(
r
)
=
1
−
+∞
∑
n=k
μ
n
(
rΔt
)
e
−μ
(
rΔt
)
n!
r−1
×
+∞
∑
n=k
μ
n
(
rΔt
)
e
−μ
(
rΔt
)
n!
(18)
The variance σ of this distribution can be estimated numerically. It is a non decreasing function
of the threshold value k. This statistical effect makes the measurement very sensitive to the
chosen timing threshold, as observed also in other experimental studies (D’Ascenzo et al.,
2007). The contribution of the photon statistics to the total coincidence time distribution is
σ
stat
=
√
2 × σ.
The best possible time resolution is σ
t
=
(
54.07 ±1.30
)
ps at a timing threshold of 1 detected
photon in case of a 2.5
× 2.5 × 15 mm
3
LSO crystal wth perfect read out at one side. The
statistically independent contributions to the time resolution of the system are according to
Eq. 13:
(
54.07 ±1.30 ps
)
≈
√
2
(
29 ps
)
LSO
⊕
√
2
(
29 ps
)
SP M
⊕
⊕
(
9.00 ± 0.02 ps
)
stat
(19)
where σ
LSO
and σ
SP M
are taken from the above estimation and σ
stat
is estimated numerically
from the probability distribution in Eq. 18 with parameters
¯
= 1, σ
= 0andα =
8100/(27000 · 0.511)=0.587. The contribution of the optical reflections on the boundary
LSO/Teflon surfaces σ
opt
is negligible at this high detected optical photon flux. The Monte
Carlo results agree with the estimation of best possible coincidence time resolution of the
LSO/SPM detection system shown above on the basis of physical principles.
The time difference spectrum of the LSO/SiPM detection system estimated with the
mathematical model of the test setup is shown in Fig. 18a. The expected time resolution
is cal culated with a gaussian fit as 306
± 9 ps a t a timing threshold N
ph
= 1 photon. The
independent contributions to the time resolution are estimated according to Eq. 13 as:
(
306 ±9ps
)
=
√
2
(
29 ps
)
LSO
⊕
√
2
(
29 ps
)
SP M
⊕
⊕
(
191 ±5ps
)
stat
⊕
(
239 ±8ps
)
opt
(20)
where σ
LSO
and σ
SP M
are taken from the above estimation, σ
stat
is estimated numerically
from the distribution 18 with parameters α
¯
= 254/(27000 · 0.511) and σ
opt
is calculated as a
282
Photodiodes – Communications, Bio-Sensings, Measurements and High-Energy Physics
The New Photo-detectors for High Energy Physics and Nuclear Medicine 23
difference in quadrature from the other terms.
The dependence of the coincidence time resolution on the threshold is estimated by simulation
(Fig. 18b). The time resolution degradates from 306 ps up to about 3.6 ns when the threshold is
increased from 1 up to 3 photons. The p rediction of the analytical model for the statistical term
σ
stat
is also shown in Fig. 18b. The statistical term is a non decreasing function of the threshold.
This explains the degradation of the estimated coincidence time resolution with the increase
of the threshold. The difference between the modelling estimation and the statistical model
depends on the additional terms σ
LSO
, σ
SP M
and σ
opt
which are not included in the analytic
model but are considered in the simulation.
The worsening of the coincidence time resolution with the increase of the coincidence timing
threshold is also observed in the experimental data (Fig. 18d).
From a comparison between the dependence of the coincidence time on the timing threshold
in data and the Monte Carlo, the timing threshold applied in the experimental data can be
estimated as about 2 detected photons.
Improvements in the experimental set up are needed in order to achieve the expected time
resolution of the LSO/SPM detection system.
5. Conclusions
The Silicon Photomultiplier technology is mature for the efficient read-out of scintillators, with
consequent improvements in High Energy Physics and Nuclear Medicine applications.
The direct read-out of plastic scintillators by SiPM is feasible and can be an elegant solution
for a simplification of the d esign of highly granular hadronic calorimeters in new high energy
physics experiments.
The read-out of inorganic scintillators by SiPM is also a promising solution for the design
of highly granular Positron Emission Tomographs of new generation, with transverse space
resolution down to 2 mm and excellent time resolution of few h undreds ps.
The measured performances of the scintillator/SiPM detection system are hence promising
for the possible applications to calorimetry and Positron Emission To mography. In the latter
case, a benefit is found both for morphological and functional in vivo studies in which space
and time resolution play a significant role.
6. References
Alvares-Gaume L. et al. (2008) Review of Particle Physics, Particle Detectors. Physics Letters,
Vol. 667, No. 1-5, 2008 , 281-370.
ATLAS Collaboration (1999) ATLAS detector and physics performance, CERN/LHCC99-14.
Behnke,T.; Damerell,C.; Jaros,J. & Miyamoto,A. (2007) ILC Reference Design Report. Vol4:
Detectors, www.linearcollider.org/about/Publications/Reference-Design-Report
Blin,S. (2006) Dedicated very front-end electronics for an ILC prototype hadronic calorimeter
with SiPM read-out, LC-DET-2006-007.
Boddaert N. & Zilbovicius V. (2006) Functional neuroimaging and childhood autism,
Pediatr.Radiol., 32, 1-7.
Buchsbaum et al. (1992) Brief Report: Attention p erformance in Autism and regional brain
metabolic rate assessed by Positron Emission Tomography, Journal of Autism and
Developmental disorders, 22, 115-125.
CALICE Collaboration (2010) Construction and Commissioning of the CALICE Analog
Hadron Calorimeter Prototype, JINST 5 P05007.
283
The New Photo-Detectors for High Energy Physics and Nuclear Medicine
24 Will-be-set-by-IN-TECH
The CDF II Collaboration (1996) CDF Technical Design Report, FERMILAB-Pub-96/390-E.
D’Ascenzo, N.; Eggemann A.; Garutti E. & Tad day, A. (2007) Application of Micro Pixel
Photon Counter to calorimetry and PET, Il Nuovo Cimento C,Vol.30N.5.
D’Ascenzo,N.; Eggemann, A. & Garutti,E. (2007) Study of Micro Pixel Photon Counters for a
high granularity scintillator-based hadron calorimeter, DESY 07-196, arXiv:0711.1287.
D’Ascenzo,N. (2009) Study of the neutralino sector and analysis of the muon response of a
highly granular hadron calorimeter at the International Linear Collider, Phd Thesis,
DESY-THESIS-09-004.
Firestone,R.B. (1996) Table of isotopes, New York Wiley.
Freeman,J. (2009) Silicon photomultipliers for the CMS hadron calorimeter, Nucl.Instr.Meth.A,
617, 393-395.
Golovin,V. & Saveliev,V. (2004) Novel Type o f Avalanche Photodetector with Geiger Mode
Operation, Nucl.Instr.Meth.A, 518, 560-564.
Herbert,D.J.; Saveliev,V.; Belcari,N.; D’Ascenzo,N.; Del Guerra,A. & Golovin,A. (2006) First
results of scintillator read-out with Silicon Photomultiplier detectors, IEEE Trans.
Nucl.Sci. NS53(1), 389-394.
ILD Concept Group (2009) The International Large Detector: Letter of
Intent, FERMILAB-LOI-2010-03, FERMILAB-PUB-09-682-E, DESY-2009-87,
KEK-REPORT-2009-6.
Karp,J.; Suleman,S.; Daube-Witherspoon,M.; Freifelder,R.; Cardi,C.A.; Adam,L.; Bilger,M.
& G. Muehllehner, Performance of a Brain PET Camera based on Anger-logic
gadolinium oxyorthosilicate detectors Journ.Nucl.Med., 44, 1340-1349.
Mao,R.; Zhang,L. & Ramsden,D. (2002) Emission spectra of LSO and LYSO crystals excited by
UV light, X-ray and γ-ray, IEEE Trans. Nucl. Sc., 55, 1759-1766.
Melcher,C.L. & Schweitzer,J.S. (1992) Cerium-doped Oxyorthosilicate: A Fast, Efficient New
Scintillator, IEEE Trans. Nucl. Sc., 39, 1759-1766.
National Electrical Manufacturers Association (2001) Performance Measurements of Positron
Emission Tomographs, NEMA Standard Publications NU-2-2001.
Yokoyama,M. (2009) Application of Hamamatsu MPPCs t o T2K neutrino detectors,
Nucl.Instr.Meth.A, 610, 128.
Saveliev V., Golovin V. (2000), Silicon Avalanche Photodiodes on the basis of
Metal-Resistor-Semicinductor (MRS) Structures, Nucl.Instr.Meth.A, 442, 223-229.
Saveliev V. (2010), Silicon Photomultiplier - New Era of Photon Detection, Advances in Optical
and Photonic Devices, Ki Young Kim (Ed.), ISBN: 978-953-7619-76-3, InTech.
SensL (2010), .
Stewart,A.G.; Saveliev,V.; B ellis,S.J.; Herbert,D.J.; Hughes,P.J. & Jackson,J.C. (2008)
Performance of 1 mm
2
Silicon Photomultiplier, IEEE J. Quantum Electron, 44(2), 157.
Strul,D.; Santin,G.; Breton,V. & Morel,C. (2003) Nucl.Phys.B,125,75-79.
Thompson,M. (2006) Particle Flow Calorimetry at the International Linear Collider, Pramana
journal of physics, 69,6, 1101-1107.
Toshikaza Hakamata et al. (2006), Photomultipliers Tubes, Basics and Applications,
Hammamatsu Photonics K.K., Electron Tube Division, Japan.
Tsang W.T. (Ed.) (1985) Semiconductors and Semimetals: Lightwave Communication
Technology, Part D, Photodetectors, 1-309, Academic Press Inc., ISBN
:978-0-12-752153-4.
Yamamura Kazuhisa et al. (2009) Production and Development status of MPPC, Proceedings
of Science, PoS (PD09) 017.
284
Photodiodes – Communications, Bio-Sensings, Measurements and High-Energy Physics