Advanced Trends in Wireless Communications Part 10 docx
Bạn đang xem bản rút gọn của tài liệu. Xem và tải ngay bản đầy đủ của tài liệu tại đây (1.72 MB, 35 trang )
Advanced Trends in Wireless Communications
304
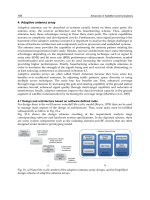
The figure 1 shows the block diagram of an OWC communications system (also called Free
Space optic communications system or FSO) (Zsu, 2002). The information signal (analog or
digital) is applied to the optical transmitter to be sent through the atmosphere using an
optical antenna. At the receiver end the optical beam is concentrated, using an optical
antenna, to the photo-detector sensitive area, which output is electrically processed in order
to receiver the information signal.
2. Important access technologies (first and last mile)
In the past decades, the bandwidth of a single link in the backbone of the networks has been
increased by almost 1000 times, thanks to the use of wavelength division multiplexing
(WDM) [Franz, 2000]. The existing fiber optic systems can provide capabilities of several
gigabits per second to the end user. However, only 10% of the businesses or offices, have
direct access to fiber optics, so most users who connect to it by other transmission
technologies which use copper cables or radio signals, which reduces the throughput of
these users. This is a bottleneck to the last mile (Zsu, 2002).
While there are communication systems based on broadband DSL technology or cable
modems, the bandwidth of these technologies is limited when compared against the optical
fiber-based systems (Willebrand, 2002). In the other hand, the RF systems using carrier
frequencies below the millimeter waves can not deliver data at rates specified by IEEE
802.3z Gbit Ethernet. Rates of the 1 Gbps and higher can only be delivered by laser or
millimeter-wave beams. However, the millimeter wave technology is much less mature
than the technology of lasers (Willebrand, 2002), which leaves the optical communications
systems as the best candidates for this niche market. Therefore, the access to broadband
networks based on optical communications may be accomplished through passive optical
networks (or PON‘s, which are based on the use of fiber optics) or via optical wireless
communication systems (Qingchong, 2005).
The optical wireless communications industry has experienced a healthy growth in the past
decade despite the ups and downs of the global economy. This is due to the three main
advantages over other competing technologies. First, the wireless optical communications
cost is on average about 10% of the cost of an optical fiber system (Willebrand, 2002). It also
requires only a few hours or weeks to install, similar time to establish a radio link (RF),
while installing the fiber optics can take several months. Second, OWC systems have a
greater range than systems based on millimeter waves. OWC systems can cover distances
greater than a kilometer, in contrast with millimeter-wave systems that require repeaters for
the same distance. In addition, millimeter wave systems are affected by rain, but the OWC
systems are affected y fog, which makes complementary these transmission technologies
(Qingchong, 2005). Finally, this type of technology as opposed to radio links, does not
require licensing in addition to not cause interference.
2.1 Applications of the OWC systems
Optical wireless communications systems have different applications areas:
a. Satellite networks
The optical wireless communications systems may be used for in satellite
communication networks, satellite-to-satellite, satellite-to-earth (Hemmati et al, 2004).
b. Aircraft
In applications satellite to aircraft or the opposite (Lambert et al, 1995 ).
Trends of the Wireless Optical Communications
305
c. Deep Space
In the deep space may be used for communications between spacecraft – to – earth or
spacecraft to satellite. (Hemmati et al, 2004).
d. Terrestrial (or atmospheric) communications
In terrestrial links are used to support fiber optic, optical wireless networks "wireles
optical networks (WON)" last mile link, emergency situations temporary links among
others (Zsuand & Kahn, 2002).
Each application has different requirements but this book chapter deals primarily with
terrestrial systems.
2.2 Basic scheme of OWC systems communications
Optical communications receivers can be classified into two basic types. (Gagliardi & Karp,
1995): non-coherent receivers and coherent receivers. Noncoherent detect the intensity of
the signal (and therefore its power). This kind of receivers is the most basic and are used
when the information transmitted is sent by the variations in received field strength. On the
other hand are coherent receivers, in which the received optical field is mixed with the field
generated by a local optical oscillator (laser) through a beam combiner or coupler, and the
resulting signal is photo-detected.
2.2.1 Noncoherent optical communications systems
The commercially deployed OWC systems use the intensity modulation (IM) that is
converted into an electrical current in the receiver by a photodetector (usually are a PIN
diode or an avalanche photo diode (APD)) which is known as direct detection (DD).
This modulation scheme is widely used in optical fiber communications systems due to its
simplicity.
In IM-DD systems, the electric field of light received, E
s
is directly converted into electricity
through a photoreceiver, as explained above. The photocurrent is proportional to the square
of E
s
and therefore the received optical power P
r
, i.e.:
() ()
2
s
e
it E t
h
η
=
ν
(1)
where e is the electronic charge, η is the quantum efficiency, h is Planck's constant, υ is the
optical frequency. The block diagram of the system is shown in Figure 2.
Fig. 2. Block diagram using an optical communication system of intensity modulation and
direct detection (noncoherent)
Advanced Trends in Wireless Communications
306
The optical direct detection can be considered as a simple process of gathering energy that
only requires a photodetector placed in the focal plane of a lens followed by electronic
circuits for conditioning the electrical signal derived from the received optical field (Franz &
Jain, 2000).
2.2.2 Coherent optical communications systems
In analog communications in the radio domain [Proakis, 2000, Sklar, 1996], the coherent
term is used for systems that recover the carrier phase. In coherent optical communications
systems, the term "coherent" is defined in a different way: an optical communication system
is called coherent when doing the mixing of optical signals (received signal and the signal
generated locally) without necessarily phase optical carrier recovered [Kazovsky, 1996].
Even if it does not use the demodulator carrier recovery but envelope detection, the system
is called coherent optical communication system due to the mixing operation of the optical
signals. In turn, the coherent receivers can be classified into two types: asynchronous and
synchronous. They are called synchronous when the tracking and recovering of the carrier
phase is performed and asynchronous when is not performed the above mentioned process.
The asynchronous receivers typically use envelope detection (Kazovsky, 1996), (Franz &
Jain, 2000) Figure 3 shows the basic structure of a communications system with digital phase
modulation and coherent detection. The output current of the photodetectors array is:
()
(
)
(
)
()
[]
{}
22
SLO
SLO LOs LOS
Et E t
it
22
E t E cos t
=ℜ +ℜ
+
ℜ ω −ω +φ −φ
(2)
where ℜ=en/hv is the responsivity, E
LO
is the electric field generated by the laser that
operates as a local oscillator,
ω
LO
is the frequency of the local oscillator and ω
s
is the carrier
frequency of the optical received signal
φ
LO
is the phase of the carrier signal received, and
φs is the carrier phase of the received optical signal. The coherent mixing process requires
that the local beam to be aligned with the beam received in order to get efficient mixing. This
can be implemented in two different ways; if the frequency of signal and local oscillator are
different and uncorrelated the process is referred to as heterodyne detection (Fig. 4) (Osche,
2002); if the frequencies of the signal and local oscillator are the same and are correlated, is
Fig. 3. Optical Communication System with coherent detection
Trends of the Wireless Optical Communications
307
Fig. 4. Optical heterodyne receiver
called homodyne detection (Fig. 5) (Osche, 2002).Due to the process of mixing, coherent
receivers are theoretically more sensitive than direct detection receivers (Kazovsky, 1996).
In terms of sensitivity, the coherent communications systems with phase modulation,
theoretically have the best performance of all (e.g. BPSK is about 20 dB better than
OOK). Sensitivity is the number of photons per bit required to get a given probability of
error (Kazovsky 1996).
Fig. 5. Optical homodyne receiver
2.2.3 Advantages of optical communications systems with coherent detection
As mentioned previously the coherent optical communications systems have better
performance than incoherent optical communications systems and may be used the phase,
amplitude and frequency and state of polarization (SOP) of the optical signal allowing
various digital modulation formats of both amplitude, phase and SOP combination.
However, the coherent detection systems are expensive and complex (Kazovsky, 1996),
Advanced Trends in Wireless Communications
308
(Ryu, 1995) and require control mechanisms or subsystems of the state of polarization of the
received signal with the optical signal generated by local oscillator (laser). Moreover,
homodyne optical communications systems require coherent phase recovery of the optical
carrier, and usually this is done through optical Phase Lock Loop (OPLL), Costas loop or
other sinchronization technique, which increases the complexity of these systems.
3. Optical and optoelectrónic components
Devices such as the laser diodes, high-speed photo-receivers, optical amplifiers, optical
modulators among others are derived of about thirty years of investigation and
development of the fiber optics telecommunications systems. These technological advances
has made possible the present OWC systems. Additionally, OWC systems have been
benefited by the advances in the telescopes generated by the astronomy.
3.1 Optical sources for transmitters
In modern optical wireless communications, there are a variety of light sources for use in the
transmitter. One of the most used is the semiconductor laser which is also widely used in
fiber optic systems. For indoor environment applications, where the safety is imperative, the
Light Emitter Diode (LED) is prefered due to its limited optical power. Light emitting
diodes are semiconductor structures that emit light. Because of its relatively low power
emission, the LED's are typically used in applications over short distances and for low bit
rate (up to 155Mbps). Depending on the material that they are constructed, the LED's can
operate in different wavelength intervals. When compared to the narrow spectral width of a
laser source, LEDs have a much larger spectral width (Full Width at Half Maximun or
FWHM). In Table 1 are shown the semiconductor materials and its emission wavelength
used in the LED's (Franz et al, 2000).
Material Wavelength Range (nm)
AlGaAs 800 – 900
InGaAs 1000 – 1300
InGaAsP 900 – 1700
Table 1. Material, wavelength and energy band gap for typical LED
3.1.1 Laser
The laser is an oscillator to optical frequencies which is composed by an optical resonant cavity
and a gain mechanism to compensate the optical losses. Semiconductor lasers are of interest
for the OWC industry, because of their relatively small size, high power and cost efficiency.
Many of these lasers are used in optical fiber systems, there is no problem of availability. Table
2 summarize the materials commonly used in semiconductor lasers (Agrawal, 2005)
Material Wavelength Range (nm)
GaAlAs 620 - 895
GaAs 904
InGaAsP
1100 – 1650
1550
Table 2. Materials used in semiconductor laser with wavelengths that are relevant for FSO
Trends of the Wireless Optical Communications
309
3.2 Photodetectors
At the receiver, the optical signals must be converted to the electrical domain for further
processing, this conversion is made by the photo detectors. There are two main types of
photodetectors, PIN diode (Positive-Intrinsic-Negative) and avalanche photodiode"
avalanche photodiode (APD) (Franz et al, 2000). The main parameters that characterize the
photodetectors in communications are: spectral response, photosensitivity, quantum
efficiency, dark current, noise equivalent power, response time and bandwidth (Franz et al,
2000). The photodetection is achieved by the response of a photosensitive material to the
incident light to produce free electrons. These electrons can be directed to form an electric
current when applied an external potential.
3.2.1 Pin photodiode
This type of photodiodes have an advantage in response time and operate with reverse bias.
This type of diode has an intrinsic region between the PN materials, this union is known as
homojunction. PIN diodes are widely used in telecommunications because of their fast
response. Its responsivity, i.e. the ability to convert optical power to electrical current is
function of the material and is different for each wavelength. This is defined as:
e
[A/W]
h
η
ℜ=
ν
(3)
Where η is the quantum efficiency, e is the electron charge (1.6× 10
-19
C), h is Planck's
constant (6.62 ×10
-34
J) and ν is the frequency corresponding to the photon wavelength.
InGaAs PIN diodes show good response to wavelengths corresponding to the low
attenuation window of optical fiber close to 1500nm. The atmosphere also has low
attenuation into regions close to this wavelength.
3.2.2 Avalanche photodiode
This type of device is ideal for detecting extremely low light level. This effect is reflected in
the gain M:
G
p
I
M
I
= (4)
I
G
is the value of the amplified output current due to avalanche effect and I
p
is the current
without amplification. The avalanche photo diode has a higher output current than PIN
diode for a given value of optical input power, but the noise also increases by the same
factor and additionally has a slower response than the PIN diode (see table 3).
Material and Structure Wavelength (nm) Responsivity (A/W) Gain Rise time
PIN. Silicon 300 – 1100 0.5 1 0.1-5 ns
PIN InGaAs 1000 – 1700 0.9 1 0.01-5 ns
APD Germanium 800 – 1300 0.6 10 0.3-1 ns
APD InGaAs 1000 – 1700 0.75 10 0.3 ns
Table 3. Characteristics of photo detectors used in OWC systems
Table 3 shows some of the materials and their physical properties used to manufacture of
photo-detectors (Franz et al, 2000).
Advanced Trends in Wireless Communications
310
3.3 Optical amplifiers
Basically there are two types of optical amplifiers that can be used in wireless optical
communication systems: semiconductor optical amplifier (SOA) and amplifier Erbium
doped fiber (EDFA). Semiconductor optical amplifiers (SOA) have a structure similar to a
semiconductor laser, but without the resonant cavity. The SOA can be designed for specific
frequencies. Erbium-doped fiber amplifiers are widely used in fiber optics communications
systems operating at wavelenghts close to 1550 nm. Because they are built with optical fiber,
provides easy connection to other sections of optical fiber, they are not sensitive to the
polarization of the optical signal, and they are relatively stable under environment changes
with a requirement of higher saturation power that the SOA.
3.4 Optical antennas
The optical antenna or telescope is one of the main components of optical wireless
communication systems. In some systems may have a telescope to the transmitter and one
for the receiver, but can be used one to perform both functions. The transmitted laser beam
characteristics depend on the parameters and quality of the optics of the telescope. The
various types of existing telescopes can be used for optical communications applications in
free space. The optical gain of the antennas depends on the wavelength used and its
diameter (see equations 5, 40 and 41). The Incoherent optical wireless communication
systems typically expands the beam so that any change in alignment between the
transmitter and receiver do not cause the beam passes out of the receiver aperture. The
beam footprint on the receiver can be determined approximately by:
f
DL
≈
θ (5)
D
f
is the footprint diameter on the receiver plane in meters, θ is the divergence angle in
radians and L is the separation distance between transmitter and receiver (meters). The
above approximation is valid considering that the angle of divergence is the order of
milliradians and the distances of the links are typically over 500 meters.
4. Factors affecting the terrestrial optical wireless communications systems
Several problems arise in optical wireless communications because of the wavelengths used
in this type of system (Osche, 2002). The main processes affecting the propagation in the
atmosphere of the optical signals are absorption, dispersion and refractive index variations
(Collet, 1970), (Goodman, 1985) (Andrews, 2005), (Wheelon, 2003). The latter is known as
atmospheric turbulence. The absorption due to water vapor in addition with scattering
caused by small particles or droplets or water (fog) reduce the optical power of the
information signal impinging on the receiver (Willebrand, 2002). Because of the above
mentioned previously, this type of communications system is suscpetible to the weather
conditions prevailing in its operating enviroment. Figure 6 shows the disturbances affecting
the optical signal propagation through the atmosphere.
4.1 Fog
Fog is the weather phenomenon that has the more destructive effect over OWC systems due
to the size of the drops similar to the optical wavelengths used for communications links
(Hemmati et al, 2004.). Dispersion is the dominant loss mechanism for the fog (Hemmati et
al, 2004.). Taking into account to the effect over the visibility parameter the fog is classified
Trends of the Wireless Optical Communications
311
as low (1-5 km), moderate (0.2-1 km) and dense (0.034 – 0.2 km ). The attenuation due to
visibility can be calculated using the following equation (Kim et al, 2000):
m
v
3.9
Pexp L
V0.55
⎡
⎤
−λ
⎛⎞
=
⎢
⎥
⎜⎟
⎝⎠
⎢
⎥
⎣
⎦
(6)
Where
V is the visibility [km], L is the propagation range and m is the size distribution for
the water drops that form the fog.
Fig. 6. Optical link over a terrestrial atmospheric channel
4.2 Rain
Other weather phenomena affecting the propagation of an optical signal is the rain, however
its impact is in general negligible compared with the fog due to the radius of the drops
(200μm - 2000μm) which is significantly larger than the wavelength of the light source OWC
systems [Willebrand 2002].
4.3 Effects due to atmospheric gases. Dispersion and absorption
The dispersion is the re-routing or redistribution of light which significantly reduces the
intensity arriving into the receiver (Willebrand, 2002). The absorption coefficient is a
function of the absorption of each of the the particles, and the particle density. There
absorbent which can be divided into two general classes: molecular absorbent (gas) [];
absorbing aerosol (dust, smoke, water droplets).
4.4 Atmospheric windows
The FSO atmospheric windows commonly used are found in the infrared range.
The windows are in 0.72μm and 1.5μm, and other regions of the absorption spectrum. The
region of 0.7μm to 2.0μm is dominated by the absorption of water vapor and the region of
2.0μm to 4.0μm is dominated by the combination of water and carbon dioxide.
Advanced Trends in Wireless Communications
312
4.5 Aberrations losses
These losses are due to the aberrations of the optical elements and can be expressed as:
()
2
a
k
ab
Le
σ
−
= (7)
k=2π/λ
σ
a
=rms aberrations error
4.6 Atmospheric attenuation
Describes the attenuation of the light traveling through the atmosphere due to absorption
and dispersion. In general the transmission in the atmosphere is a function of link distance
L, and is expressed in Beer's law as [Lambert et al, 1995]
atm
dB
L10log
Km
⎡
⎤
=τ
⎢
⎥
⎣
⎦
(8)
with
()
d
Tx
I
exp L
I
=
τ= −γ (9)
I
d
/I
Tx
is the relationship between the intensity detected and the transmitted output intensity
and γ is the attenuation coefficient. The attenuation coefficient is the addition of four
parameters; the dispersion coefficients of molecules and aerosols, α and absorption
coefficient, β of molecules and aerosols, each depending on the wavelength and is given by
(Lambert et al 1995).
molecule aerosol molecule aerosol
γ
=α +α +β +β (10)
4.7 Atmospheric turbulence
Inhomogeneities in temperature and pressure variations of the atmosphere cause variations
in the refractive index, which distort the optical signals that travel through the atmosphere.
This effect is known as atmospheric turbulence.The performance of atmospheric optical
communications systems will be affected because the atmosphere is a dynamic and
imperfect media. Atmospheric turbulence effects include fluctuations in the amplitude and
phase of the optical signal (Tatarski, 1970), (Wheelon, 2003). The turbulence-induced fading
in optical wireless communication links is similar to fading due to multipaths experienced
by radiofrequency communication links (Zsu, 2002). The refractive index variations can
cause fluctuations in the intensity and phase of the received signal increasing the link error
probability.
As mentioned briefly above, the heating of air masses near the earth's surface, which are
mixed due to convection and wind generates atmospheric turbulence. These air masses have
different temperatures and pressure values which in turn leads to different refractive index
values, affecting the light traveling through them. The atmospheric turbulence has
important effects on a light beam especially when the link distance is greater than 1 km
(Zsu, 1986). Variations in temperature and pressure in turn cause variations in the refractive
index along the link path (Tatarski, 1971) and such variations can cause fluctuations in the
Trends of the Wireless Optical Communications
313
amplitude and phase of the received signal (known as flicker or scintillation) (Gagliardi,
1988). Kolmogorov describe the turbulence by eddies, where the larger eddies are split into
smaller eddies without loss of energy, dissipated due to viscosity (Wheelon, 2003, Andrews,
2005), as shown in Figure 7. The size of the eddies ranges from a few meters to a few
millimeters, denoted as outer scale L
0
, and inner scale, l
0
, respectively as shown in Figure 7
and eddies or inhomogeneities with dimensions that are between these two limits are the
range or inertial subrange (Tatarski, 1971).
Fig. 7. Turbulence model based on eddies according to the Kolmogorov theory
A measure of the strength of turbulence is the constant of the structure function of the
refractive index of air, C
n
2
, which is related to temperature and atmospheric pressure by
(Andrews, 2005):
2
262
nT
P
C7910 C
T
−
⎛⎞
=×
⎜⎟
⎝⎠
(11)
Where P is the atmospheric pressure in millibars, T is the temperature in Kelvin degrees
and C
T
2
is the constant of the structure function. In short intervals, at a fixed propagation
distance and a constant height above the ground can be assumed that C
n
2
is almost constant,
(Goodman, 1985). Values of C
n
2
of 10-17 m
-2/3
or less are considered weak turbulence and
values up to 10-13m
-2/3
or more as strong turbulence (Goodman, 1985). We can also consider
that in short time intervals, for paths at a fixed height, C
n
2
is constant (the above for
horizontal paths). C
n
2
varies with height (Goodman, 1985).
Another measure of the turbulence is the Rytov variance, which relates the structure
constant of refractive index with the beam path through the following equation:
227/611/6
Rn
1.23C k Lσ= (12)
where λ is the wavelength, L is the distance from the beam path and k=2π/λ.
An optical light beam is affected by turbulence in different ways: variations in both intensity
and amplitude, phase changes (phase front), polarization fluctuations and changes on the
angle of arrival.
Advanced Trends in Wireless Communications
314
4.8 Intensity and amplitude fluctuations
The atmospheric turbulence affects the amplitude and phase of the optical signal that
propagates through the medium in two points separated by a distance r, and can be
described by the following equation according to the Rytov method for solving Maxwell's
equations (Goodman, 1985):
() () ()
()
0
Ur U rexp r=ψ
G
GG
(13)
where U
0
(r) is the undisturbed field. The complex phase perturbation can be written
(Andrews, 2005):
(
)
11
riSψ=χ+
G
(14)
or
() ()
10
0
A
rln iSS
A
⎛⎞
ψ= +−
⎜⎟
⎝⎠
G
(15)
where χ is the logarithm of the amplitude A and S is the phase of the field
U(r) and A
0
and
S
0
are the amplitude and phase without disturbing respectively. This analysis is done based
on the Rytov approximation and shows that the irradiance (or intensity) fluctuations follow
a lognormal distribution due to that the logarithm of the amplitude and the irradiance are
related by (Goodman, 1985):
2
I
ln
A
2
⎡
⎤
⎛⎞
⎜⎟
⎢
⎥
⎝⎠
⎣
⎦
χ= (16)
According to the Rytov approximation, the variance of the logarithm of the amplitude 〈χ
2
〉
for a plane wave is (Goodman 1985):
22 211/67/6
n
0.307C L k
χ
χ=σ= (17)
It has been shown that the above equation (13) is a good approximation for values of σ
2
χ
<1
(Wheelon, 2003]. The variance of the logarithm of the intensity is related to the variance of
the logarithm of the amplitude of (Wheelon, 2002).
2
22
ln I
lnI lnI 4
χ
σ
=− =σ
(18)
and
2211/67/62
ln I n R
1.23C L k
σ
==σ (19)
Where σ
R
2
is known as the Rytov variance. The Rytov variance for an infinite plane wave
gives information about the strength of the fluctuations in the irradiance and hence gives us
an idea of the strength of the atmospheric turbulence. Table II shows the relationship
between values of Rytov variance and the strength of fluctuations (Wasiczko, 2004).
Trends of the Wireless Optical Communications
315
Strength levels of turbulence Rytov variance
Weak
2
R
0.3σ<
Medium
2
R
~1σ
Strong
2
R
1σ
Table 4. Typical values of turbulence for turbulence levels from weak to strong
Probability
distribution function
Theory Features Application
Rician [Wheelon, 2001] Born approximation Little agreement with
experimental data
Extremely weak
turbulence regime
Lognormal [Tatarski,
1970]
Rytov approximation Matching moments
with experimental data
Weak turbulence
regime
Negative Exponential
[Andrews, 2005]
Heuristics Easy to handle
analytically
Saturation regime
I-K [Andrews, 2005] Modulation effects of
large scales to small
scales
Difficult to relate PDF*
parameters with the
turbulence ones
Strong Turbulence
Lognormal – Rician
[Andrews, 2005]
Modulation effects of
large scales to small
scales
Difficult to relate
PDF* parameters with
the turbulence ones
Strong Turbulence
Gamma-Gamma
[Andrews, 2005]
Modulation effects of
large scales to small
scales
Its parameters are
directly related to the
turbulence.
Weak to strong
turbulence
Table 5. Models for irradiance distributions (*PDF: Probability destribution function)
Another parameter used to compare the magnitude of the fluctuations of the irradiance is
the transverse coherence length of an electromagnetic wave at optical frequencies (Wheelon,
2001). The coherence length for a plane wave is obtained from (Wheelon, 2003).
(
)
3/5
22
0n
1.46k LC
−
ρ= (20)
For a spherical wave coherence length is given by (Wheelon, 2003)
(
)
3/5
22
0n
0.546k LC
−
ρ= (21)
The coherence radius ρ
0
defined by Fried (Andrews, 2005) is:
00
r 2.099
=
ρ (22)
The meaning of ρ
0
, can be interpreted as follows: the phase in the wave front does not
experience fluctuations in the sense of mean square root of greater than one radian at a
distance ρ
0
wavefront at the receiver (Wheelon, 2003). The following table summarizes and
Advanced Trends in Wireless Communications
316
compares differents models for irradiance distribution that have been proposed by several
authors (Andrews, 2005), (Zsu, 2002).
4.9 Phase variations
The phase fluctuations not are usually take into account in incoherent optical wireless
communication systems. However, in coherent optical wireless communication systems
they should be considered. The phase fluctuations are caused by large eddies including
those of outer scale (Goodman, 1985). It follows that the analysis of phase fluctuations are
based on geometrical optics. Diffraction effects due to small-scale inhomogeneities have
little effect on the result obtained based on geometrical optics (Wheelon, 2001). The complex
phase disturbance [equation (40)], the phase
S(r,L) can be expressed (Tatarski, 1971) as:
() () ()
'*
1
Sr,L r,L r,L
2i
⎡
⎤
=ψ −ψ
⎣
⎦
G
GG
(23)
considering that the turbulence in the atmosphere is homogeneous and isotropic, the phase
variance (Andrews, 2005) is :
()
222
Sn
0
4kL d
∞
σ
≅π κΦ κ κ
∫
(24)
the phase covariance function or the spatial covariance function for plane wave can be
expressed as:
() ()
5/6
22
S,pl n 5/6 0
0
B ,L 0.78C k K
−
⎛⎞
ρ
ρ
=κρ
⎜⎟
κ
⎝⎠
(25)
where K is the modified Bessel function of second class. The temporal covariance function
can be obtained from the spatial function using the frozen turbulence hypothesis of Taylor
(Zhu and Kahn, 2002) replacing ρ=V⊥ where V⊥ is the average wind speed transverse to
the propagation path. Therefore, the spatial covariance function is ( Wheelon, 2003].
() ( ) ( )
5/6
22 5/3
S,pl n 0 0 5/6 0
B ,L 0.78C k V K V
−
⊥⊥
τ
= κ κτ κτ (26)
The power spectrum of phase variations was first published in the work of (Clifford, 1970)
and can be obtained using the Wiener Khintchine theorem (Tatarski, 1970) as shown
below. Applying the Fourier transform of the function of temporal phase covariance, we
obtain the temporal spectrum of phase variations [Tatarski, 1970].
() ( ) ( )
() ()()
S,pl S,pl
0
5/6
22 5/3
n0 0 5/60
0
S4B,Lcosd
3.13C k L V K V cos d
∞
∞
−
⊥⊥
ω= τ ωτ τ
=
κκτ κτωττ
∫
∫
(27)
Evaluating the integral gives [Wheelon, 2003] we obtain the aproximated expression
()
()
25/3
n
S,pl
4/3
222
0
5.82C LV
S
V
⊥
⊥
ω=
ω+κ
(28)
Trends of the Wireless Optical Communications
317
4.10 Polarization fluctuations
The electromagnetic field is characterized by an electric field and a magnetic field which are
vector quantities. The direction taken by the electric field vector at each point along the path
is defined by the polarization of the field (Fowles, 1968). There have been several studies to
estimate the magnitude of the change of polarization in an optical frequency
electromagnetic signal as it travels through the turbulent atmosphere (Collet, 1972)
(Strohbehn, & Clifford, S. 1967). These studies conclude that the change in the state of
polarization of a beam traveling in a line of sight path in the turbulent atmosphere is
negligible. Depolarization is usually measured as the ratio between the average intensity of
the orthogonal field component and the incident plane wave (Wheelon, 2003). Under certain
considerations depolarization can be obtained through:
()
7/3
22
n0
Pol 0.070C k
−
δ= κ (29)
Various expressions have been obtained to determine the depolarization of an electromagnetic
field at optical frequencies, considering quasi-monochromatic light sources and the results are
similar. For example for L = 1500m, λ= 1550 nm and C
n
2
= 1 × 10
-13
the depolarized component
is 2.1 × 10
-18
smaller in terms of the polarized component (Wheelon, 2001).
4.11 Arrival angle fluctuations
Fluctuations on the angle of arrival is another effect of atmospheric turbulence and seriously
affects the performance of the communications system (Andrews, 2005). The movement of
the centroid of the spot intensity on the receiver due to local inhomogeneities in the
transmitter are responsible for this phenomenon. In the case of of non-coherent optical
wireless communications wireless systems, this effect can be decreased by expanding the
transmitted beam, so you always get intensity above the detection threshold to the receiver
at the expense of the decrease in the average intensity (Wheelon, 2003). A more
sophisticated technique is the use of pointing and tracking mechanisms of the centroid of
the optical signal which makes adjustments on both the receiver and transmitter to ensure
the highest possible alignment between them (Hemmati, 2006). Another way of reducing
the effects of the variations on the angle of arrival is the use of adaptive optics, which correct
these variations provided that the receiver aperture is large enough (Wheelon, 2001),
(Andrews, 2005). The variance of the perturbations of the angle of arrival are obtained from
the following equation (Wheelon, 2003).
()
22
0
2R d
∞
δ
θ=π κκΦκ
∫
(30)
4.12 Statistical models of wireless optical channel
As mentioned above, various probability distribution functions have been proposed to
describe the statistical behavior of atmospheric optical communications channel. It was
found that the amplitude distribution (or intensity) and phase is dependent on the theory of
propagation of optical beams used. The phase distribution is obtained from geometrical
optics and found that is suitable for the various regimes of turbulence (Andrews, 2005).
Under the condition that the beam path is much larger than the size of the outer scale, based
on the application of central limit theorem phase fluctuations of the optical signal is
Gaussian and several experiments have supported the outcome (Clifford, 1970).
Advanced Trends in Wireless Communications
318
4.13 System design
This section will show the basics for the design of a OWC link. The power budget of an optical
link must consider different impairments that affect the system performance such as : a) finite
transmission power, b) optical gains and losses, c) Receiver sensitivity, d) propagation losses,
e) electronics noise, f) phase noise of optical sources g) imperfect synchronization for coherent
detection optical carrier, among others. First, we determine the fade margin between the
transmitted optical power and minimum receiver sensitivity needed to establish a specified
BER. It also should be considered the system margin (M
s
), to compensate for the degradation
of components and temperature factors. It is required to estimate a margin of availability (
M)
or link power budget, which is given by the following equation.
fturproppoinatm s
ML L L L L M
=
−− − − − (31)
where:
f
L : fade margin
tur
L
: turbulence losses
prop
L : propagation losses
poin
L : Pointing losses
atm
L : atmospheric losses
s
M
: system margin
Parameters to be considered in the design are: wavelength, transmission rate, signal to noise
ratio (SNR), link distance, diameter of the optical transmitter and receiver antennas,
transmitter power and receiver sensitivity. We describe below the relationship among the
parameters mentioned.
4.13.1 Fade margin
It is defined as the amount of the total losses allowed by the system to perform the optical
link and is obtained from the equation:
fTxsens
LP P
=
− (32)
4.13.2 Propagation losses
Propagation losses are given by (Santamaria A., Lopez-Hernandez F.J., 1994):
2
prop 10
4Z
L10log
π
⎛⎞
=
⎜⎟
λ
⎝⎠
(33)
where Z is the distance between the transmitter and receiver.
4.13.3 Turbulence losses
These losses take into account the effects of the variation of intensity of the laser beam due
to atmospheric turbulence (scintillation) and can be estimated through:
2
0
turb 10
turb
L10log1
⎡
⎤
⎛⎞
Ω
⎢
⎥
=+
⎜⎟
Ω
⎢
⎥
⎝⎠
⎣
⎦
(34)
Trends of the Wireless Optical Communications
319
where
0
Lens _ Tx
2
D
λ
Ω=
π
(35)
With D
Lens_Tx
is the lens transmitter diameter, and
turb
o
λ
Ω=
π
ρ
(36)
where ρ
b
is the coherence radius.
4.13.4 Pointing losses
Pointing losses are due to misalignment between the transmitter and receiver the which
causes reduction in the power captured by the receiver (A. Santamaria, FJ Lopez-
Hernandez, 1994), are given by (A. Santamaria, FJ Lopez-Hernandez, 1994)
2
e
pointing
0
L 4.3229
⎛⎞
φ
=
⎜⎟
Ω
⎝⎠
(37)
Where φ
e
is the boundary angle of diffraction-limited beam of the transmitter and is given
by
e
Lens _ Tx
2D
λ
φ≅ (38)
4.13.5 Atmospheric losses
They appears when the particle causing the scattering has the diameter equal to or greater
than the wavelength of the radiation signal. These lossess are due to atmospheric gases
(Beer’s law). The attenuation and scattering coefficients are related with the visibility (Kim
et al).
4.13.6 Geometric losses
Geometric path losses for a FSO link depends on the beamwidth of the optical transmitter
(θ), the path length (L) and the receiver aperture area (D
r
) (Figure 8):
geo
r
L
L20lo
g
dB
D
⎛⎞
θ
=
⎜⎟
⎝⎠
(39)
L=transmitter-receiver distance
θ=Beam Divergence
D
r
=Receiver diameter
4.13.7 Transmitting and receiving antenna gain
The gain of the transmitting antenna for free space is given by (A. Santamaria, FJ Lopez-
Hernandez, 1994)
Advanced Trends in Wireless Communications
320
2
Tx 10
0
2
G10log
⎛⎞
=
⎜⎟
Ω
⎝⎠
(40)
The receiving antenna gain is given by (A. Santamaria, FJ Lopez-Hernandez, 1994)
r
Rx 10
2
4A
G10log
π
⎛⎞
=
⎜⎟
λ
⎝⎠
(41)
Fig. 8. Geometric losses scheme
5. Mitigating the effects of turbulent optical channel
One of the problems to be resolved in optical communication systems is to reduce the effects
of turbulence, i.e. the scintillation and variations of the angle of arrival of the beam. Various
techniques are used to reduce these phenomena. Among them we can mention the use of
encryption, the use of large aperture receivers, using alignment systems, spatial diversity
and amplifiers using erbium-doped fiber (EDFA).
5.1 Using coding to reduce the effects of turbulence in OWC systems
One way to improve the performance of wireless optical communication systems is the use
of channel coding techniques. Several studies have been conducted to study the effect of the
use of channel coding techniques in conditions of strong turbulence (Tisftsis, 2008) which is
the scenario that offers the worst operating conditions. Pulse modulations such as PPM
(Pulse Position Modulation) have been analyzed under the effects of weak turbulence
(Hemmati, 2006). These results indicate the need for error correction in the receiver (FEC) to
make communication possible under these conditions (Ohtsuki, 2003).
Trends of the Wireless Optical Communications
321
5.2 Large aperture receiver
It is known that for incoherent optical communications systems, such as IM-DD systems, the
use of larger receiver apertures, increase the optical power collected leading to a reduction
in scintillation. This effect is known as aperture averaging. This means that the larger the
diameter of the receiving aperture, the power collected is higher, the signal has a better
signal to scintillation noise ratio and the photo-current fluctuations are reduced (Fried,
1967).
5.3 Tracking and pointing systems
To reduce the effects of drift in the beam and the transmitter-receiver misalignment,
phenomena that reduce the performance of wireless optical communication systems,
mechanical systems can be used to correct both transmitter and receiver to compensate for
variations tilt and pitch. This is possible because both changes occur at speeds of tenths of
seconds (corresponding to frequencies below 100 Hz) (Andrews, 2005).
5.4 Use of spatial diversity to mitigate the effects of turbulence
One way to reduce the effect of signal fading due to turbulence, which is mainly caused by
beam wander, is the use of arrangements of receivers (Andrews, 2005).
5.5 Erbium-doped fiber amplifiers (EDFA)
The use of EDFA in the receiver avoids the use of high power transmission. It has been
shown that the use of these devices also reduces the scintillation due to increased average
received optical power (Franz & Jain, 2000), but these devices could be expensive for certain
applications of OWC systems.
6. Methods of modulation and coding
Traditionally, wireless communications systems use optical modulation formats OOK (On-
Off Keying), which is also widely used in fiber optic systems and is characterized by its
simplicity and robustness. This system consists of intensity modulated optical carrier and
digital information is sent with the presence or absences of the optical carrier. Other
modulation techniques have been used in optical wireless communication systems, such as
pulse position modulation and the use of phase-modulated subcarriers. One of the problems
present in the transmission of optical signals is scintillation, which reduces the optical
power available at the receiver for periods that can be several milliseconds to values below
the detection threshold and thus interruption link. Different alternatives for the solution to
this problem have been proposed and analyzed. You can increase the received optical power
using erbium-doped fiber amplifier (EDFA). The atmospheric turbulence reduces the
received optical power which is caused by the low frequency components of the scintillation
and is expressed as the displacement of the centroid of the spot or footprint of the beam in
the plane of the receiver (beam wander).
6.1 Incoherent optical communication systems. OOK modulation
Within the methods of direct detection and intensity modulation, one of the most used
techniques is the On-Off Keying modulation. For this modulation has been found that the
probability of error (Andrews, 2005) is:
Advanced Trends in Wireless Communications
322
()
eI
0
1SNR(i)
Pfierfc di
2
22
∞
⎛⎞
=
⎜⎟
⎝⎠
∫
(42)
where SNR is the signal to noise ratio as a function of intensity and erfc is the
complementary error function.
f
I
(.) is the probability density function of changes in signal
strength.
6.2 Use of subcarriers
Basically, the resurgence of practical OWC systems is due to the technological developments
of the systems of fiber optic communications. One of the techniques used to improve the
performance of OWC systems is the use of sub-carriers. In this method, the laser beam
intensity is modulated by an electrical signal derived from a combination of these
subcarriers. Figure 9 shows the block diagram for subcarrier intensity modulations systems.
Fig. 9. Subcarrier intensity modulation OWC
6.3 Coherent optical communication systems
As indicated above, the current optical communications systems are based on incoherent
modulation techniques which are relatively simple to implement and robust, but its
theoretical performance is below the coherent modulation format. This type of system has
advantages in relation to sensitivity, frequency selectivity and increased lodging capacity of
channels in the bandwidth of the optical carrier. The coherent optical communication
systems in atmospheric space applications have interesting characteristics that make them
attractive for potential commercial use. For example, the homodyne detection of binary
phase modulated signals (BPSK), the quantum limited is obtained with only 9 photons per
bit, when in the OOK systems are needed 38 photons per bit. The BER for BPSK modulation
is an average over the all possible intensity levels of a given probability density function,
p
I
(I) without regard phase noise (Sánchez, 2008):
() ()
(
)
I
0
BER p erfc SNR d
∞
=
ξξξ
∫
(43)
Trends of the Wireless Optical Communications
323
The optical phase synchronization, and control of the state of polarization are the main
challenges for the practical implementation of coherent systems using optical fiber as
transmission medium (Kazovsky, 2006).
In the case of wireless systems, in clear sky conditions, the state of polarization suffers little
variation and these changes are slow (Hodara, 1966) (Wheelon, 2001), but it is required that
the state of polarization of the signal optical input matches the local oscillator. Carrier
synchonization is neccesary to achieve the demodulation in coherent systems. The phase
modulation techniques are usually suppressed carrier. Techniques such as injection locking,
optical phase lock loop (OPLL) can not be used directly to lock the local oscillator phase
[Kazovsky, 1986]. With the advent of high-speed digital components, the compensation of
polarization, as well as other phenomena of the optical channel can be obtained in the
electrical domain, opening up new possibilities for the practical implementation of optical
communication systems consistent (Sánchez, 2008), (Arvizu, 2010). Figure 10 shows the
block diagram of a coherent optical wireless communication system which shows the
possible subsystems required to enable proper operation. At the transmitter, the optical
phase modulation is performed while at the receiver is used an phase lock loop (PLL) to
maintain synchronized the optical carrier signal with the optical local oscillator [Kazovski et
al, 1995], and a state of polarization control system (Sánchez 2008), (Arvizu, 2010), as well as
a balanced photo-reception stage.
Due to the loss of spatial coherence can not use aperture averaging in coherent optical
communications systems and diameter in the aperture receiver must be smaller than the
coherence distance r0 (equation 22). For example, with L=1500 m, λ=1.550μm and C
n
2
=
7x10
-13
, r
0
=2.5 cm (Figure 11).
However, the small apertures require the use of less divergence beams so that more optical
power is collected by the receiver, which involves the use of pointing and tracking systems
more fine and precise, making the system more complex and expensive. Another solution is
the use of spatial diversity system. The space diversity coherent systems require that each
unit receiving signals are processed individually before combining it and then perform the
symbol detection process (Arvizu et al, 2010). That is, it requires that the signals to be
synchronized in phase due to the loss of spatial coherence so that the combination of signals
is not destructive and attenuates the signal received. This process can be performed
optically or electronically (Arvizu et al, 2010). The distance between these coherent diversity
receivers must be greater than r
0
, so that the signals collected by each unit are uncorrelated.
Other proposed systems is the use of OWC systems with spatial diversity and coherent
detection using (linear post detection combiner) (PDLC), which uses "n" receivers and
develops individually detection by estimating the symbol for each (hypothesis "1" and "0")
then becomes the weighting of the signal with better signal to noise ratio which is selected to
obtain the output data (Arvizu et al, 2010).
Coherent optical communications systems offer several advantage in deep space
applications, such as high sensivity, which is important because of the small signals existent
in this scenery and the absence of atmospheric turbulence. Additionally coherent receivers
have an inherent frequencial selectivity, as well as rejection of the background radiation,
characteristics important in deep space applications.
Next generations of optical wireless communications could use differents strategies for
reduce the turbulence effects. Adaptive optics is a technology utilized for improve the
performance of astronomical telescopes by reducing the wavefront distortions and can be
Advanced Trends in Wireless Communications
324
used in OWC systems. However, still is a technology expensive for terrestrial OWC
applications.
Fig. 10. Block diagram of the Coherent optical wireless communications system. SOPS: State
of polarization system; OL: Local Oscillator: OPLL: Optical Phase lock loop
10
-17
10
-16
10
-15
10
-14
10
-13
10
-2
10
-1
10
0
10
1
C
2
n
[m
-2/3
]
r
0
[m]
Diameter "D"
Fig. 11. Coherence diameter as function of the refractive index structure constant
Trends of the Wireless Optical Communications
325
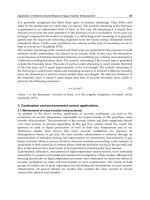
7. Conclusions
In this chapter, the wireless optical communication systems have been discussed from first
principles to systems that use different techniques to improve their performance. Different
atmospheric channel characteristics have been emphasized and in general have shown the
most relevant such as scintillation, the variations of the angle of arrival, the attenuation due
to atmospheric gases and the effects of weather conditions. We analyzed the performance of
communications systems for detecting incoherent modulations (OOK) and coherent
(BPSK).This technology is becoming commonly used in civil applications and in the future
be developed to have a scope similar to fiber optic systems in scope and availability.
8. References
Agrawal, P, Govind (2005). Light Wave Telecommunications Systems John Wiley and Sons, Inc,
ISBN -13 978-0-471-21572-2, New York.
Andrews, L. C. & Phillps, R.L. (2005).
Laser beam propagation through random Media. SPIE
Press, ISBN 0-8194-5948-8 Bellingham, Washington.
Arvizu M. Mondragón, Sánchez L. Juan de Dios, Mendieta J. Francisco Javier, Coherent
Optical Wireless Link Employing Phase Estimation with Multiple Beam, Multiple
Aperture, for Increased Tolerance to Turbulence,
IEICE Transactions communications,
Vol. E93-B, No. 1, (January 2010), 226-229, ISSN 1745-1345.
Collet, E. & Alferness, R. (1972). Depolarization of a laser beam in a turbulent medium.
Journal of the Optical Society of America. Vol. 62, No. 4, (529-533), ISSN 0030-3941.
Clifford, S.F. (1970). Phase Variations in Atmospheric Optical Propagation,
Journal of the
Optical Society of America. Vol. 61, No. 10, (529-533), ISSN 0030-3941.
Fowles G. R. 1975.
Introduction to modern optics. Dover Publications. 2 edition, ISBN
0486659577, New York.
Franz, J. H. & Jain,V.K. (2000).
Optical communications, components and systems. CRC Press.
ISBN 0-8493-0935-2, New Delhi.
Fried. D.L. 1967. Optical heterodyne detection of an atmospherically distorted signal wave
front.
Proceedings of IEEE. Vol. 55, No. 1 (47-67).
Gagliardi, Robert M. and Karp, Sherman (1995).
Optical Communications, John Wiley and
Sons, Inc., Second Edition, ISBN 978-0471542872, New York.
Goodman, J. W. (1985).
Statistical Optics. Wiley and Sons. ISBN 0471015024, New York.
Hemmati, H. (2006).
Deep Space Optical Communications, John Wiley and Sons, Inc., ISBN 978-
0-04002-7.
Kazovsky, L., Benedetto, S., Willner, A (1996).
Light Wave Telecommunications Systems. Artech
House, Inc. Norwood, ISBN 0-89006-756-2.
Kedar, D. y Arnom
, S. (2003). Optical wireless communications through fog in the presence
of pointing errors.
Applied Optics. Vol. 42 No.24, (4946-4954) ISSN 2155-3165.
Kim, I.I, Mc Arthur, B., Korevaar, E. (2000), Comparison of Laser Beam Propagation at 785
nm and 1550 nm, in Fog and Haze for Optical Wireless Communications.
Proceedings of SPIE Optical Wireless Communications III, Vol. 4214, (26-37)
Lambert, G. Stephen and Casey, L. William. (1995)
. Laser Communication in Space. Artech
House, inc., Norwood. ISBN 0-89006-722-8.
Ohtsuki, T. (2003). Performance analysis of atmosferic optical PPM CDMA systems.
Journal
of Lightwave Technology
. Vol. 21 No. 2 (406-411), ISSN: 0733-8724.
Advanced Trends in Wireless Communications
326
Osche, G. 2002. Optical detection theory for laser applications. John Wiley and Sons, ISBN 0-471-
22411-1, New Jersey.
Qingchong L., Chunming Q., Mitchell G., & Stanton S. (2005). Optical wireless
communications networks for first-and last-mile broadband access.
Journal of
Optical Networking
. Vol. 4 No. 12 (807-828), ISSN 1536-5379.
Santamaria A., López-Hernández F.J. (1994).
Wireless LAN systems, Artech House, ISBN
9780890066096.
Sánchez L. Juan de Dios, Arvizu M., Arturo, Mendieta J., Francisco (2008). Optical Phase
Estimation in an Urban Wireless Communications,
IEICE Transactions
communications,
Vol. E91-B, No. 7, (July 2008), 2447-2450, ISSN 1745-1345.
Strohbehn, J.W., y Clifford, S. (1967). Polarization and angle-of-arrival fluctuations for a
plane wave propagated through a turbulent medium.
IEEE Transactions on
Antennas and Propagation
, Vol. 15, No. 3 (416-421), ISSN 0018-926X.
Tatarski, V.I. (1971).
The effects of turbulence atmosphere on wave propagation. The National
Oceanic and Atmospheric Administration. U.S. Departament of Commerce, ISBN
07065-0680-4, Springfield, VA.
Tisftsis T.A. 2008. Perfomance of heterodyne wireless optical communications systems over
gamma atmospheric channels.
Electronics letters. Vol. 44, No. 5, ( 373-375), ISSN:
0013-5194
Wasiczko, L.M. (2006
Techniques to mitigate the effects of atmospheric turbulence on free space
optical communications link
. Ph.D Thesis. University of Maryland. 135 pp.
Willebrand, H. Ghuman, B.S. (2000). Free-space optics: enabling optical connectivity in
today’s networks”, Sams Publishing, Indiana, ISBN 0-672-32248-x, USA.
Wheelon , A. D. (2001).
Electromagnetic scintillation Vol, I. Geometrical optics. Cambridge
University Press. Cambridge, ISBN 0521-801982
Wheelon, A.D. (2003).
Electromagnetic scintillation Vol, II. Weak Scattering. Cambridge
University Press. Cambridge, ISBN: 0521801990.
Zhu, X., Kahn J. M. (2002) Free Space Optical Communications Through Atmospheric
Turbulence Channels,
IEEE Transactions on Communications, Vol. 50, No. 8, August
2002. ISSN 0090-6778.
17
Visible Light Communication
Chung Ghiu Lee
Chosun University
South Korea
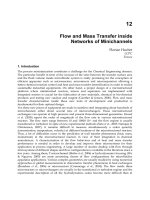
1. Introduction
The visible light communication (VLC) refers to the communication technology which
utilizes the visible light source as a signal transmitter, the air as a transmission medium, and
the appropriate photodiode as a signal receiving component.
The visible light communication technology has a short history compared with other
communication technology, for example, public old telephone service, Ethernet, high-speed
optical communication, wireless cellular communication, IrDA, etc.
It is due to that the development and commercialization of light emitting diodes (LEDs)
which emits the light in visible wavelength range have been successful for illumination in
recent decade. It is said that the illumination LEDs will replace the conventional
illumination lightings such as incandescent bulbs and fluorescent lamps since they have the
characteristics of long lifetime, mercury free, color mixing, fast switching, etc.
By utilizing the advantage of fast switching characteristic of the LEDs compared with the
conventional lightings, i.e., modulating the LED light with the data signal, the LED
illumination can be used as a communication source. Since the illumination exists
everywhere, it is expected that the LED illumination device will act as a lighting device and
a communication transmitter simultaneously everywhere in a near future.
There have been researches on application of visible LEDs. The audio system using visible
light LEDs was reported in Hong Kong by G. Pang et al. (Pang, 1999) and the visible light
communication with the power line communication was reported in Japan by Komine et al.
It can be considered that the active research has been started since 2005. Still the VLC system
is not close to commercialization, but in the basic research.
From the above technical backgrounds, the technical issues will be described in system
viewpoint with the recent developments and research results. The VLC link configuration is
explained in Section 2. The VLC transmitter (Section 3) and the VLC receiver (Section 4) are
described. Section 5 is about VLC considerations including LED characteristics and data
format considering the illumination perspectives, including the international efforts on
standardization for helping commercialization. The chapter will be concluded with Section 6.
2. System description
2.1 Channel configuration
The optical wireless communication (OWC) is a general term for explaining wireless
communication with optical technology. Usually, OWC includes infrared (IR)
communication for short range (Knutson, 2004) and free-space optics (FSO) communication
(FSO website) for longer range.
Advanced Trends in Wireless Communications
328
The visible light communication (VLC) denotes a communication technology which uses
visible light as optical carrier for data transmission and illumination. Nowadays, light-
emitting diode (LED) at visible wavelengths (380 nm ~ 780 nm) has been actively developed
(Schubert, 2003) and can be used as a communication source and, naturally, the silicon
photodiode which shows good responsivity at visible wavelength region is used as
receiving element. The transmission channel is the air, whether it is indoor or outdoor.
At present, the researches on VLC are focused on indoor applications. The indoor VLC
channels are classified adopted from the conventional IR communication (Kahn, 1999) and
(Ramirez-Iniguez, 2008), since the link configurations of VLC are similar to IR communication.
The different characteristics come from the different operating wavelength and wavelength-
dependent devices (visible LED, silicon photodetector, etc), and the fact that the VLC has the
dual nature of communication and illumination. The other physical principles related to optics
can be applied similarly, including the light transmission and reflections.
The link configurations are classified into four basic types (Ramirez-Iniguez, 2008), according to
the existence of obstacles in light path and the directionality of the transmitter to the receiver.
The basic link types include the directed line-of-sight (LOS), the non-directed LOS, the
directed non-LOS, and the non-directed non-LOS. The decision that the link is directed or
non-directed depends on whether the transmitter has the direction to the receiver. The
decision that the link is LOS or non-LOS depends on whether there exist a barrier to block
the transmission of light between a transmitter and a receiver.
In a VLC system, the non-directed LOS link is important since the general illumination
operates for LOS environment and it is not focused or directed.
From now on, we concentrate on indoor application of VLC and non-directed, line-of-sight
(LOS) link, since the indoor application is expected to be developed in a near future.
Fig. 1 shows the simplified geometry for an indoor, non-directed LOS link, with the
transmitter on the ceiling and the receiver on the bottom surface.
φ
ψ
d
transmitter
receiver
Fig. 1. Geometry for an indoor, non-directed LOS VLC link
Following the analysis for the directed LOS link (Kahn, 1997), the received optical power P
at a receiver is expressed as
2
(1)
cos ( ) ( ) ( ) cos( )
2
m
ts
m
PP T g
d
φ
ψψ ψ
π
+
=⋅ ⋅ ⋅ ⋅ ⋅ ,
0
C
ψ
≤
≤Ψ
, (1)