Advances in Photodiodes Part 4 potx
Bạn đang xem bản rút gọn của tài liệu. Xem và tải ngay bản đầy đủ của tài liệu tại đây (2.89 MB, 30 trang )
Modeling and Optimization of Three-Dimensional Interdigitated Lateral
p-i-n Photodiodes Based on In
0.53
Ga
0.47
As Absorbers for Optical Communications
79
we have obtained the remaining fitting parameters of Eqs. (6) and (7) using curve-fitting
methodology where we obtained alphan.caug=0.437, alphap.caug=0.9222, betan.caug=1.818,
betap.caug=1.058, gamman.caug=2.526 and gammap.caug=7.659.
A comparison between these fitted results versus the calculated carrier mobility from
(Sotoodeh et al., 2000; Arora et al., 1992; Chin et al., 1995) as well as some experimental Hall
data (Lee & Forrest, 1991; Ohtsuka et al., 1988; Pearsall, 1981) is shown in Fig. 4(a) till Fig. 4
(c) for T=77K, 100K and 200K. Fig. 4(d) shows the electron mobility as a function of
temperature in InGaAs where calculated electron mobility from this work is compared to
the experimental Hall data from Takeda et al. (1981). A very good agreement is obtained for
temperatures >150K (Menon et al., 2008a).
1.E+02
1.E+03
1.E+04
1.E+05
1.E+06
1.E+14 1.E+16 1.E+18 1.E+20
Electron mobility (cm
2
/V-s)
Doping concentration (cm
-3
)
Lee et al. 1991
This work (77K)
Sotoodeh et al. 2000
Arora et al. 1982
Pearsall 1981
Ohtsuka et al. 198
8
1.E+02
1.E+03
1.E+04
1.E+05
1.E+06
1.E+14 1.E+16 1.E+18 1.E+20
Electron mobility (cm
2
/V-s)
Doping concentration (cm
-3
)
This work (100K)
Sotoodeh et al. 2000
Arora et al. 1982
(a) (b)
1.E+02
1.E+03
1.E+04
1.E+05
1.E+06
1.E+14 1.E+16 1.E+18 1.E+20
Electron mobility (cm
2
/V-s)
Doping concentration (cm
-3
)
This work (200K)
Sotoodeh et al. 2000
Arora et al. 1982
1.E+04
1.E+05
10 100 1000
Electron mobility (cm
2
/V-s)
Temperature (K)
Takeda et al. 1981
This work
(c) (d)
Fig. 4. Electron mobility in In
0.53
Ga
0.47
As as a function of (a) doping at T
L
=77K, (b) T
L
=100K,
(c) T
L
=200K and (d) temperature at N=1.5e
16
cm
-3
(Source: Menon et al., 2008a)
The hole mobilities for InP-based material are similar to those seen for GaAs and AlGaAs
(Datta et al., 1998). Fig. 5 (a) till Fig. 5 (c) show the fitted results versus calculated hole
mobility for T=77K, 100K and 200K. Fig. 5(d) shows the hole mobility as a function of
temperature in InGaAs. Good agreement is obtained for temperatures ≥200K.
Carrier mobility decreases sharply when doping density is increased for low doping
densities (less than 1e18 cm
-3
). For high doping densities, the mobility tends to decrease
more slowly and shows a saturated trend. Similarly, for low operating temperatures
(<100K), the carrier mobility tends to increase with increment in temperature. However,
Advances in Photodiodes
80
above 100K, the mobility shows a downward bowing trend as temperature is increased.
Therefore, it has been proven that the fitted parameters are reliable and match available
experimental or theoretical data. These carrier mobility equations were used in the
development of an ILPP based on InGaAs absorption layer.
1.E+01
1.E+02
1.E+03
1.E+04
1.E+05
1.E+14 1.E+16 1.E+18 1.E+20
Hole mobility (cm
2
/V-s)
Doping concentration (cm
-3
)
This work (77K)
Sotoodeh et al. 2000
1.E+01
1.E+02
1.E+03
1.E+04
1.E+05
1.E+14 1.E+16 1.E+18 1.E+20
Hole mobility (cm
2
/V-s)
Doping concentration (cm
-3
)
This work (100K)
Sotoodeh et al. 2000
(a) (b)
1.E+01
1.E+02
1.E+03
1.E+04
1.E+05
1.E+14 1.E+16 1.E+18 1.E+20
Hole mobility (cm
2
/V-s)
Doping concentration (cm-3)
This work (200K)
Sotoodeh et al. 200
0
1.E+01
1.E+02
1.E+03
1.E+04
1.E+05
10 100 1000
Hole mobility (cm
2
/V-s
)
Temperature (K)
This work
Sotoodeh et al. 2000
(c) (d)
Fig. 5. Hole mobility in In
0.53
Ga
0.47
As as a function of (a) doping at T
L
=77K, (b) T
L
=100K, (c)
T
L
=200K and (d) temperature at N=1e
17
cm
-3
(Source: Menon et al., 2008a)
4. Numerical modeling
4.1 Device material selection
InGaAs is specified as the absorbing material in ATLAS by setting the mol fraction of
quaternary material In
1-x
Ga
x
As
y
P
1-y
where x=0.43 and y=1 to form In
0.53
Ga
0.47
As. It is used as
the absorbing layer with a thickness of 3 μm and at this depth, 83% of the optical power will
be absorbed by the device based on the InGaAs absorption coefficient, α=6070 /cm at λ=1.55
µm. The absorbing layer is also given an n-type background doping of 1e11 cm
-3
with a
uniform doping profile.
The p+ wells in the ILPP device will be formed using zinc SOD hence the junction
parameters were obtained from available experimental data. Kamanin et al. (1996) formed a
p+ junction in InGaAs using thin film zinc-based polymer diffusion at a temperature of
500˚C for 30 minutes to obtain junction depth of 0.8 µm and dopant surface concentration of
~8x10
18
cm
-3
. Similarly, in the ILPP model, the junction depth of the p+ wells was selected to
Modeling and Optimization of Three-Dimensional Interdigitated Lateral
p-i-n Photodiodes Based on In
0.53
Ga
0.47
As Absorbers for Optical Communications
81
be 0.8 µm with a surface doping level of 4x10
18
cm
-3
. The n+ wells in InGaAs is proposed to
be formed using selenium-doped SOD. Penna et al. (1985) performed ion implantation of Se
into InGaAs to form a junction of ~0.4 µm deep. Alternatively, selenium-doped SOD have
been used on GaAs to obtain junctions with a depth of 1.3 µm and surface concentration of
6x10
18
cm
-3
(Filmtronics, 2006). In this ILPP model, the junction depth of the selenium-doped
n+ wells were set to be 0.8 µm with a surface concentration of 1x10
19
cm
-3
to produce a
uniform electric field between the alternating junctions.
Spin-on glass (SOG) will be used as the passivation layer for InGaAs. It will serve to protect
the junction surfaces as well as for planarizing the device. In this model, a 0.1-µm thick SiO
2
was used to reflect the presence of SOG on top of the SOD-doped InGaAs absorbing layer.
Finally, the alternating interdigitated fingers were modelled as gold-based.
4.2 Design of device structure
The electrode finger width/ spacing and length are 1 μm and 50 μm respectively. The
device’s active area is 41 x 5 x 50 μm
3
with a total of 10 pairs of interdigitated electrodes. The
junction depth for both the p+/n+ wells are 0.8 μm respectively and lateral diffusion per
well is 0.3 μm. The compensation ratio θ (N
A
/N
D
) is set at 0.1 where donor concentration,
N
D
=1e
19
cm
-3
. Fig. 6 shows the potential of the InGaAs ILPP three-dimensional model upon
illumination of an optical beam with spectral width of 41 μm, optical spot power of 10
W/cm2 and wavelength, λ=1.55 μm.
Fig. 6. Potential within the InGaAs ILPP 3D model upon illumination of an optical beam
4.3 Characterization equations
The ILPP dark current, I
D
is given by:
(1)
A
B
qV
kT
DSAT
II e
=
− (8)
where I
SAT
is the reverse saturation current, q is the electron charge, V
A
is the applied bias
voltage, k
B
is the Boltzmann constant and T is the absolute temperature in Kelvin.
Illuminating the photodiode with optical radiation, shifts the I-V curve by the amount of
photocurrent (I
P
). Thus, the total current I
T
is given by I
T
= I
D
+ I
P
.
Advances in Photodiodes
82
The ILPP responsivity, R is calculated using:
1.24
T
S
I
R
I
λ
⎛⎞
=
⎜⎟
⎝⎠
(9)
where I
S
is the source photocurrent and λ is the optical wavelength.
The simulator calculates the real (I
R
) and imaginary (I
I
) component current values for every
equivalent AC frequency value. Hence, the -3dB frequency (f
-3dB
) is calculated using the
following equation:
0
3
20 * log
R
dB
R
I
f
I
−
⎛⎞
⎜⎟
=
⎜⎟
⎝⎠
(10)
where I
R0
is the real component current at low AC frequencies which is normally a constant
value. Finally, the ILPP signal-to-noise ratio (SNR) is calculated using the following equation
2
p
2q(I ) 4 /
p
DBL
i
SNR
IB kTBR
=
++
(11)
where I
P
is the average photocurrent, B is the bandwidth and R
L
is the load resistance set to
be as 50 Ω (Menon et al. 2010).
4.4 Device characterization results
A cross section of the 3D device is shown in Fig. 7 (a) portraying the net doping within the
device. Dark current value at 5 V was measured to be 21 nA and is much higher than that
achieved by conventional InGaAs VPDs (in pA values) (Huang et al., 2007) due to the
absence of a capping layer such as InP to reduce the surface leakage current. However, the
modelled device’s dark current is comparable to conventional ILPP that have been
fabricated before as portrayed in Fig. 7 (b). The ideality factor, n was measured to be ~1 and
the series as well as dynamic resistances were measured to be 43 Ω and ~238 MΩ
respectively. Breakdown voltage was >40 V.
The capacitance values recorded at a bias voltage of 5V was 2.87 nF and this value is much
higher than the capacitance values achieved by conventional ILPP devices due to the smaller
intrinsic region width (1 μm in this design versus 3 μm in (Yasuoka et al., 1991)) and longer
electrode fingers in the current design (50 μm in this design versus 20 μm and 47 μm in
(Tiwari et al., 1992) and (Lee et al. 1989)). The C-V results are shown in Fig. 8(a).
Dark and photo-IV curves for the optical beam at λ=1.55 μm and P=dark (0), 1, 5, 10, 50, 100
and 200 Wcm
-2
is shown in Fig. 8 (b). At operating voltage of 5V, the photocurrent increased
from 0.011 mA (P=1 Wcm
-2
) to 2.28 mA (P=200 Wcm
-2
).
Fig. 9(a) is the responsivity curve of the modelled device at P=10 Wcm-2, V=5V and the
wavelength is swept up from 0.75 μm until 1.75 µm. In optical communication networks,
data signals are usually transmitted at λ=1.31 μm whereas video signals are transmitted at
λ=1.55 μm. At both these wavelengths, the responsivity was measured to be 0.55 A/W and
0.56 A/W respectively which is equivalent to an external quantum efficiency of 44 %. These
values are comparable to the experimentally developed InGaAs ILPP devices but are much
smaller than VPDs due to the electrode shadowing effect in ILPP designs. Fig. 9(b) shows
Modeling and Optimization of Three-Dimensional Interdigitated Lateral
p-i-n Photodiodes Based on In
0.53
Ga
0.47
As Absorbers for Optical Communications
83
(a) (b)
Fig. 7. The ILPP’s (a) cross section of the 3D device portraying the net doping within the
device and (b) dark current trend (Source: Menon et al. 2010)
(a) (b)
Fig. 8. The ILPP’s (a) C-V trend and (b) dark and photo-IV curves for the optical beam at
λ=1.55 μm and P=dark (0), 1, 5, 10, 50, 100 and 200 Wcm
-2
(Source: Menon et al. 2010)
the -3dB frequency of 8.93 GHz achieved by the model and it is 16% higher than
conventional ILPP prototypes (Yasuoka et al., 1991; Tiwari et al., 1992; Lee et al. 1989; Jeong
et al., 2005) mainly due to the smaller intrinsic region width utilized in this design.
The dark current noise is 0.06 fA/√Hz, quantum noise is 0.33 nA/√Hz and Johnson noise is
2.96 pA/√Hz with load resistance of 50 Ω where the Johnson noise is the highest noise
contributor. The device SNR was calculated to be ~36 dB and dynamic range ranges from -
16 dBm until 17.9 dBm (Menon et al. 2010).
Advances in Photodiodes
84
(a) (b)
Fig. 9. The ILPP’s (a) responsivity curve of the modeled device at P=10 Wcm-2, V=5V and
(b) the -3dB frequency (Source: Menon et al. 2010)
5. Statistical modeling
5.1 Fractional Factorial Design
Fractional factorial design (FFD) was used to identify the factors that affect the device
responsivity significantly. Next, the significant factors were used to develop a general linear
model to predict the responsivity of different ILPP models. In this research, seven factors i.e.
InGaAs absorbing layer thickness (T), finger width (FW), finger spacing (FS), junction depth
(JD), finger length (FL), bias voltage (V) and optical beam power (P) were investigated, each
of which were tested at two levels. A one-quarter fractional factorial design (resolution IV)
comprising of 32 runs (Montgomery, 2001) was carried out to obtain information on the
effects of the investigated factors. Fig. 10 displays the ILPP model where the chosen factors
are highlighted. Table 3 lists the factors and their respective values which were used in the
DOE. A well-known statistical software, Minitab was used to obtain the statistical results
(Menon et al. 2008b).
The normal probability plots and the pareto chart for the device responsivity are shown in Fig.
11 (a) and Fig. 11 (b). The significant factors which include interactive factors are highlighted
in red in the normal probability plots. Significant or active effects are larger and further away
from the fitted line than inactive effects which tend to be smaller and centered around zero, the
mean of all the effects. The pareto charts display the absolute value of the effects.
In the normal probability plot for the device responsivity, the most significant factor that
affects this response is the InGaAs thickness (A), followed by the finger width (B), finger
spacing (C) and the interaction factor between InGaAs thickness and finger width (A*B).
These significant factors prove that when the absorbing layer thickness is increased, the
absorbed optical power, P(x) at a depth of x increases according to the equation P(x)=P
0
(1-e
1-
α(x)
)where P
0
is the incident optical power and α is the absorbing coefficient. Decrement in
the electrode finger width (FW) and increment in the electrode finger spacing (FS) increases
the total illumination area from the top of the device hence increasing the total generated
photocurrent within the device and subsequently increases the device responsivity.
Modeling and Optimization of Three-Dimensional Interdigitated Lateral
p-i-n Photodiodes Based on In
0.53
Ga
0.47
As Absorbers for Optical Communications
85
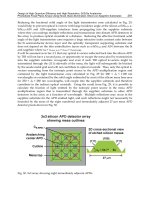
Fig. 10. Schematic diagram of the ILPP model. The chosen factors are highlighted in the
diagram.
Variable (Code) Factor name
-1 Level
(Low)
+1 Level
(High)
A(T) InGaAs thickness (µm) 1 3
B(FW) Finger width (µm) 1 3
C(FS) Finger spacing (µm) 1 3
D(JD) Junction depth (µm) 0.4 0.8
E(V) Voltage (V) 2 5
F(P) Beam power (Wcm
-2
) 1 10
G(FL) Finger length (µm) 20 50
Table 3. Fractional factorial design factors and values.
(a) (b)
Fig. 11. (a): Normal probability plot for the responsivity. The factors highlighted in red are
significant and (b) Pareto chart for the responsivity displaying absolute values of the factor
effects in descending order.
Advances in Photodiodes
86
Next, the significant factors for the device responsivity was used to develop a reduced
model at a confidence level of 95%. This was done by screening out the insignificant effects
from the full model and evaluating the fit of the new reduced model using analysis of
variance (ANOVA). The main effects as well as significant two-way interaction effects which
are significant gives a p-value. If p<0.05, then the effect or term is significant whereas if
p>0.05, then the terms are insignificant and hence can be excluded from the reduced model.
From Fig. 16 and Fig. 17, the new reduced model will now comprise of the main effects (A, B
and C) as well as two-way and three-way interactive factors which include these main
effects. Table 4 lists the analysis of variance for the device responsivity using the factorial fit
from the reduced model (Menon et al., 2009).
Term
Effect Coefficient
p-value
Constant
0.3564 0.000
T
0.2506 0.1253 0.000
FW
-0.2095 -0.1047 0.000
FS
0.0930 0.0465 0.000
T*FW
-0.0722 -0.0361 0.000
T*FS
0.0324 0.0162 0.000
FW*FS
-0.0017 -0.0008 0.034
T*FW*FS
-0.0009 -0.0005 0.221
Table 4. Analysis of variance for responsivity (S=0.002, R
2
=99.9%, R
2
(adj)=99.9%).
All the terms have a p-value of <0.05 except the last term (T*FW*FS) where the p-value is
0.221 deeming it insignificant. The S, R
2
and adjusted R
2
are measures of how well the model
fits the data where S represents how far the standard distance data values fall from the
regression line, R
2
describes the amount of variation in the observed response values and
adjusted R
2
is a modified R
2
that has been adjusted for the number of terms in the model.
For a given fit, the lower the value of S and the higher the values of R
2
and adjusted R
2
, the
better the equation predicts the response. In this model, values of S, R
2
and adjusted R
2
are
0.002 and 99.9% respectively proving that a robust model for predicting the InGaAs ILPP
responsivity has been established. Next, the coefficients of each significant term is used to
construct a regression or analytic equation representing the relationship between the device
responsivity and the design factors. The regression equation which defines the responsivity
of the InGaAs ILPP is as follows (Menon et al., 2009):
Modeling and Optimization of Three-Dimensional Interdigitated Lateral
p-i-n Photodiodes Based on In
0.53
Ga
0.47
As Absorbers for Optical Communications
87
()
0.3564 0.1253( ) 0.1047( )
0.0465( ) 0.0361( ) ( )
0.0162( ) ( ) 0.0008( ) ( )
res
p
cc
ccc
cc c c
yTFW
FS T FW
TFS FWFW
=
+−
+−
+−
(12)
where X
c
is the factor value in coded units and it is related to the actual factor value X
a
by
()
2
()
2
HL
c
a
HL
XX
X
X
XX
+
⎡
⎤
−
⎢
⎥
⎣
⎦
=
−
(13)
where X
L
and X
H
are the factor values at the low level and high level as given in Table 1. Eq.
(13) can be rearranged to obtain the value of X
c
:
()()
22
HL HL
ca
XX XX
XX
+−
⎧⎫
=+
⎨⎬
⎩⎭
(14)
The coded values for all the factors which defines the device responsivity is calculated and
is given as follows:
() 2 ()
ca
TT
=
+ (15)
()2()
ca
FW FW=+
(16)
() 2()
ca
FS FS
=
+ (17)
Eqs. (15) to (17) are replaced into Eq. (12) to obtain the general linear model which defines
the responsivity of an InGaAs ILPP in uncoded units.
()
0.143106 0.163188( ) 0.0327433( )
0.0138567( ) 0.0351578( ) ( )
0.0171634( ) ( ) 0.000096781( ) ( )
res
p
aa
aaa
aa aa
y
TFW
FS T FW
TFS FWFS
=
+−
+−
+−
(18)
where T
a
, FW
a
, FS
a
≠ 0.
5.2 Model verification
Eq. (18) was used to recalculate the responsivity of the numerical models used in the 32
runs of the fractional factorial DOE and the comparative results between the simulated
and calculated values as well as the error ratios are displayed in Fig. 12. Good correlation
is observed between the two values and the error ratios are less than 3% for all the 32
models. Table 5 lists the factor values of some InGaAs ILPP designs from previous
experimental work. The responsivity of these devices were recalculated using Eq. (18) and
error ratios between 16% to 27% were obtained between the actual and calculated
responsivity values. The results are displayed in Fig. 13. The high error ratios could be
attributed to the drift-diffusion model used in the simulation for ILPP devices whereas
the actual devices were fabricated using different techniques where carrier transport
model may vary. The simulated model also does not take into consideration fabrication
Advances in Photodiodes
88
defects and reflects an ideal ILPP device. Eq. (18) is a new analytic equation which can be
used to predict the responsivity of InGaAs ILPP as a function of the device design factors
prior to fabrication.
No T (µm) FW (µm) FS(µm) Reference
1 1.7 1 3 Yasuoka et al., 1991
2 1.4 20 2 Tiwari et al., 1992
3 2 2 3 Lee et al., 1989
Table 5. Factor values from periodical literature
Fig. 12. Comparitive results between the simulated and calculated responsivity values from
Eq. (18) as well as the error ratios.
Modeling and Optimization of Three-Dimensional Interdigitated Lateral
p-i-n Photodiodes Based on In
0.53
Ga
0.47
As Absorbers for Optical Communications
89
Fig. 3. Comparison between the actual responsivity versus calculated responsivity values
using Eq. (18) for past experimentally developed devices.
5.3 Statistical optimization
A statistically optimized model for the InGaAs ILPP device was obtained by specifying the
target range values that would like to be attained for each device characteristic. This is
shown in Table 6. The optimized design factors that must be chosen in order to achieve the
optimal target characteristic values as stipulated in Table 6 are given in Table 7. These
optimized design factors can be used in the fabrication of InGaAs-based ILPP devices in the
future.
Characteristics Units
Low Target
Value
High Target
Value
Optimal Target
Value
Responsivity A/W 0.5 1 0.68
-3dB frequency GHz 5 10 7.43
SNR dB 10 50 12.11
Table 6. Target and optimal characteristic values obtained statistically
Advances in Photodiodes
90
Variable
(Code)
Factor name -1 Level
(Low)
+1 Level
(High)
Optimal
Target Value
A(T) InGaAs thickness (µm)
1 3 3
B(FW) Finger width (µm)
1 3 1
C(FS) Finger spacing (µm)
1 3 3
D(JD) Junction depth (µm)
0.4 0.8 0.8
E(V) Voltage (V)
2 5 5
F(P) Beam power (Wcm
-2
)
1 10 1.14
G(FL) Finger length (µm)
20 50 20
Table 7. Target design factors for a statistically optimized InGaAs ILPP device
6. Conclusion
A novel interdigitated lateral p-i-n photodiode (ILPP) model utilizing In
0.53
Ga
0.47
As as the
absorbing layer was developed numerically and optimized statistically using fractional
factorial methodology. Seven model factors were investigated and an analytical expression
to predict the device responsivity was defined. Comparison between the simulated and
calculated responsivity values yielded error ratios of less than 3%. Finally, a statistically
optimized InGaAs ILPP model with -3dB frequency of 7.5 GHz, responsivity of 0.61 A/W
and SNR of 20 dB was developed at an operating voltage of 5 V, wavelength of 1.55 µm and
optical input power of 10 Wcm
-2
. The modeled device provides a cheap and easy solution to
cater for the increasing demand of FTTH-PON users
7. Acknowledgement
The authors would like to thank the Malaysian Ministry of Science, Technology and
Innovation (MOSTI), the Malaysian Ministry of Higher Education (MOHE) and Universiti
Kebangsaan Malaysia (UKM) for sponsoring this project under grants IRPA 03-02-02-0069-
EA231 and UKM-OUP-NBT-27-119/2010
8. References
Adachi, S. (1992). Physical properties of III-V Semiconductor Compounds: InP, InAs, GaAs, GaP,
InGaAs and InGaAsP, New York: Wiley Interscience.
Arora, N. D., Hauser, J.R. & Roulstan, R. J. (1982). Electron and hole mobilities in silicon as a
function of concentration and temperature. IEEE Transactions on Electron Devices
ED-29: 292.
Modeling and Optimization of Three-Dimensional Interdigitated Lateral
p-i-n Photodiodes Based on In
0.53
Ga
0.47
As Absorbers for Optical Communications
91
Barnes, J. J., Lomax, R. J. & Haddad, G. I. (1996). Finite element simulation GaAs MESFET
with lateral doping profiles and submicron gates. IEEE Transactions on Electron
Devices ED-23: 1042-1048.
Caughey, D. M. & Thomas, R. E. (1967). Carrier mobilities in silicon empirically related to
doping and field. Proceedings of the IEEE, 2192-2193.
Chin, W. L., Osotchan, T. & Tansley, T. L. (1995). Electron mobility in In(0.53)Ga(0.47)As as a
function of concentration and temperature. Microelectronics Journal 26: 653-657.
Conklin, T., Naugle, S., Shi, S., Roenker, K. P., Frimel, S. M. Kumar, T & Cahay, M. M. (1996).
Inclusion of tunneling and ballistic transport effects in an analytical approach to
modeling of NPN InP based heterojunction bipolar transistors. Superlattice
Microstructures 18: 1-12.
Cvetkovic, M., Matavulj, P., Radunovic, J. & Marincic, A. (2000). An InGaAs P-I-N
photodiode model: Description and implementations in the analysis of the 1.55 μm
lightwave system. Journal of Optical Communications 31(3): 35-39.
Datta, S., Shi, S., Roenker, K. P., Cahay, M. M. & Stanchina, W.E. (1998). Simulation and
design of InAlAs/InGaAs pnp heterojunction bipolar transistors. IEEE Transactions
on Electron Devices, 45(8): 1634-1643.
Dentan, M & Cremoux, B. D. (1990). Numerical simulation of the nonlinear response of a p-i-n
photodiode under high illumination. Journal of Lightwave Technology 8: 1137-1144.
Diadiuk, V. & Groves, S. H. (1985). Lateral photodetectors on semi-insulating InGaAs and
InP. Applied Physics Letters 46(2): 157-158.
Dildey, F., Treichler, R., Amann, M C., Schier, M. & Ebbinghaus, G. (1989). Replacement of
magnesium in InGaAs/InP heterostructures during zinc diffusion. Applied Physics
Letters 55(9): 876
Ehsan, A. A., Shaari, S. (2001). Fabrikasi dan pencirian diodfoto planar P-I-N silikon untuk OEIC.
Technical Report No MTF 004. Universiti Kebangsaan Malaysia.
Feng, S. & Lu, C. (2004). Influence of InP cap layer on photo-responsivity of InP/InGaAs
PIN detector. Proceedings of the 7th International Conference on Solid-State and
Integrated Circuits Technology, 2332-2334.
Filmtronics, Incorporated. (2006a). Experimental Selenium Film Se-965. Datasheet. USA.
Filmtronics, Incorporated. (2006b). Experimental Zinc Zn-980. Datasheet. USA.
Gangopadhyay, U., Park, S., Kim, K., Park, J., Kim, D. & Yi, J. (2003). Large area
monocrystalline silicon solar cell using SOD. Proceedings of 3rd World Conference on
Photovoltaic Energy Conversion, 1431-1434.
Giziewicz, W., Prasad, S. & Fonstad, C. G. Jr. (2004). Lateral p-i-n photodetectors fabricated in
a standard commercial GaAs VLSI process. Proceedings of IEEE on Sensors, 284-287
Goodrich Corporation. (2006). What is InGaAs?. Application Note 4110-0039: 1-3.
Ho, C L., Wu, M C., Ho, W J. & Liaw, J W. (2000). Comparison between planar
InP/InGaAs/InP pin photodiodes with symmetrical and asymmetrical doping
profiles. IEEE Proceedings on Optoelectronics 147(2): 109-113.
Huang, Z. (2003). Multi gigahertz InGaAs/InP inverted MSM photodetectors for photoreceiver and
waveguide applications. Ph.D Thesis. Georgia Institute of Technology, Atlanta.
Jacob, B., Witzigmann, B., Klemenc, M. & Petit, C. (2005). A TCAD methodology for high-
speed photodetectors. Solid -State Electronics 49: 1002-1008.
Advances in Photodiodes
92
Jeong, T.W.; Iiyama, K.; Takamiya, S. (2005). Two terminal InP/InGaAs heterojunction
phototransistor with lateral photodiode as sensing section. International Conference
on Indium Phosphide and Related Materials, 250-253.
Kamanin, A. V., Mokina, I. A., Shmidt, N. M., Busygina, L. A., & Yurre, T. A. (1996).
Polymer diffusants in III-V semiconductor compounds technology. Proceedings of
the Eighth International Conference on Indium Phosphide and Related Materials IPRM
'96, 334-337
Kim, K. S. (2003). On the evolution of PON-based FTTH systems. Information Sciences 149:
21-30.
Koester, S. J., Schaub, J. D., Dehlinger, G & Chu, J. O. (2006). Germanium-on-SOI infrared
detectors for integrated photonic applications. IEEE Journal of Selected Topics in
Quantum Electronics 12(6): 1489-1502.
Konno, K., Matsushima, O., Navarro, D. & Miura-Mattausch, M. (2004). High frequency
response of p-i-n photodiodes analyzed by an analytical model in Fourier space.
Applied Physics Letters 96(7): 3839-3844.
Lange, M. J., Dixon, & Olfsen, G. H. (2000). p-n junction formation in 3- and 4-inch indium
gallium arsenide epitaxial wafers using a doped glass diffusion source. Conference
on Lasers and Electro-Optics (CLEO 2000), 351-352.
Lauterbach, C. (1995). Zinc diffusion in InP from spin-on films of various zinc
concentrations. Semiconductor Science and Technology 10: 500-503.
Lee, B., Yoon, H., Hyun, K. S., Kwon, Y. H. & Yun, I. (2004). Investigation of manufacturing
variations of planar InP/InGaAs avalanche photodiodes for optical receivers.
Microelectronics Journal 35(8): 635-640.
Lee, C. D & Forrest, S. R. (1991). In
0.53
Ga
0.47
As/InP heterojunction with low interface defect
densities. Journal of Applied Physics 69: 342.
Lee, C H. & Choi, K M. (2007). Fiber to the home. IEEE Proceedings. 937-938
Lee, W. S., Kitching, S. A. & Bland, S. W. (1989). Monolithic integration of fully ion-
implanted lateral GaInAs pin detector/InP JFET amplifier for 1.3-1.55 µm optical
receivers. Electronics Letters 25(8): 522-523.
Li, R., Schaub, J. D., Csutak, S. M., & Campbell, J. C. (2000). A high-speed monolithic silicon
photoreceiver fabricated on SOI; IEEE Photon. Technol. Lett. 12:1046-1048.
Loo, E. C. H. 2007. Pembangunan diodfoto planar silicon dan InGaAs dengan elektrod H
N
dan H
P
.
Ph.D. Thesis. Universiti Kebangsaan Malaysia.
Menon, P. S. (2005). Pembangunan diodfoto planar p-i-n silikon (Development of silicon-based p-i-n
photodiode). MSc Thesis. Universiti Kebangsaan Malaysia.
Menon, P. S., Kandiah, K., Ehsan, A. A. & Shaari, S. (2009). The development of a new
responsivity prediction model for In(0.53)Ga(0.47)As interdigitated lateral PIN
photodiode. Journal of Optical Communications, 30, 2009: 2-6.
Menon, P. S., Kandiah, K. & Shaari, S. (2008a). Concentration and temperature-dependent
low-field mobility model for In0.53Ga0.47As interdigitated lateral PIN PD. IEICE
Electronics Express 5(9): 303-309.
Menon, P. S., Kandiah, K. & Shaari, S. (2008b). SNR prediction model of an In(0.53)Ga(0.47)As
interdigitated lateral p-i-n photodiode. Proceedings of the 2008 IEEE International
Conference on Semiconductor Electronics, ICSE2008 (Johor Bahru), 292-296.
Menon, P. S., Kandiah, K., Ehsan, A. A. & Shaari, S. (2010). Concentration-dependent
minority carrier lifetime in an In(0.53)Ga(0.47)As interdigitated lateral PIN
Modeling and Optimization of Three-Dimensional Interdigitated Lateral
p-i-n Photodiodes Based on In
0.53
Ga
0.47
As Absorbers for Optical Communications
93
photodiode based on spin-on chemical fabrication methodology. International
Journal of Numerical Modelling: Electronic Networks, Devices and Fields. DOI:
10.1002/jnm.792
Menon, P. S. (2008). Pembangunan diodfoto planar p-i-n In(0.53)Ga(0.47)As dengan elektrod
berselang-seli (Development of an In(0.53)Ga(0.47)As interdigitated lateral p-i-n
photodiode). Ph.D Thesis. Universiti Kebangsaan Malaysia.
Montgomery, D.C. (2005). Design and analysis of experiment. 6th Edition. New York: John Wiley.
Murray, S. L., Newman, F. D., Wilt, D. M., Wanlass, M. W., Ahrenkiel, P., Messham, R. &
Siergiej, R. R. (2003). MOCVD growth of lattice-matched and mismatched InGaAs
materials for thermophotovoltaic energy conversion. Semiconductor Science and
Technology 18: 202-208.
Oh, J., Im, K., Ahn, C-G., Yang, J-H., Cho, W-J., Lee, S. & Park, K. (2004). Ultra shallow and
abrupt n+–p junction formations on silicon-on-insulator by solid phase diffusion of
arsenic from spin-on-dopant for sub 50 nm Si metal-oxide-semiconductor devices.
Materials Science and Engineering B 110(2): 185-189.
Ohtsuka, K., Ohishi, T., Abe, Y., Sugimoto, H., Matsui, T. & Ogata, H. (1988). High purity
In
0.53
Ga
0.47
As layer grown by liquid phase epitaxy. Journal of Crystal Growth 89: 391.
Parker, D.G. (1988). The theory, fabrication and assessment of ultra high-speed photodiodes.
GEC Journal of Research 6(2): 106-117.
Pearsall, T. P. (1981). Alloy scattering effects and calculated mobility in n-type Ga
0.47
In
0.53
As.
Electronics Letters 17: 169.
Penna, T., Tell, B., Liao, A. S. H., Bridges, T. J. & Burkhardt, G. (1985). Ion implantation of Si
and Se donors in In
0.53
Ga
0.47
As. Journal of Applied Physics 57(2): 351-354.
Posthuma, N. E., van der Heide, J., Flamand, G. & Poortmans, J. (2007). Emitter formation
and contact realization by diffusion for germanium photovoltaic devices. IEEE
Transactions on Electron Devices 54(5): 1210-1215.
Sabella, R. & Merli, S. (1993). Analysis of InGaAs P-I-N photodiode frequency response.
IEEE Journal of Quantum Electronics 29:906-916.
Saleh, B. E. A. & Teich, M.C. (1991). Fundamentals of photonics. USA: John Wiley & Sons
Incorporated.
Schow, C.L., Li, R., Schaub, J.D. & Campbell, J.C. (1999). Design and implementation of
high-speed planar Si photodiodes fabricated on SOI substrates. IEEE Journal of
Selected Topics in Quantum Electronics 35(10): 1478-1482.
Sipahi, L.B. & Sanders, T. J. (2002). Modeling, simulation and comparative analysis of RF
bipolar and MOS low noise amplifiers for determining their performance
dependence on silicon. Proceedings of the fifth international conference on modeling and
simulation of Microsystems MSM2002, 155-158.
Srivastava, S. & Roenker, K.P. (2003). Numerical modeling study of the InP/InGaAs uni-
travelling carrier photodiode. Solid -State Electronics 48: 461-470.
Sze, S.M. 2002. Semiconductor Devices, Physics and Technology. 2nd Edition. New York: John
Wiley & Sons.
Tiwari, S., Burroughes, J., Milshtein, M. S., Tischler, M. A. & Wright, S. L. (1992). Lateral
Ga(0.47)In(0.53)As and GaAs p-i-n photodetectors by self-aligned diffusion. IEEE
Photonics Technology Letters 4(4): 396-398.
Tsang, W. T. (1985). Semiconductors and Semimetals. In Lightwave Communications
Technology. New Jersey: Academic Press.
Advances in Photodiodes
94
Silvaco International. (2004). ATLAS User’s Manual. 10th Edition. USA: SILVACO
International Incorporated.
Sotoodeh, M., Khalid, A. H. & Rezazadeh, A. A. (2000). Empirical low-field mobility model
for III-V compounds applicable in device simulation codes. Journal of Applied
Physics 87: 2890-2900.
Takeda, Y., Littlejohn, M. A. & Hauser, J. R. (1981). Electron Hall mobility calculation and
alloy scattering in In
0.53
Ga
0.47
As. Electronics Letters 17: 377.
Tashima, M. M., Cook, L. W. & Stillman, G. E. (1981). Room temperature electron diffusion
lengths in liquid phase epitaxial InGaAsP and InGaAs. Applied Physics Letters 39:
960-961.
Yasouka, N., Sanada, T., Hamaguchi, H., Makiuchi, M., Mikawa, T., Kuramata, A., Wada,
O., Deri, R.J. (1991). High-speed monolithic coherent optical receiver integrated on
InP substrate. Electronics Letters 27(22): 2020-2022.
Yuan, C-A., Han, C. N., Yew, M-C.,Chou, C-Y. & Chiang, K-N. (2005). Design, analysis and
development of novel three-dimensional stacking WLCSP. IEEE Transactions on
Advanced Packaging 28:387-396.
Zant, P. V. (2000). Microchip fabrication. USA: McGraw-Hill.
Zhao, X. (2006). Carrier transport in high-speed photodetectors based on two-dimensional-gas. Ph.D
Thesis. Drexel University.
5
Simulation of Small-pitch High-density
Photovoltaic Infrared Focal Plane Arrays
Mikhail Nikitin
1
, Albina Drugova
2
,
Viacheslav Kholodnov
2
and Galina Chekanova
1
1
Federal State Unitary Enterprise ALPHA
2
Institute of Radio Engineering and Electronics Russian Academy of Sciences
Russia
1. Introduction
Scanning and starring photovoltaic infrared focal plane arrays (PV IRFPAs) based on
ternary alloys Hg
1-x
Cd
x
Te (Whicker, 1992; Triboulet & Chatard, 2000; Baker & Maxey, 2001;
Norton, 2002; Kinch, 2007) and binary compound InSb and its alloys (Glozman et al., 2006)
are considered as the most sensitive, flexible and perspective for detection of infrared
radiation in spectral ranges 1.5-2.7 μm Short-Wave IR (SWIR), 3-5.5 μm Mid-Wave IR
(MWIR), 8-14 μm Long-Wave IR (LWIR) and longer than 14 μm Very Long-Wave IR
(VLWIR). Those FPAs are updated and improved continuously and move gradually from
linear arrays such as 288×4 (TDI); 480×(4-8) (TDI); 768×8 (TDI) pixels to mid-format (sub-TV
and TV) including but not limited 64×64; 320×256; 384×288; 640×512 pixels and finally to
megapixel format (High Definition TV) like 1280×768; 1280×1024 pixels and more.
Nowadays all manufacturers offer LWIR PV FPA with peak wavelength λ
p
≈ 8.5±0.5 μm. It
means that scanning thermal imagers (TI) based on old LWIR photoconductive (PC) linear
arrays (λ
p
≈ 11 μm) covers 8-14 μm atmospheric “window” of transparency totally whereas
TI based on LWIR PV FPA with λ
p
≈ 8.5±0.5 μm covers left (shorter) part of that “window”
only. As the result TIs based on LWIR PC linear arrays (λ
p
≈ 11 μm) allow adequate
visualizing of cold landscape (scene) with temperatures as low as minus 60
0
C. Thermal
Imagers based on LWIR PV FPA with λ
p
≈ 8.5±0.5 μm can visualize adequately cold
landscape at scene temperatures higher than minus 30
0
C (even higher than minus 20
0
C).
Full replacement of scanning type TI by starring type TI will take place when extended
LWIR PV FPA with λ
p
shifted to 10-11 μm at T
op
=80-100 K will become affordable.
Megapixel high performance IRFPA having extended spectral covering with λ
p
=10-11 µm at
T
op
=80-100 K could be preferable to create future TI systems.
Increasing of array format along with improvement in performance is general development
trend in IRFPA technology. It is accompanied inevitably by decreasing of pixel size and
pixel pitch to minimal size reasonable from point of view of infrared physics to provide the
best resolution and producing comfortable imaging with electro-optic (EO) system. Pitch in
small-pitch PV IRFPA can be equal to from 10 μm to 20 μm. PV arrays based on InSb and its
alloys or Hg
1-x
Cd
x
Te alloys are fabricated often on single layer (substrate) that is common
for all pixels of array.
Advances in Photodiodes
96
Implementation of large format high performance PV IRFPAs covering above mentioned
spectral ranges both single-color and multi-color requires comprehensive simulation of
photodiodes (PD) performance depending on base material layers properties, interfaces
parameters, array topology, array design and operating conditions. Analysis of MWIR and
LWIR PD performance at operating temperatures from 77 K to 100 K and higher is needed
also due to strong tendency to use so called HOT (higher operating temperature) mode for
lowering weight and power consumption in perspective TIs with cryogenically cooled
megapixel IRFPAs.
Perhaps novel Hg
1-x
Cd
x
Te FPAs will be based on photodiodes with p-n junction opposite to
usually used n
+
-p junction. PD with optimal p-n junction could have lower dark current
value than same size n
+
-p junction. It is desirable for adequate multiplexing of PD arrays to
Silicon Read-out Integrated Circuits (ROICs).
2. Key aspects of IRFPA performance requiring simulation
1. Simulation of IR photodiodes detectivity and responsivity depending on cut-off
wavelength, type of junction: n
+
-p junction or p-n junction and operating temperatures
from 77 K to 100 K and higher.
2. How does recombination rate at nearest interface to PD absorber impact on PD dark
current?
3. Development of theoretical approach producing analytical expressions for collection of
photogenerated charge carriers in small-pitch infrared PV arrays enabling optimization
of array topology for reaching the best resolution, good filling factor and minimal cross-
talking.
Due to small thickness of layers in epitaxial heterostructure interfaces are located close to
active regions of p-n junction and hence generation-recombination processes at interfaces
can impact on value of current flowing through junction. In high-density arrays with thin
common layer, collection length of photogenerated charge carriers will exceed pixel pitch as
a rule. It means that each pixel can collect excess charge carriers generated far from PD’s p-n
junction border. Therefore optimization of resolution, filling factor and cross-talking level of
small-pitch high-density PV FPA requires complete estimation of photocurrent generation
in neighbor PD pixels depending on pixel and array design, material properties and
operating conditions. In two technologically viable 2D IRFPA architectures: front-side
illuminated High-Density Vertically Integrated Photodiode (HDVIP) or (“Loop-hole”) and
backside illuminated flip-chip bonded via In-bumps to Si-ROIC are used special guard rings
or grids to solve a. m. problems. Therefore development of theoretical simulation describing
analytically collection of photogenerated charge carriers in small-pitch infrared PV arrays
seems useful.
3. Simulation of LWIR Hg
1-x
Cd
x
Te PD with small sensitive area
3.1 Photodiode models and simulation approach
Simulation was done for front-side illuminated LWIR Hg
1-x
Cd
x
Te photodiode based on n
+
-p
or p-n junction. Performance of LWIR photodiodes (Hg
0.785
Cd
0.215
Te and Hg
0.766
Cd
0.234
Te)
was estimated at operating temperatures 77 K and 100 K. Evaluation was performed at
reverse bias 0.05 V because every real Hg
1-x
Cd
x
Te PD array multiplexed to Silicon Read-out
Integrated Circuit (ROIC) is operated under reverse bias.
Simulation of Small-pitch High-density Photovoltaic Infrared Focal Plane Arrays
97
Upper limit of PD performance was calculated under assumption that diffusion current is
prevailing component of dark current in PD pixel at low reverse bias. Photocurrent excited
by background radiation was taken into account as well because its value is competitive to
dark (diffusion) current. Tunnel current is controlled mainly by total absorber doping and in
calculations its value was considered many times lower than diffusion current value at
reverse bias 0.05 V. Currents due to generation in space charge region of p-n junction and
surface (interface) shunting were ignored. Interface shunting elimination can become the
hardest task to solve. Surface (interface) recombination acts as generator of minority charge
carriers into absorber region of either n
+
-p or p-n junction and at high rates it can enlarge
seriously dark current value, especially when p or n absorber region is thin (shorter than
diffusion length of minority charge carriers). For simplicity surface recombination rate was
taken low (negligible) - 10
2
cm/sec and high (infinitive) - 10
7
cm/sec.
3.2 PD performance: simulation formalism
Let’s take photodiode with n-p junction as a model and consider contribution of quasi-
neutral n-side and p-side of photodiode to dark current and background current.
Depletion current per unit volume from the n-side for a planar one-side photodiode is given
by expression:
()()()
FD
p
n
p
n
p
n
JW JW J W−=−+− (1)
Density of background current from n-side is described by formula:
22
1
22
() exp( ) {1}
1
p
F
pn
p
L
JW qF W
L
γ
ηγ
γ
⎡⎤
×
⎢⎥
−=×××−×× ×
−×
⎢⎥
⎣⎦
(2)
11
1
11
()exp()
1
{1} 1
p
ppp
pp p
p
p
p
pp p
D
WW
sh S ch D S W
LL L
D
L
WW
ch S sh
LL L
γγ
γ
×+×−×+××
=+ ×
×
×+×
(3)
Density of dark current from n-side is described by formulae:
11
11
() ()
p
p
pppp
D
pn nen
p
p
p
pp p
D
WW
sh S ch
DLLL
JW q pW
D
L
WW
ch S sh
LL L
⎡
⎤
×+×
⎢
⎥
⎢
⎥
−=−××Δ−×
⎢
⎥
⎢
⎥
×+×
⎢
⎥
⎣
⎦
(4)
() exp 1
nnne
qV
pW p
kT
⎛⎞
×
⎛⎞
Δ
−= −
⎜⎟
⎜⎟
⎝⎠
⎝⎠
(5)
Contribution to responsivity from n-side of photodiode:
Advances in Photodiodes
98
22
4
1
22
0.8 10 exp( ) {1}
1
p
N
Jco
p
L
SW
L
λ
γ
ηλγ
γ
⎡⎤
×
⎢⎥
=× × × × −× × ×
−×
⎢⎥
⎣⎦
(6)
()
()
co
g
hc
m
EeV
λμ
×
=
(7)
Depletion current per unit volume from the p-side for a planar one-side photodiode is given
by expression:
() () ()
FD
n
p
n
p
n
p
JW JW J W=+ (8)
Density of background current from p-side is described by formula:
{}
22
1
2
() exp( ) 2
()1
F
n
np
n
L
JW qF W
L
γ
ηγ
γ
⎡⎤
×
=××× −× × ×
⎢⎥
×−
⎢⎥
⎣⎦
(9)
{}
33
3
33
exp( ) [ ]
1
21
n
nnn
nn n
n
n
n
nn n
WD W
Sch sh W S D
LL L
WD W
L
Ssh ch
LL L
γγ
γ
×+×+−××−+×
=− ×
×
×+×
(10)
Density of dark current from p-side is described by formulae:
33
33
() ()
n
n
nn n
D
n
np pep
n
n
n
nn n
DW W
sh S ch
LL L
D
JW q nW
L
DW W
ch S sh
LL L
⎛⎞ ⎛⎞
×+×
⎜⎟ ⎜⎟
⎝⎠ ⎝⎠
=− × ×Δ ×
⎛⎞ ⎛⎞
×+×
⎜⎟ ⎜⎟
⎝⎠ ⎝⎠
(11)
() exp 1
pp pe
qV
nW n
kT
⎡
⎤
×
⎛⎞
Δ
=−
⎢
⎥
⎜⎟
⎝⎠
⎣
⎦
(12)
Contribution to responsivity from p-side of photodiode:
22
4
1
22
0.8 10 exp( ) {2}
1
P
n
Jco
n
L
SW
L
λ
γ
ηλγ
γ
×
=× × × × −× × ×
−×
(13)
Here:
n
W− - coordinate of depletion region border on n-side;
p
W - coordinate of depletion region
border on p-side;
1
W - thickness of quasi-neutral n-side;
3
W - thickness of quasi-neutral p-
side;
q
- electron charge; 1 r
η
=
− - quantum efficiency;
γ
and
r
- absorption and reflection
coefficients;
F - background radiation flux density; ,
n
p
DD- diffusion coefficient for
electrons and holes properly;
,
n
p
LL- diffusion length for electrons and holes properly;
,
n
p
SS- surface recombination rate for electrons and holes properly;
co
λ
- cut-off wavelength.
Majority and minority charge carrier concentrations are defined (Blakemore, 1962)
Simulation of Small-pitch High-density Photovoltaic Infrared Focal Plane Arrays
99
In n-side:
eb
g
r
nn n=+
;
nneb
g
r
pp
n
=
+
;
(
)
1/2
22
4
22
di
d
e
Nn
N
n
+
=+
;
b
g
rb
g
rb
g
re
ff
npg
τ
=
=×
(14)
In p-side:
eb
g
r
pp
n=+
;
pp
eb
g
r
nn n
=
+
;
(
)
1/2
22
4
22
ai
a
e
Nn
N
p
+
=+
;
b
g
rb
g
rb
g
re
ff
npg
τ
=
=×
(15)
Where:
e
n and
e
p
- equilibrium electron and hole concentrations;
d
N /
a
N donor/acceptor dopant
concentration;
i
n – intrinsic carrier concentration;
b
g
rb
g
r
n
p
=
– average concentration of
excess charge carriers generated by infrared background flux;
bgr
g
F
η
γ
=
×× – excess charge
carriers generation rate by background flux;
e
ff
τ
- resulting excess charge carriers’ lifetime.
Energy gap value
(, )
g
ExT in eV is determined by formula (Laurenti et al., 1990), where x is
composition of Hg
1-x
Cd
x
Te:
{
}
0.303 (1 ) 1.606 0.132 (1 ) 3
g
Exxxx=− × − + × − × × − +
(16)
{}
42
6.39 (1 ) 3.25 5.92 (1 ) 10
3
11 (1 ) 78.7
xxxx T
xxT
−
×−− ×− ××− × ×
⎡⎤
⎣⎦
=
×−+ ×+
(17)
Intrinsic charge carriers concentration in Hg
1-x
Cd
x
Te is given by expression (Schmit, 1970):
14 3 3/2 3/4
4.293 10 (1.093 0.296 0.442 10 ) exp
2
g
i g
E
nxTTE
kT
−
⎛⎞
=×⋅× − +×××××−
⎜⎟
⎜⎟
⎝⎠
(18)
In pure non-compensated Hg
1-x
Cd
x
Te material there are two band-to-band processes which
control total recombination rate: radiative recombination and Auger recombination due to
transitions A1 and/or A7 (Kinch et al, 1973; Gelmont, 1980; Gelmont 1981; Kinch, 2007):
1
2
eeb
g
r
RiRi
npn
n
ττ
++
=
×
;
2
1
1
()( )
1
2
eb
g
reeb
g
r
i
A
iA
nn npn
n
τ
τ
+×++
=
××
;
2
7
7
()( )
1
2
eb
g
reeb
g
r
i
A
iA
pn npn
n
τ
τ
+×++
=
××
(19)
3/2
83/2
1
710 (1 )
77
Ri
gi
T
En
τμ
⎛⎞
=× × + × ×
⎜⎟
⎝⎠
;
3/2
1
13
11
exp (1 2 )
7.2 10
gg
i
A
g
EE
EkT kT
τμ
⎛⎞ ⎡ ⎤
=×××+×
⎜⎟
⎢
⎥
⎜⎟
×
⎢
⎥
⎝⎠ ⎣ ⎦
;
16 5/2
7
3.69 10 exp (1 )
gg
i
A
EE
kT kT
τμ μ
−−
⎡
⎤
=× × ×× +×
⎢
⎥
⎢
⎥
⎣
⎦
;
(/ )
ehh
mm
μ
=
. (20)
Resulting excess charge carriers’ lifetime equals to:
Advances in Photodiodes
100
17
11 1 1
RA A
τ
ττ τ
=+ + (21)
Iteration procedure was used to calculate
b
g
r
n (5):
()i
bgr
bgr
eff
nn
τ
=
=
(1)i
bgr
bgr
eff
nn
τ
−
=
, i = 1, 2, . . k,
(0)
0
bgr
n = . Convergence took place at number of iteration k ≤ 10.
The following noise sources were taken into account:
-
Johnson-Nyquist thermal noise of PD’s dynamic resistance;
-
Background current shot noise;
-
Dark current shot noise.
Noise currents densities are taken at preselected reverse bias
b
V (typically 0.01-0.1 V).
2
4
2( )
Ff
D
Ff d
dV
kT
I
fq
JAJA
f
R
δ
ΣΣ
=
Δ+ ×× × + × ×Δ (22)
Total density of noise current:
2
sh
II
δ
= (23)
Here:
d
A - geometrical area of photodiode’s p-n junction;
F
f
A - collection area of photogenerated
current in photodiode (“light capture” area);
f
Δ
- operative bandwidth;
dV
R - resistance of
photodiode at preselected reverse bias V,
F
f
J
Σ
- total background current,
D
J
Σ
- total dark
current.
11
33
2
33
11
1
p
n
p
n
pp p p
nn n n
dn p
pn
dp n
n
p
nn n
pp p
D
WW
DW W
sh S ch
sh S ch
DL L L
q
DL L L
Ap n
DDWW
RkT L L
WW
ch S sh
ch S sh
LL L
LL L
⎡⎤
×+×
⎢⎥
×+×
⎢⎥
=××−× × −××
⎢⎥
×+×
⎢⎥
×+×
⎢⎥
⎣⎦
(24)
exp
dV d
qV
RR
kT
×
⎛⎞
=× −
⎜⎟
⎝⎠
(25)
First term in curly brackets determinates contribution of n-side to resistance of photodiode
at reverse bias and second term the same of p-side.
Impact of surface recombination rate on charge carriers concentration and currents densities
was accounted correctly.
Total density of background current:
()()
Ff
Ff Ff
nn
pp
JJWJW
Σ
=−+
(26)
Total density of dark current:
()()
DD D
nn
pp
JJWJW
Σ
=− + (27)
Let’s assume for simplicity that:
Simulation of Small-pitch High-density Photovoltaic Infrared Focal Plane Arrays
101
dFf
A
AA
=
= (28)
Density of total current through photodiode will be sum of two terms:
Ff
D
FfD
JJJ
Σ
Σ
=
+ (29)
Detectivity is calculated following to standard expression:
21/2 1/2
()
4
2
JJ
FfD
dV
SA f S
D
I
kT
qJ
RA
δ
∗
×
×Δ
==
⎛⎞
+×
⎜⎟
×
⎝⎠
(30)
4
4
210
1
2
exp 1
co
f
Ff
d
Ff k c
hc
kT
λ
λ
π
λ
λ
−
×
=×× ×
⎛⎞
×
⎜⎟
−
⎜⎟
×
⎝⎠
∫
(31)
Here:
(
)
2
sin /2
f
k =Θ where
Θ
- full solid angle within that background and signal
radiation comes in sensitive area of photodiode.
3.3 LWIR PD performance: calculation results
We have done calculations for model photodiodes based on asymmetric n
+
-p or p-n junction
always used in practice. Data used in calculation are presented in Table 1.
PD with n
+
-p junction PD with p-n junction
Operating temperature, T (K) 77 100 77 100
Hg
1-x
Cd
x
Te absorber composition,
x (mol. fr.)
0.234 / 0.215 0.234 / 0.215 0.234 / 0.215 0.234 / 0.215
Energy gap, E
g
(eV) 0.138 / 0.104 0.144 / 0.112 0.138 / 0.104 0.144 / 0.112
Cut-off wavelength, λ
co
(μm) 9.0 / 11.9 8.6 / 11.1 9.0 / 11.9 8.6 / 11.1
Peak wavelength, λ
p
(μm) ≈ 8.1 / ≈ 10.5 ≈ 7.7 / ≈ 10 ≈ 8.1 / ≈ 10.5 ≈ 7.7 / ≈ 10
Absorption coefficient (Blue, 1964),
γ (cm
-1
)
3×10
3
3×10
3
3×10
3
3×10
3
Quantum efficiency, η 0.7 0.7 0.7 0.7
Junction area, A (μm × μm) 20 × 20 20 × 20 20 × 20 20 × 20
Junction regions doping, n and p
(cm
-3
)
n
+
=10
17
p=10
16
n
+
=10
17
p=10
16
p=5×10
16
n=10
15
p=5×10
16
n=10
15
Junction regions thickness, t (μm)
t(n
+
) = 0.5
t(p-absorber) =
4-40
t(n
+
) = 0.5
t(p-absorber) =
4-40
t(p) = 0.5
t(n-absorber) =
4-40
t(p) = 0.5
t(n-absorber)
= 4-40
Electron mobility, μ
n
(cm
2
/(V×sec)) 1.9×10
5
1.29×10
5
1.9×10
5
1.29×10
5
Hole mobility, μ
p
(cm
2
/(V×sec)) 600 390 600 390
Reverse bias value, V
b
(V) -0.05 -0.05 -0.05 -0.05
Surface recombination rate, s
(cm/sec)
10
2
10
7
10
2
10
7
10
2
10
7
10
2
10
7
Table 1. Data used for estimation of small-size Hg
0.766
Cd
0.234
Te and Hg
0.785
Cd
0.215
Te
photodiodes performance
Advances in Photodiodes
102
Calculation results are presented on Fig. 1-6. Typically discussed photovoltaic case (
b
V =0)
has been studied as well.
Obtained results presented on Fig. 1-6 say that extended LWIR PD with p-n junction will be
potentially of 4-5 times lower dark current value than PD with n+-p junction at T
op
=77 K
and 2 times lower at T
op
=100 K. As the result it is hoped that decrease in D* value with
elevating of operating temperature up to 100 K will be moderate in the case of PD with p-n
junction opposite to significant decreasing observed on LWIR PD with n+-p junction as it
presented on Fig. 1-6. Calculated detectivity at reverse bias 0.05 V is higher than in the case
of zero bias (photovoltaic mode). Formalism of R
0
A product is not suitable for the case of
LWIR PD arrays multiplexed to Silicon ROIC.
0,000 0,002 0,004
1E11
5
4
3
2
1
t
ab
(cm)
D
*
(λ
p
)(Jones)
T=77K, Na=1.10
16
cm
-3
λ
co
= 11,9 μm
1,2 - S=10
2
cm/s, Θ=180
o
,30
o
3,4 - S=10
7
cm/s, Θ=180
o
,30
o
5 - D
*
BLIP
(Θ = 180
o
)
0,000 0,002 0,004
3
4
5
6
7
8
3,4
1,2
S
I
(A/W)
T=77K, Na=1.10
16
cm
-3
λ
co
= 11,9 μm
1,2 - S=10
2
cm/s, Θ=180
o
,30
o
3,4 - S=10
7
cm/s, Θ=180
o
,30
o
Fig. 1. Calculated peak detectivity D*(λ
p
) and peak responsivity S
I
(λ
p
) of Hg
0.785
Cd
0.215
Te
photodiodes with n
+
-p junction versus thickness of p-absorber t
ab
at FOV=180
0
– (1 and 3)
and FOV=30
0
– (2 and 4). Surface recombination rate s=10
2
cm/sec (1 and 2) and s=10
7
cm/sec (3 and 4). Operating temperature 77 K. Background temperature equals to 293 K.
Doping of p-absorber p
77
=10
16
cm
-3
, n
+
-p junction area 20 μm × 20 μm
0,000 0,002 0,004
1E10
1E11
5
4
3
2
1
t
ab
(cm)
D
*
(λ
p
)(Jones)
T=100K, Na=1.10
16
cm
-3
λ
co
= 11,1 μm
1,2 - S=10
2
cm/s, Θ=180
o
,30
o
3,4 - S=10
7
cm/s, Θ=180
o
,30
o
5 - D
*
BLIP
(Θ = 180
o
)
0,000 0,002 0,004
1
2
3
4
5
6
7
8
3,4
1,2
1,2 - S=10
2
cm/s, Θ=180
o
,30
o
3,4 - S=10
7
cm/s, Θ=180
o
,30
o
T=100K, Na=1.10
16
cm
-3
λ
co
= 11,1 μm
t
ab
(cm)
S
I
(A/W)
Fig. 2. Calculated peak detectivity D*(λ
p
) and peak responsivity S
I
(λ
p
) of Hg
0.785
Cd
0.215
Te
photodiodes with n
+
-p junction versus thickness of p-absorber t
ab
at FOV=180
0
– (1 and 3)
and FOV=30
0
– (2 and 4). Surface recombination rate s=10
2
cm/sec (1 and 2) and s=10
7
cm/sec (3 and 4). Operating temperature 100 K. Background temperature equals to 293 K.
Doping of p-absorber p
77
=10
16
cm
-3
, n
+
-p junction area 20 μm × 20 μm
Simulation of Small-pitch High-density Photovoltaic Infrared Focal Plane Arrays
103
0,000 0,002 0,004
1E10
1E11
5
4
3
2
1
D
*
(λ
p
)(Jones)
1,2 - S=10
2
cm/s, Θ=180
o
,30
o
3,4 - S=10
7
cm/s, Θ=180
o
,30
o
5 - D
*
BLIP
(Θ = 180
o
)
T=77K, Nd=1.10
15
cm
-3
λ
co
= 11,9 μm
t
ab
(cm)
0,000 0,002 0,004
1
2
3
4
5
6
7
8
3,4
1,2
t
ab
(cm)
S
I
(A/W)
1,2 - S=10
2
cm/s, Θ=180
o
,30
o
3,4 - S=10
7
cm/s, Θ=180
o
,30
o
T=77K, Nd=1.10
15
cm
-3
λ
co
= 11,9 μm
Fig. 3. Calculated peak detectivity D*(λ
p
) and peak responsivity S
I
(λ
p
) of Hg
0.785
Cd
0.215
Te
photodiodes with p-n junction versus thickness of n-absorber t
ab
at FOV=180
0
– (1 and 3)
and FOV=30
0
– (2 and 4). Surface recombination rate s=10
2
cm/sec (1 and 2) and s=10
7
cm/sec (3 and 4). Operating temperature 77 K. Background temperature equals to 293 K.
Doping of n-absorber n
77
=10
15
cm
-3
, p-n junction area 20 μm × 20 μm
0,000 0,002 0,004
1E10
1E11
t
ab
(cm)
D
*
(λ
p
)(Jones)
1,2 - S=10
2
cm/s, Θ=180
o
,30
o
3,4 - S=10
7
cm/s, Θ=180
o
,30
o
5 - D
*
BLIP
(Θ = 180
o
)
T=100K, Nd=1.10
15
cm
-3
λ
co
= 11,1 μm
5
4
3
2
1
0,000 0,002 0,004
1
2
3
4
5
6
7
8
1,2 - S=10
2
cm/s, Θ=180
o
,30
o
3,4 - S=10
7
cm/s, Θ=180
o
,30
o
T=100K, Nd=1.10
15
cm
-3
λ
co
= 11,1 μm
S
I
(A/W)
t
ab
(cm)
3,4
1,2
Fig. 4. Calculated peak detectivity D*(λ
p
) and peak responsivity S
I
(λ
p
) of Hg
0.785
Cd
0.215
Te
photodiodes with p-n junction versus thickness of n-absorber t
ab
at FOV=180
0
– (1 and 3)
and FOV=30
0
– (2 and 4). Surface recombination rate s=10
2
cm/sec (1 and 2) and s=10
7
cm/sec (3 and 4). Operating temperature 100 K. Background temperature equals to 293 K.
Doping of n-absorber n
77
=10
15
cm
-3
, p-n junction area 20 μm × 20 μm