Advances in Vehicular Networking Technologies Part 10 pptx
Bạn đang xem bản rút gọn của tài liệu. Xem và tải ngay bản đầy đủ của tài liệu tại đây (2.97 MB, 30 trang )
Advances in Vehicular Networking Technologies
262
transfers, while slave mode exploits a BASK modulation. The modulation must support data
transfer at 10 Kbps, while the accepted conducted emission limits need to be less than 53
dBμv in the [1-30] MHz band. Two carriers have been selected, one at 100 KHz for low
power modules and one at 2 MHz for high power modules. Although this LIN and PLC
transceiver is an attractive solution, the data rate remains under 10 Kbps that is not
convenient for X-by-wire applications.
A similar approach has been proposed for CAN protocol by many authors (Yamar, 2009),
(Silva et al., 2009) (Beikirch et al., 2000). The Yamar solution implements CAN and PLC
using the DC-BUS technology with different bit rates up to 1.7 Mbps. It uses narrow band
channels with a center frequency between [2-12] MHz. The DC-BUS protocol uses the
CSMA/CA multiplex mechanism allowing bidirectional communication up to 16 nodes. In
addition, this CAN-PLC solution can be used as a redundant channel for the CAN protocol.
However, this solution still does not answer to data rate over 10 Mbps.
Additional PLC drivers combining MAC layers have been presented in (Benzi, 2008). The
commercial solutions are available for automotive but to our knowledge not implemented
yet in vehicles.
More recently, PLC in electric vehicles has been studied in (Bassi et al., 2009). One can think
that the requirements of such communication system within an electrical car differ from a
fuel car. An experimental setup has been built. It uses 2 ECUs and 2 DCB500 transceivers to
modulate the DC-line. The DCB500 transceivers feature PLC communication over DC-line
with a bit rate up to 500 Kbps. The conducted and irradiated emissions show substantial
compatibility, except for the lower end frequencies (under 1 MHz) where significant peaks
are highlighted. In addition, different channel measurements in electric cars have been
carried out in (Barmada et al., 2010). Different cases are considered (front to/from rear part)
with different vehicle’s configuration (position key, battery,…). As for fuel vehicle, the
channels are very frequency selective in the [0-30] MHz. We can conclude that the fuel and
electric vehicles seem to have similar behaviours in term of frequency channel and noise for
PLC applications.
Another solution for PLC is to consider both the MAC and PHY layers. Considering the
channel measurements, the candidate techniques for in-vehicle PLC are spread spectrum
combined with code division multiple access (CDMA) (Nouvel et all, 1994) and OFDM.
OFDM allows high data rate and outperform CDMA performances in term of throughput.
and frequency selectivity.
Experimentations using indoor OFDM PLC modems have been carried out and presented in
detail in previous studied presented in (Gouret et al., 2006), (Gouret et al., 2007), (Nouvel et
al., 2008), (Degardin, 2007) and more recently in (Nouvel et al., 2009A). The results are very
promising. Data rate up to 10 Mbps/s can be achieved in the [0-30MHz] bandwidth. The
solutions are based on HPAV standards. In (Nouvel et al., 2008) two PLC modems have
been tested: SPIDCOM (Spidcom, 2008) and DEVOLO modems. In the SPIDCOM modems,
the OFDM modulation is based on 896-carriers from 0 to 30 MHz divided into 7 equal sub-
bands. The MAC layer provides a mechanism based on TDMA and CSMA/CA is also
available. The PHY and MAC layers are similar to the HPAV ones but differ in some points:
number of sub-bands, equalization, and synchronization. With these SPIDCOM modems, an
8 Mbps is achieved with a transmitted power of -50 dBm. With a higher level (-37 dBm), we
achieve about 12 Mbps. For multi-media applications, this rate can be sufficient, but
decreases rapidly according to the loads. Then measurements have been carried out with
Experiments of In-Vehicle Power Line Communications
263
DEVOLO PLC modems. They comply with HPAV and support data speed of up 200 Mbps
in a range of 200 meters within a household grid. For intra-car communications, the power
supply and the coupling have been modified to take into account the DC channel.
Additional measurements are presented in next section. Figure 5 illustrates the spectrum of
the transmitted signal over the DC line.
0
10
20
30
40
50
60
70
80
90
100
0 5 10 15 20 25 30 35 40
f (MHz)
dBµA
Devolo
Spidcom
classe 1
classe 2
classe 3
classe 4
classe 5
Fig. 5. HPAV and Spidcom spectrum over DC line
Beyond these promising results, the choice of the modulation parameters will be driven by
the PLC channels and optimized with regards to the bandwidth, the modulation technique,
the coding rate, the guard interval, and so on. This discussion is presented in the next
section.
4. In-vehicle measurements
In this section we deal with in-vehicle PLC measurements. In a first time we show some
results about real PLC transmissions. Indeed, we have decided to test the feasibility to adapt
indoor PLC modems in car. Then, we study in more details the in-vehicle PLC channel with
different measurements about the transfer function and the noise. To achieve the capacity of
the channel through the cables for PLC, many transfer functions between nodes in the
vehicle have been measured. Noises have also been considered.
4.1 In-vehicle PLC transmissions
4.1.1 Data rates measurements testbed
We have tested two indoor PLC modems complying with the standards HPAV and HD-
PLC in one car. We have measured throughputs at different points on a gasoline Peugeot
407 SW.
The Figure 6 illustrates the different points used during the throughput measurement.
Several scenarios have been used:
1. Car with engine-turned off
Advances in Vehicular Networking Technologies
264
2. Car with engine-turned but not moving
3. Car with engine-turned but not moving and effects of lightning, warnings, radio,
windscreen wiper, electric windows
4. The car in motion and the effects of the equipments like in 3)
Fig. 6. Measurement scheme: the different uppercases represent the measurement points
The measurements have been achieved with two PLC modems and two computers which
have been plugged into the different points shown Figure 6. Therefore, we have measured
the TCP throughput between two points with two modems and two PC. The measurement
between points A and D has been called path AD. The throughputs are measured associated
with the payload ignoring headers. The throughput is also called “Goodput” according the
definition in section 3.7 of (Newman, 2009).
4.1.2 Results and discussion
Throughputs for different points have been studied and we can first observe a difference
between scenario 1) and the others. Figure 7 to 9 represent the throughput we obtain with
the two modems. Throughputs in Figure 7 are higher than 35 Mbps, and in Figures 8 and 9
more than 15 Mbps are achieved for all paths.
Fig. 7. HPAV and HD-PLC throughputs comparison
Experiments of In-Vehicle Power Line Communications
265
For scenario 2), 3) and 4) we remark that the HPAV has the best performances. Moreover,
we can observe short variations between the scenarios for the two indoor standards.
Furthermore there is a throughput difference according to the path in-vehicle. Indeed, we
can see that the path HD has throughput higher than all the others.
Indoor PLC standards have been designed according indoor channel characterization.
Moreover, the power level of the transmitted signal has been chosen according the indoor
CEM constraints. In fact, to respect the vehicle CEM it has been said in (Degardin et al.,
2007) that the power level of transmitted signal should be between -60 dBm/Hz and -80
dBm/Hz. This specific point must be taken into account for next PLC in-vehicle
transmission. That's why measurements on several vehicles have been achieved and are
discussed in the next subsection.
Fig. 8. HPAV throughputs for different paths in-vehicle for scenario 2), 3) and 4)
Fig. 9. HD-PLC throughputs for different paths in-vehicle for scenario 2), 3) and 4)
Advances in Vehicular Networking Technologies
266
4.2 In-vehicle channel measurements
In order to design a future PLC modem it is necessary to study the PLC in-vehicle channel.
Here the transfer function and the background noise is studied.
Additional measurements have been performed on recent vehicles for two classes of paths:
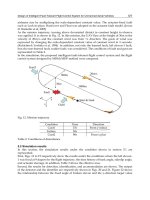
front to front and rear to front (Tanguy et all, 2009). Figure 10 and 11 illustrate the results
according to our testbed (Figure 6). In order to analyze the DC PLC architectures, additional
transfer functions are measured on four different vehicles. The vehicles are classified
according to: the number and type of ECUs, the length of wires, the combustion engine.
4.2.1 Measurement testbed
The S-parameters are recorded using a full 4 ports Vector Network Analyzer (VNA) and a
PC interfaced to remote the device. We record the S-parameters during about 10 minutes
while the car is moving. The S-parameters are recorded about every 10 seconds for the 3
different paths: GF, GH and HD. Compared with the previous subsection we have introduce
a new measurement point called G which is for the most of vehicle tested a cigar lighter
receptacle. These paths have been chosen in order to analyze the differences between front
to front and rear to front.
Regarding the noise, the same points have been considered: G, D, F and H. Two different
noise studies have been carried out. The first consists of the measurement of the power
spectrum at each point during 10 minutes every 10 seconds with the vehicle moving. The
second is a measurement in the time domain. In fact, a digital storage oscilloscope (DSO) has
been used to record at each point the signal over the DC line. With this testbed we are able to
record two signals at two different points in the same time. Thus, we can observe the level of
noise at two different points simultaneously. Finally, the measurements have been performed
on a Peugeot 407 SW gasoline and diesel, a Renault Laguna II Estate and a Citroën C3.
4.2.2 Results & discussion
Figure 10 and Figure 11 show an example of time and frequency responses for the three
paths GF, GH and HD and for a measurement bandwidth of [1-31] MHz. The impulse
responses have been calculated with the inverse Fourier transform of complex parameter S21.
Fig. 10. Impulse response for 3 paths GF,GH,HD on 407SW gasoline
Experiments of In-Vehicle Power Line Communications
267
Fig. 11. S21 for 3 paths GF, GH and HD on 407 SW gasoline
Min Max Mean Std
407 gasoline 391.8 KHz 832.6 KHz 533.8 KHz 89.9 KHZ
407 diesel 538.7 KHz 881.6 KHz 666 KHz 81.6 KHz
Laguna II 4.3098 MHz 4.8976 MHz 4.7163 MHz 142.8 KHz
BC0.9 GF
C3 440.8 KHz 1.3713 MHz 1.1587 MHz 143.9 KHz
407 gasoline 1.3713 MHz 2.1059 MHz 1.7578 MHz 190.3 KHz
407 diesel 97.9 KHz 1.0775 MHz 748.3 KHz 227.3 KHz
Laguna II 1.0775 MHz 1.2734 MHz 1.1443 MHz 45.6 KHz
BC0.9 GH
C3 489.8 KHz 1.5182 MHz 1.0591 MHz 331 KHz
407 gasoline 1.8121 MHz 2.057 MHz 2.006 MHz 40.8 KHz
407 diesel 685.7 KHz 734.6 KHz 712.6 KHz 24.5 KHz
Laguna II 685.7 KHz 832.6 KHz 744 KHz 31.9 KHz
BC0.9 HD
C3 881.6 KHz 1.0775 MHz 995.8 KHz 46.4 KHz
Table 2. Coherence bandwidth (BC0.9) for 3 paths (GF, GH and HD) and for 4 different
vehicles
In a previous study on in-vehicle PLC (Lienard et al., 2008) a delay spread under 380 µs and
a coherence bandwidth greater than 400 KHz has been found. Moreover, in Table 2, we
observe the coherence bandwidths are different from one vehicle to another and from one
path to another. This means that the modulation must be adaptive.
Regarding the average attenuation we can also observed differences between the different
paths. For example, the Renault Laguna II Estate has a mean average attenuation of 9 dB for
the path GF, 31.6 dB for GH and 31.5 for HD. But the 407 SW gasoline has a mean average
Advances in Vehicular Networking Technologies
268
attenuation of 40.1 dB for the path GF, 40.4 dB for GH and 24.4 for HD. Otherwise, we have
a maximum average attenuation of 69.3 dB for the path GH of the 407 SW diesel and a
minimum average attenuation of 5.8 dB for the path GF of the Laguna II.
Fig. 12. Noise measured with a spectrum analyser for 4 different paths on a Peugeot 407 SW
gasoline
Fig. 13. Spectrogram computed with the DSO recording at point G measured on a Peugeot
407 SW gasoline
To optimize the modulation parameters, we have to consider the noise. Figure 12 represents
an example of noise measurement with a spectrum analyzer for 4 different points in a
Peugeot 407 SW gasoline. We observe an increase of noise for some frequencies in the
bandwidth [0 – 5] MHz. Moreover we can see narrowband noises. Like in (Yabuuchi et al.,
Experiments of In-Vehicle Power Line Communications
269
2010) we have applied to noise recordings in-vehicle a time frequency analysis. In Figure 13
we show an example of spectrogram computed with the DSO recording at point G
measured on the same vehicle. We have computed the spectrogram with short-time Fourier
transform where an Hamming window of length equal to the length of HPAV OFDM
symbol (40.96 µs) and an FFT size of 3072 points like in HPAV standard.
In Figure 13 we can observe that in the bandwidth [0 – 5] MHz the noise is constant during
the time of the recording. Therefore, in the case of a multi-carriers modulation transmission
in the bandwidth [2-30] MHz some subcarriers will be affected during all the transmission
time.
We have observed that the average attenuation, the coherence bandwidth and the RMS
delay spread are very different according the vehicles, the paths in-vehicle and the paths
between vehicles. We verified the capacity for each paths of each vehicles with the
parameters of the Table 3 according to
1
2
0
lo
g
(1 )
N
i
Cf SNR
−
=Δ +
∑
(1)
with Δ
f
the subcarrier bandwidth, SNR_{i} = (H_{i}
2
.Pe/Pn) the signal to noise ratio per
subcarrier , Pe is the PSD of the emitted signal and Pn is the PSD of the AWGN noise.
Parameters Values
Fmin 1 MHz
Fmax 31 MHz
Subcarrier N=1228
FFT/IFFT 3072
Δ
f
24.414 KHz
PSD of noise (Pn) - 120 dBm/Hz
PSD of signal (Pe) -60 dBm/Hz
Table 3. Simulation parameters: FFT/IFFT and Δ
f
values are parameters used by the HPAV
standard
The results show the minimum of the average capacity is about 190 Mbps for the path GH
of the Peugeot 407 SW diesel and the maximum is about 507 Mbps for the path GF of the
Laguna II. We observed also differences between the paths and the vehicles.
The vehicles have not the same electrical topology. In fact, it depends on car manufacturer,
the size of vehicles, the number of ECUs Therefore the load on the electrical network, the
length of wires and the junctions between cables are different. We have several channels
which are different according the paths and the vehicles like we have shown with the
coherence bandwidth, the time delay spread, the channel gain and the capacities.
The multicarrier modulation seems to achieve good performances like we have seen during
the throughput measurement of HPAV and HD-PLC standards. In this study, only the
Advances in Vehicular Networking Technologies
270
channel function transfer and the background noise have been studied. The impulsive noise
is an other important aspect to take into account (Umehara et al., 2010) and (Degardin et al.,
2008) for powerline communication. According to us the MAC/PHY layers must be
designed to take into account the differences between vehicles and the differences between
paths in-vehicle. Future work will be focus on the integration in a simulator of all the
channel measurements (transfer function, background noise, narrowband interference and
impulsive noise) in order to optimize the modulation scheme.
5. In-vehicle wireless communications
The interest in wireless networking has grown significantly due to the availability of many
wireless products. Looking at in-vehicle communications, more and more portable devices,
e.g., mobile phones, laptop computers and DVD player can exploit the possibility of
interconnection with the vehicle. Wireless communication could be an attractive solution to
reduce the number of cables and disturbances in cars. We have reviewed potential wireless
solutions, specifically two of them in (Nouvel et al., 2009A). We have performed tests similar
to PLC tests in order to qualify the channel in the 2.4 GHz band. Data rate measurements
show it is possible to achieve more than 10 Mbps/s in the vehicle, using also OFDM
technology. Additional studies have been carried out in (Nolte et al., 2009). The authors in
(Zhang et al., 2009) have conducted measurements in the [0.5 – 16] GHz band. One can
observe the different delay profile, different clusters, different paths and the impact of
passengers. Due to lake of space, it is not possible to describe all the measurements. And we
invite the interested readers to look at the papers and chapters.
6. From static to dynamic ECU and communication networks
Taking into account all these networks, from specific network up to PLC or wireless
combined with the constraint of flexibility and security, one attractive idea is to be able to
switch from one network to another one, without additional cost. If the main
communication fails, the ECU ( modem) can switch to the secondary protocol and continue
to run. Reconfigurable architectures based on FPGA may offer very flexible links inside a
vehicle. A dynamically reconfigurable system allows changing parts of its logic resources
without disturbing the functioning of the remaining circuit. This property can applied for
networks, in order to allow changing from one protocol to another one according to the
channel behaviour, errors, load, etc. This section will discuss about this new concept and
demonstrates how it can be integrated in vehicle.
Certain modern FPGAs offer dynamic and partial reconfiguration (DPR – Dynamically and
Partially Reconfigurable) capability that allows to change dynamically one portion of the
FPGA without affecting the rest of the circuit. Currently, the Xilinx Virtex FPGAs (Xilinx,
Inc, 2008) are the only commercially available circuits supporting the DPR paradigm and
large applications implementation. Internal structure of a Xilinx Virtex5 is presented in
Figure 1. The main resources dispatched in the FPGA matrices are slices, DSP blocks
(DSP48E), memory blocks (BRAM), input/output (IO) banks, and Clock Management Tiles
(CMTs) as well as the reconfiguration interfaces, so called ICAP. Slices are the smallest
configurable elements constituted of LUTs (Look-Up Table), registers and logic gates. DSP
blocks offer a powerful set of processing elements for data applications.
Experiments of In-Vehicle Power Line Communications
271
The dynamic reconfiguration takes place in Partially Reconfigurable Region (PRR) which
can be partially reconfigured independently. Designing a dynamically self-reconfigurable
system always require the declaration of PRRs. A PRR is implemented statically despite the
fact that its content is dynamic. Thus, at runtime, dynamic reconfiguration can only take
place into the PRR. Communications between a dynamic task and its static environment is
assured through the bus macro interfaces. Bus macros are also specified statically.
Fig. 14. View of the Virtex5 5VSX50T captured from Xilinx PlanAhead design tool
The FPGA fabric is partitioned into one static logic and one or more partially reconfigurable
regions (PRRs). This fabric partitioning enables reconfiguration of a single PRR without
system interruption (the static region and other PRRs continue execution while only the
reconfigured PRR halts). Each PRR has a related partial bitstream and the reconfiguration
process can be done by sending this partial bitstream to the reconfiguration port. In modern
FPGAs, the reconfiguration is stored in SRAM based memory, leading to a weakness from a
reliability point of view.
Modern FPGAs, besides customary high-density reconfigurable resources, offer the
designers the possibilities of implementing programmable processors having features of
Commercial Off-The-Shelf (COTS) components (no need to modify processor architecture or
application software). Processors play the role of processing units, and one particular is used
as coordination units in the embedded system. Besides, processors are in charge of collecting
the data from peripherals and from the memory, process the data and send them to the
memory and to the peripherals. Also, processors manage the memory and initialize the
peripherals. Xilinx FPGA devices include two categories of processors: the hardcore
embedded processor (PowerPC) (Xilinx, Inc, 2004) and softcore processors (MicroBlaze,
PicoBlaze) (Xilinx, Inc, 2009). Hardcore embedded processors are hard-wired on the FPGA
die and their number is limited on each device. On the other hand, softcore processors use
reconfigurable resources, so the number that can be actually implemented depends on the
device size only. The MicroBlaze tasks can be classified into 2 types: hardware tasks and
software tasks. Hardware tasks are peripherals connecting to MicroBlaze. Software tasks are
software programs running inside MicroBlazes. Generally, hardware tasks are designed
using High Description Language HDL like VHDL, Verilog and software tasks are
programmed using C. Regardless of their design methods they are presented in our system
Advances in Vehicular Networking Technologies
272
in compiled forms of binary files called bitstreams. A bitstream is the set of binary data
describing the circuits implemented on the FPGA, or in PRRs (partial bitstream). Shorten
term “bitstream 1” will refer to all the bitstreams of FPGA1, idem with “bitstream 2” for
FPGA2, ….
The processor software context is a set of information needed to uniquely define the state of
the processor at a given moment. It could include the states of the processor registers, the
cache, the memory, etc. Saving and restoring all relevant values allow for processor context
switching and error recovery. The softcore processor MicroBlaze context is represented by
the 32-bit values of 32 General Purpose Registers and two Special Registers: the Program
Counter (PC) and the Machine Status Register (MSR).
A MicroBlaze task migration consists in migrating hardware task, software task and
restoring the software context. Hardware task migration requires the appropriate peripheral
to be added using dynamic reconfiguration. Software context is also migrated by dynamic
reconfiguration. And copying the saved software context into the related MicroBlaze
program memory does the software context recovery process.
Due to their flexibility, FPGAs are attractive for mission-critical embedded applications like
automobile domain, but their reliability could be insufficient unless some fault-tolerance
techniques capable of mitigating soft errors are used. Dynamic partial reconfiguration
provide not only the flexibility in both hardware and software, but also further solutions
dealing with reliability problem in critical domains. The dynamic reconfiguration allows the
reloading of the defected module to the correct state and the re-execution of the attributed
tasks. It cans also re-distribute defected tasks in the faulty module to other processing units
in the system.
We present here the feasibility of integrating dynamic reconfiguration features into
automotive-aimed applications in which certain fault-tolerance degrees should be
maintained. In case of a fault occurrence, the system must be capable of react in real-time to
ensure the safety for driver as well as pedestrian. The reaction in this case can be the fast
fault detection and correction by loading the original configuration to put the faulty module
to the state as at start-up. It can also be the critical task migration from the defected module
to another module.
To define a new embedded automotive platform based on reconfigurable architecture, in
CIFAER (CIFAER, 2008) we advocate for the use of Radio Frequency and Power-Line
Communication for intra-vehicle communications (Nouvel et al., 2008). The communication
can be switched from one to the other by dynamically reconfiguring a defined
communication zone on an FPGA. These two modes offer very flexible links inside a vehicle.
Figure 15 shows the fault-tolerant multi-FPGA platform. The system consists of four FPGAs
connected together using two Ethernet communication (in future development one will be
based on PLC interface, while the other will be constructed on RF connections). The first
network is routed via a network switch, the other network form a ring topology for the
fault-tolerance purpose. The Ethernet protocol is built by Ethernet controller as MicroBlaze
hardware peripherals and LightWeight IP (LightWeight) as the software library. The lwIP is
an open-source stack using TCP/IP protocol, which can be easily adapted to PLC and
wireless modem. Each FPGA contain a fault-tolerant dynamic multi-processors system,
consisting of several MicroBlaze (Figure 16). Further details about this system architecture,
called FT-DyMPSoC, as well as the fault-tolerance schemes implemented can be found in
(Pham et al., 2009) and (Pham et al., 2010) for interested readers.
Experiments of In-Vehicle Power Line Communications
273
Fig. 15. Fault-tolerant multi-FPGA platform. Two communications networks are supported
for reliability purpose
Fig. 16. FT-DyMPSoC Architecture. Included in each FPGA this architecture insert fault-
tolerant mitigation schemes
On the overall system, each FPGA is interfaced with a memory that can be accessed by all
the processors inside the same FPGA. This memory is partitioned into three segments
(Figure 15):
- One for saving all the bitstreams and the software contexts of all the processors of this
particular FPGA.
- One for saving all the bitstreams of the next FPGA in the ring network.
- One reserved and used in case of failure occurrence in the system. This segment helps
to transfer the bitstreams and contexts between different FPGAs.
The memory segmentation guarantees the existence of at least one copy of all the bitstreams
over the whole network.
As we can see in Figure 17, the bitstream of each FPGA is present in its local memory and
also in the local memory of the previous FPGA in the ring topology. For example, FPGA1
stores its own bitstream 1 and and the bitstream 2, FPGA2 stores bitstream 2 and bitstream
3… These copies will be used in case of system failure, and permit fast context switching.
Advances in Vehicular Networking Technologies
274
Fig. 17. Fault recovery strategies. Once the faulty FPGA is identified, the copies of the
bitstreams are exchanged in order to keep a valid copy of all the configurations
The fault-tolerance degrees are maintained at two levels in the system. The Intra-FPGA level
corresponds to the fault-tolerance strategy inside each FPGA, and is related to the design of
the FT-DyMPSoC system. The fault-mitigation strategy is realized using the connection
matrices algorithm (Pham, 2009), and fault are mitigated by using dynamic reconfiguration
at the processors level. The second level called Inter-FPGA level corresponds to the overall
system presented in Figure 15. To detect error in the overall network, all the FPGAs
exchange frequently among them detection frames. These frames contain the software
contexts of the four MicroBlazes of each FPGAs. On one hand, this helps detecting error in
the network. On the other hand, including the contexts within the detection frame will help
to resume the tasks of a faulty FPGA on another FPGA. During the exchange if the contexts
of one FPGA (i.e. FPGA3 in Figure 17) are not received by the others circuits, the FPGA3 is
declared faulty. There are 2 possibilities: the MicroBlaze 1 (supporting the interface to the
network) of FPGA3 is faulty, causing the communication lost of this FPGA, or the whole
FPGA3 is faulty. In order to distinguish these 2 possibilities, the secondary ethernet links is
used. FPGA2 and FPGA4 try to communicate with MicroBlaze 2 and 3 of FPGA3. If these
communications fails, the whole FPGA3 is declared defected, if not, only the MicroBlaze 1 is
defected.
If only one MicroBlaze inside one FPGA fails, we can manage this error thanks to dynamic
reconfiguration of this processor or by using task migration within the MPSoC system. The
error is managed at the FPGA level. If the whole FPGA fails the task migration concerns the
overall circuit. In this case the task of the FPGA3 needs to be dispatched across the
remaining circuits. If the system cannot manage all the tasks with one missing FPGA
priority needs to be defined and used to maintain critical services for example. In this case,
arbitration on the running tasks needs to be executed, and reconfiguration of the remaining
FPGA is launched.
If one FPGA is lost, we need to maintain the two bitstreams copy stored in the faulty FPGA.
For example, if the FPGA3 is lost (Figure 17), the copies of bitstream 3 and 4 are inaccessible
requiring a clone of bitstream 3 and bitstream 4. We propose here 2 strategies delivering the
bitstream 3 and 4 to other FPGAs.
1. The first strategy uses only the secondary communication media. We need to use
FPGA1 reserved segment as intermediate medium. First the bitstream 4 is copied from
FPGA 4 to FPGA1 reserved segment, then to FPGA2. Afterwards, bitstream 3 is copied
from FPGA2 to FPGA1, then to FPGA4.
Experiments of In-Vehicle Power Line Communications
275
2. The second strategy requires both communication media. Bitstream 4 is copied from
FPGA4 to FPGA1 using direct Ethernet link. Simultaneously, bitstream 3 is copied from
FPGA2 to FPGA4 using the primary Ethernet via the switch.
In case the Ethernet switch fails, all the primary Ethernet connections are defected; This
leads to a connection loss between all the FPGAS. At this moment all circuits switch to the
ring topology. The second network will then ensure proper operation of the overall system.
The use of redundancy of the network, coupled with the new dynamically reconfigurable
paradigm permits to construct highly reliable system.
7. Conclusion
In this chapter, an initial foreseeable solution with PLC has been presented to allow
communications and interoperability between embedded applications with different
requirements. PLC network answers both to cost, flexibility and throughput requirements.
Future work should be devoted to optimize both PLC modulations and ECU architectures in
order to minimize the number of cables and ECU etc. This implies rethinking the DC
bundles as rethinking the implementation of networks as independent domain.
Furthermore, it is possible to build a reconfigurable ECU for both application and
communication. This new concept will allow combining different network technologies. It
will answer to fault tolerance constraints, required in X-by-wire applications
This work has been carried out by the CIFAER project, supported by the ANR and by the
French Premium Cars competitiveness Cluster ID4car.
8. References
Afkhamie, K.H.; Katar, S.; Yonge, L. & Newman R. (2005). An overview of the upcoming
HomePlug AV standard, Proceedings of the IEEE International Symposium on Power
Line Communications and Its Applications, pp. 400–404, 0-7803-8844-5, 6-8 Apr. 2005,
Vancouver, BC, Canada.
Arabia, E.; Ciofi, C.; Consoli, A.; Merlino, R. & Testa A. (2006). Electromechanical Actuators
for Automotive Applications Exploiting Power Line Communication, Proceedings of
SPEEDAM, pp. 909-914, 1-4244-0193-3, Taormina, 26-26 May 2006
Bahai, A.; Saltzberg, R. & Ergen, M (2004). MultiCarrier Digital Communications, ISBN: (HB)
0-387-22575-7, Springer NewYork
Barmada, S.; Raugi, M.; Tucchi, M. & Zheng, T. (2010). Powerline communication in a full
electric vehicle, Proceedings of IEEE International Symposium on Power Line
Communications and Its Applications, pp. 331-336, 978-1-4244-5009-1, Rio de Janeiro ,
28-31 March 2010
Bassi, E.; Benzi, F.; Almeida, L. & Nolte, T. (2009). Powerline communication in electric
vehicles, Electric Machines and Drives Conference, pp. 1749–1753, 978-1-4244-4251-5,
Miami, 3-6 May 2009
Beikirch, H. & Voss, M. (2000). CAN-transceiver for field-bus power line communication,
Proceedings of the International Symposium on Power Line Communications and Its
Applications, Limerick, pp. 257–264, April 2000
Benzi, T.; Facchinetti, T. Nolte & Almeida L. (2008). Towards the powerline alternative in
automotive applications, Proceedings of Factory Communication Systems, pp. 259-262,
978-1-4244-2349-1, Dresden, 21-23 May 2008
Advances in Vehicular Networking Technologies
276
CAN. (2009), Retrieved from official web site ( 2009)
CIFAER (2008), Communications Intra-véhicule et Architecture Embarquée Reconfigurable,
French ANR Project 2008-2011. Available at web site www.agence-nationale-
recherche.fr/AAPProjetsOuverts
Claus, C.; Stechele W. (2010), AutoVision - Reconfigurable Hardware Acceleration for
Video-Based Driver Assistance, In: Platzner, Teich, Wehn (Editors): Dynamically
Reconfigurable Systems, ISBN 978-90-481-3484-7, Springer, 2010
De Caro S. & Testa, A. (2009). A Power Line Communication approach for body electronics
modules, Proceeding of Power Electronics and Applications, pp. 1-10, 978-1-4244-4432-
8, Barcelona, 8-10 September 2009
Degardin, V.; Laly, P.; Liénard, M. & Degauque, P. (2006). Impulsive Noise on In-Vehicle
Power Lines: Characterization and Impact on Communication Performance,
Proceedings of IEEE International Power line Communications and Its Applications, pp.
222-226, 1-4244-0113-5, Orlando, 26-29 March 2006.
Degardin, V.; Lienard, M.; Degauque, P. & Laly, P. (2007). Performances of the Homeplug
PHY layer in the context of in-vehicle powerline communications, Proceedings of
Power Line Communications and Its Applications, pp. 93-97, 1-4244-1090-8, Pisa, 26-28
March 2007
FlexRay Consortium. (2009). FlexRay Communication System, Protocol Specification,
Version 2.0. Retrieved from:
Galli, S.; Koga, H. & Kodama, N. (2008). Advance signal Processing for PLCs: Wavelet
OFDM, Proceedings of Power Line Communications and Its Applications, pp. 187-192,
978-1-4244-1975-3, Jeju city, Jeju Island, 2-4 April 2008
Gavette, S. & al. (2006). HomePlug AV Technology Overview, Technical report. Sharp
Laboratories of America. Retrieved fromdownload.microsoft.com/download.
Gouret, W.; Nouvel, F. & El Zein, G. (2006). Additional Network Using Automotive
Powerline Communication, Proceedings of International Conference on Intelligent
Transport Systems Telecommunications, pp. 1087-1092, 0-7803-9587-5, Chengdu, 26-29
March 2006
Gouret, W.; Nouvel, F. & El Zein, G. (2007), High Data Rate Network Using Automotive
Power Line, Proceedings of International Conference on Intelligent Transport Systems
Telecommunications, pp. 1-4, 1-4244-1178-5, Sophia Antipolis, 26-28 March 2007
IEEE P1901 (2008), IEEE P1901 Working group. Retrieved from web official web site
Home Plug (2009). HomePlug Powerline Alliance. Retrieved from official web site
www.homeplug.org
Huck, T., Schirmer, J. & Dostert, K. (2005). Tutorial about the implementation of a vehicular
high speed communication system. in IEEE International Power line Communications
and Its Applications IEEE ISPLC , pp 162-166, 6-8 April, 2005.
J2056/2 Survey. (1994). J2056/2 survey of known protocols. In SAE Handbook. Warrendale,
PA: Soc. Automotive Eng. (SAE), vol. 2.
Leen, G; Hefferman, D. (2001). Vehicles without wires. Computing & Control Engineering
Journal, Volume. N° 12(Issue 5), October (pp. 205-21).
Lienard, M.; Carrion, M.; Degardin, V. & Degauque, P. (2008). Modeling and Analysis on In-
vehicle power line communication channels, Proceeding of IEEE Transaction on
Vehicular Technology, vol 57, N°2, pp. 670-679, 0018-9545
Experiments of In-Vehicle Power Line Communications
277
LIN Consortium. (2003). LIN Specification Package, Revision 2.0.Retrieved from
~subbus.org/( 2009)
Mohammadi, M.; Lampe L.; Lok, M.; Mirabbasi, S.; Mirvakili, M.; Rosales, R. & Van Veen, P.
(2009). Measurement study and transmission for in-vehicle power line
communication, Proceedings of IEEE Power Line Communications and Its Applications,
pp. 73–78, 978-1-4244-3790-0, Dresden, 29-March -1 April 2009
Navet (2008), The Automotive Embedded Systems Handbook, Industrial Information Technology
series, Taylor and Francis , CRC Press, ISBN 978-0849380266, 2008.
Newman, D. (2009). Benchmarking Terminology for Firewall Performance, RFC 2647.
Nolte,T. ( 2006). Share-Driven Scheduling of Embedded Networks. University, Dissertation,
May 2006. Department of Computer Science and Engineering Mälardalen University
Västeras, Sweden, Printed by Arkitektkopia, Västeras, Sweden Distribution , 2006
Nolte,T. & Hansson H.( 2009). Wireless Automotive Communications, Internal Report
available at
/>20Communications.pdf ,2009
Nouvel, F.; El Zein, G. & Citerne, J. (1994). Code division multiple access for an automotive
area network over power-lines, Proceedings of IEEE Vehicular Technology Conference,
pp. 525–529, 0-7803-1927-3, Stockholm, 8-10 June 1994.
Nouvel, F. & Maziéro, P. (2008). X-by-Wire and intra-car communications: power line
and/or wireless solutions, Proceedings of International Conference on Intelligent
Transport Systems Telecommunications, pp. 443-448, 978-1-4244-2857-1, Phuket, 24
October 2008.
Nouvel, F; Gouret, W; Maziéro (2009a), Automotive Network Architecture for ECUs
Communications, in Automotive Informatics and Communicative Systems: Principals in
Vehicular Networks", 28 pp, 2009, ISBN 978-160566338-8, 2009
Nouvel F.; Tanguy, P. & Maziero P. (2009b), What is about next high speed power line
communication systems for in -vehicle networks, Proceedings of ICICS, pp. 533-537,
978-1-4244-4656-8, Macau, 8-10 December 2009
OMEGA (2008), Deliverable D3.1 State of the art, application scenario and specific
requirements for PLC, OMEGA ICT-213311 Project, FP7, Available on web site
Pham, H M.; Pillement S. & Demigny, D. (2009) A Fault-Tolerant Layer For Dynamically
Reconfigurable Multi-Processor System-on-Chip, in Proc. Int. Conf. on
ReConFigurable Computing and FPGAs, pp. 284–289, Cancun, Mexico, Dec. 2009.
Pham, H M.; Pillement, S. & Demigny, D. (2010) Evaluation of Fault-Mitigation Schemes for
Fault-Tolerant Dynamic MPSoC, in Proc. Int. Conf. on Field Programmable Logic and
Applications, 2010
Rubin, A. (2002). Implementing automotive protocols for communications over noisy
battery power lines, Proceedings of the IEEE Conference on Conv. Elect Electron. Eng.,
pp. 306, 1 December 2002
Ribeiro. et al. (2006) Power Line communications : a promising communication system
paragidm for last miles and meters applications, Telecommunications : Advances and
trends in transmissions, pp. 134-154 , ISBN 85-98876-18-6.
Silva, P.; Almeida, L.; Caprini, D.; Facchinetti, T.; Benzi, F. & Nolte, T. (2009). Experiments
on timing aspects of DC-powerline communications, Proceedings of IEEE
Advances in Vehicular Networking Technologies
278
international Conference on Emerging Technologies & Factory Automation, pp. 1674-
1677, 978-1-4244-2727-7, Palma de Mallorca, Spain, September 22-25 2009
Spidcom (2008). Spidcom Inc., Retrieved from official web Official web site
.
Tanguy P.; Nouvel, F. & Maziéro, P. (2009b), Power Line Communication standards for in-
vehicle networks, pp. 533-537, 978-1-4244-5347-4/09, Lilles, 20-22 October 2009
Tanguy, P.; Nouvel, F. (2010). In-Vehicle PLC Simulator Based on Channel Measurements,
in next Proceedings of International Conference on Intelligent Transport Systems
Telecommunications, Kyoto, 9-11 November 2010.
Umehara, D.; Morikura, M.; Hisada, T.; Ishiko S. & Satoshi, H. (2010). Statistical Impulse
Detection of In-Vehicle Power Line Noise Using Hidden Markov Model,
Proceedings of Power Line Communications and Its Applications, pp. 341-346, March
2010.
Valéo (2006). Valéo Inc., Electrical and Electronic Distribution Systems: Focus on Power Line
Communication. Retrieved from official web
Xilinx, Inc (2004). PowerPC 405 Processor Block Reference Guide, 2004
Xilinx, Inc (2008). Early Access Partial Reconfiguration User Guide UG208, September 2008.
Xilinx, Inc (2009). MicroBlaze Processor Reference Guide UG081 (v10.3), 2009
Yamar, 2009, , last access 20.09.2009
Yabuuchi, Y.; Umehara, D.; Morikura, M.; Hisada, T.; Ishiko ,S. & Horihata, S. (2010).
Measurement and Analysis of Impulsive Noise on In-Vehicle Power Lines,
Proceedings of Power Line Communications and Its Applications, pp. 325-330,
March 2010.
Zhang, N.; Zhu, X.; Liu, L.; Yu, C.; Zhang, Y.; Dong, Y.; Zhang, H.; Kuai, Z. & Hong, W.
2009. Measurement and characterization of wideband channel for in-vehicle
environment. In Proceedings of the 4th international Conference on Radio and Wireless
Symposium (San Diego, CA, USA, January 18 - 22, 2009). IEEE Press, Piscataway, NJ,
183-186.
15
Kinesthetic Cues that Lead the Way
Tomohiro Amemiya
NTT Communication Science Laboratories
Japan
1. Introduction
Wayfinding is of vital importance to pedestrians walking in unfamiliar areas. Generally,
pedestrians rely on directional information, street names, and landmarks [Bradley &
Dunlop, 2005]. Recently, many mobile devices, such as mobile smart phones, can provide us
with detailed digital maps, global positioning information, and navigational information.
These location-based data and services are usually presented on visual displays. However,
the visual displays in mobile devices are very small, which makes it hard to see and use the
data. With the increasing complexity of information, and the variety of contexts of its use, it
becomes important to consider how other non-visual sensory channels, such as audition and
touch, can be used to communicate necessary and timely information to users. Additionally,
there are a number of user groups, such as visually impaired people and the emergency
services, who also require non-visual access to geographical data.
Kinesthetic stimulation, such as that for pulling or pushing the hand, has the potential to be
more intuitive and expressive than cutaneous stimulation, such as rumbling vibration, in
conveying direction information because force feedback devices can indicate a one-
dimension direction directly. Although a substantial number of force feedback devices have
been developed in the last twenty years, most of them use either mechanical linkage to
establish a fulcrum relative to the ground (Massie & Salisbury, 1994), use a huge air
compressor (Suzuki et al., 2002; Gurocak et al., 2003), or require wearing a heavy device
(Hirose et al., 2001). Physical constraints mean that none of them can be used in portable
information devices. Some portable “torque” displays have been proposed, based on the
gyro effect (Yano et al., 2003) or angular momentum change (Tanaka et al., 2001) have been
proposed; however, they can produce neither a constant force nor a translational force
without also producing a reaction force; they can generate only a transient rotational force
since they use a change in angular momentum. Recently, there have been a number of
proposals for generating both constant and directional forces without an external fulcrum
by using two oblique motors whose velocity and phase are controlled (Nakamura & Fukui,
2007), by shifting the center-of-mass of a device dynamically to simulate kinesthetic inertia
(Swindells et al., 2003), and by producing an air pressure field with airborne ultrasound
(Iwamoto et al., 2008).
In contrast, our idea is to exploit the characteristics of human perception to devise a new
force perception method for portable information devices that can generate a translation
force sensation with a long duration (Amemiya et al. 2005; Amemiya and Maeda 2009). The
method uses an asymmetric oscillation, where brief intense pulses of acceleration alternate
Advances in Vehicular Networking Technologies
280
with longer periods of low-amplitude recovery. Although the net acceleration is zero,
humans perceive a sustained force sensation in the direction of the pulses. This is attributed
to the nonlinear relationship between perceived acceleration and physical acceleration. We
built a handheld prototype that generates periodic motion through asymmetric acceleration,
in which asymmetric oscillation is generated by a swinging slider-crank mechanism. Our
previous findings indicated that the pulse frequency determines the effective generation of
the kinesthetic illusion of being pulled. In this chapter, we present a new hybrid
configuration comprising a swinging slider-crank mechanism and a cam mechanism as an
approach to fabricating a smaller force feedback system for portable information devices
and describe an experiment in which we conducted an empirically examined turn-by-turn
navigation with the device used by pedestrians with visual impairments. The results show
the device intuitively conveys turning instructions and has potential to be used by untrained
users.
2. Pseudo-attraction force
2.1 Haptic sensory illusion
The study of illusions can provide valuable insights into not only human perceptual
mechanisms but also the design of new human interfaces. To generate a sustained
translational force without grounding, we focused on the characteristics of human
perception, which until now have been neglected or inadequately implemented in haptic
devices. Although we human beings always interact with the world through human sensors
and effectors, the perceived world is not identical to the physical world. For instance,
different spectra can elicit the same color in human perception. When we watch television,
the images on TV (a combination of RGB colors) we see are different from what we see
through windows, i.e., a natural image is a composition of all wavelengths of light.
Furthermore, animation actually consists of a series of still pictures in a flip book. Different
stimuli can produce almost the same percept, which, though it may seem strange, is normal
for humans. Since some illusions are very stable independent of individual variation, we can
apply those illusions in practice, such as in designing human interfaces, if we can figure out
ways to convert them to subjectively equivalent percepts. Hayward has pointed out that
illusions are at the basis of virtually all technological displays (Hayward 2008), mentioning
this also includes haptic interfaces.
2.2 Principle
The kinaesthetic illusion of being pulled or pushed, discovered by the authors (Amemiya et
al. 2005), can be used to design haptic interfaces. Using different acceleration patterns for
two directions to create a perceived force imbalance, the method exploits the characteristics
of human perception to generate a force sensation and thereby produce the sensation of
directional pushing or pulling. Specifically, a quicker acceleration (stronger force) is
generated for a very brief time in the desired direction, while a slower acceleration (weaker
force) is generated over a longer period in the opposite direction. The internal human haptic
sensors do not detect the slower acceleration (weaker force) , so the original position of the
mass is washed out. The result is that the user is tricked into perceiving a unidirectional
force. This force sensation can be made continuous by repeating the motions. If the
acceleration patterns are well considered and designed, a kinesthetic illusion of being pulled
can be created because of this nonlinearity.
Kinesthetic Cues that Lead the Way
281
2.3 Requirements
There are still many aspects of the manifestation of the kinaesthetic illusion of the pseudo-
attraction force that are not well understood, but putative mechanisms have been
accumulating. We know that no directional force is felt if the mass is merely moved back
and forth, but that using different acceleration patterns for the two directions to create a
perceived force imbalance produces the perception of a pseudo-attraction force (Amemiya &
Maeda, 2009). The frequency of the oscillation plays an important role in eliciting the
perception of a pseudo-attraction force. Oscillations with high frequency might create a
continuous force sensation, but previous experimental results have shown that the
performance decreases steadily at frequencies over ten cycles per second (Amemiya et al.,
2008). In contrast, oscillations with low frequency tend to be perceived as a discrete knocked
sensation. If we wish to create a sustained rather than a discrete force sensation, such as the
sensation of being pulled continuously, the frequency should be in the five to ten cycles per
second range. In addition, changes in the gross weight and the weight of the reciprocating
mass affects the perceived force sensation. The threshold of the ratio of the gross weight and
the weight of the reciprocating mass is 16%, which is a rough standard for effective force
perception in the developed prototype (Amemiya & Maeda, 2009).
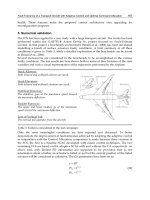
3. Hardware design
Our first prototype used a swinging-block slider-crank mechanism to create an asymmetric
oscillation [Fig. 1(a)]. In the mechanism, a circular motion of constant speed (crank OB) is
transformed into a curvilinear motion since a swinging linkage BC slides and turns around
point A. The end point on the curvilinear motion (point C) is connected with a rod (point D),
which slides along a linear slider with asymmetric acceleration back-and-forth. Because of
the length of the linkages, especially linkage CD (rod), the overall length of the mechanism
tends to be large at about 175 mm (Amemiya and Maeda 2008; 2009). Figure 1(b) shows the
new mechanism, which is the equivalent mechanism of the previous one but with the length
of linkage CD decreased to virtually zero. As in the previous prototype, a circular motion of
constant speed (crank OB) is transformed into a curvilinear motion by a swinging-block
slider-crank mechanism. The difference is that the end point on the curvilinear motion
(point C) slides along a grooved cam, whose shape is a circular arc with a radius of CD, with
point D as the center of the arc. This produces a reciprocating motion with asymmetric
oscillation.
The mechanisms in Fig. 1 have a single DOF (degree of freedom). We previously developed
a prototype of a two-dimensional force display by having one module based on the slider-
crank mechanism mounted on a turntable. The direction of the force display module was set
by driving the turntable with a belt drive system. Turntable rotation, however, took
considerable time, which meant that immediacy was lost. To overcome the problem of
turntable rotation, we adopted the summation of linearly independent force vectors. We
then fabricated a new 2-DOF prototype to generate a force sensation in at least eight
cardinal directions by the summation of linearly independent force vectors. To create the
force display, we stacked four layers, each containing a single module and two of which
were orthogonal. By combining the force vectors generated by each module, the force
display can create a force sensation on a two-dimensional plane more quickly than the
turntable approach. The force display has the potential to create a force sensation in any
arbitrary direction on a two-dimensional plane if the amplitude of the force vector can be
changed. The asymmetric oscillation (F(t)) is given by
Advances in Vehicular Networking Technologies
282
Fig. 1. Mechanisms for generating asymmetric oscillation in first prototype (a) and new one
(b). The two mechanisms move identically
n
j
jj
j
dx t
Ft m e
dt
2
2
1
()
()
=
=
∑
(1)
where m
j
is the weight in module j, n is the number of modules, and d
2
x
j
/dt
2
is the
acceleration generated by module j. The acceleration d
2
x
j
/dt
2
is given by the second
derivative with respect to time of the motion of the weight x
j
. The equation for the motion of
the weight in module j is
j1jj1j 31j j
x t lcos t d lcos t l l t
2
() ( ) { ( 1)sin }
ωμ ω μ ω
=+− +−− (2)
where
j
j
l
ld ld t
2
22
11
2cos
μ
ω
=
+−
(3)
and x
j
(t) = OD, d = OA, l
1
= OB, l
2
= BC, l
3
= CD, and ω
j
t = AOB in Fig. 1. The ω
j
is the
constant angular velocity, and t is time. In the prototype, d = 28 mm, l
1
= 15 mm, l
2
= 60 mm,
l
3
= 70 mm, and n = 4, and the unit vectors are <e
j
, e
j+1
> =0, ||e
j
|| =1. All m
j
and ω
j
values
are identical, with m
j
= 40 g, ω
j
/2π= 5 Hz.
In the developed 2-DOF prototype, the output shaft of each motor (DC 6.0 V, 2232R006S;
Faulhaber) is mounted in a roller made of nylon. The roller drives the crank wheel by
friction. The external diameter of the motor roller is 4 mm, and that of crank wheel is 44 mm.
The reduction ratio is basically 1:11, but it changes slightly as a result of changes in factors
such as temperature or pressure. The prototype weighs approximately 430 g. The diameter
of the base is the same as that of a compact disc (i.e., 120 mm). The prototype is 36-mm thick.
Each weight on the slider is equipped with a photo-interrupter (PM-R24; SUNX Ltd.) to
detect its position. The speed of each crank is stabilized at five counts per second by closed
Kinesthetic Cues that Lead the Way
283
feedback loop control (P control) with a microprocessor so that the signal intervals of the
photo-interrupters are close to 200 ms. When combining two orthogonal force vectors, the
phases of the cranks are synchronized by another closed feedback loop (PID control) so that
the onset intervals of the photo-interrupters are close to zero.
Fig. 2. Structure of the new prototype for generating pseudo-attraction force on a two-
dimensional plane
4. Hardware evaluation
Figure 3 shows the measured acceleration profile generated by the device at five counts per
second. Acceleration values were calculated from the position data of each weight, which
were acquired with a laser sensor (Keyence Inc., LK-G150, 10 kHz sampling) with the
bottom of the device fixed to a base. The acceleration profile of the top layer differed slightly
from the others, due its distance from the fixed base. The effect of oscillation was augmented
by the principle of leverage, leading to some degree of measurement error. The acceleration
amplitude reached about 50% of the theoretical acceleration peak. We assume that the
Advances in Vehicular Networking Technologies
284
friction drive transmitted less torque than the previous gear drive. This clarified that there is
a trade-off between the torque transmission efficiency and noise level when we select the
friction drive or the gear drive.
Figure 4 shows examples of the response profiles of phase synchronization. The onset
intervals between pairs consisting of two orthogonal modules were acquired from the
photo-interrupters when the bottom of the device was fixed to the base. An onset interval of
zero means that the two orthogonal modules are synchronized. The phases were
synchronized within five seconds, which showed that the force display created a force
sensation in the eight cardinal directions on a two-dimensional plane.
Fig. 3. Acceleration profile calculated from the position data measured with a laser sensor.
The data were processed by a seventh order LPF Butterworth filter with a cut-off frequency
of 100 Hz
To drive the crank, the first prototype used a pinion gear and crown gears, whose axes were
relatively displaced. The relative displacement of the gear axes caused gear noise, which
annoyed the users. In fact, many people, including people who are blind, who have held the
previous prototype, have complained about the noise. The sound pressure level of the noise
generated by the previous prototype was measured in an anechoic room at NTT
Communication Science Laboratories. A sound level meter (Rion, Inc., NL-31 Class 1) was
used to measure the noise with the A-weighted sound pressure level (SPL). The sound level
meter was fixed to a tripod at a height of 1.0 m from the ground and 30 cm from the
prototype. The measured noise SPL showed that with the gear drive in the prior prototype,
the noise level exceeded 60 dB(A), whereas environmental noise level was 15 dB(A). In
contrast, the new prototype uses friction drive, and its noise level at frequencies of 3, 5, 10
counts per second does not exceed 50 dB(A), which shows that the friction drive emits much
less noise.
Kinesthetic Cues that Lead the Way
285
Fig. 4. Examples of measured phase synchronization responses for combinations of each
module. The onset intervals obtained by the photo-interrupters were controlled to be close
to zero by changing the angular velocity of the motor in the force display
5. User studies
We performed two user studies to investigate the applicability of the force display to
pedestrian navigation. One was a psychophysical pilot study, which revealed that people
who held the force display clearly sensed a directed force. The other was a navigation
experiment related to predefined route guidance, in which people with visual impairments
used the force display.
5.1 Directional perception
Five people without visual impairments (three right-handed men and two right-handed
women, aged 22-34 years, 25.4
±5.3), who were paid volunteers, participated in the
psychophysical pilot study. None of the participants had any previous experience with force
display prototypes. They were required to reply with one of eight cardinal directions after a
five-second oscillating stimulus (north was defined as 0 degrees and the forward direction,
and east as 90 degrees and right) without any prior training. Each participant experienced
eight conditions × five trials, for a total of 40 trials (randomized). Visual and auditory effects