Advances in Vibration Analysis Research Part 12 ppt
Bạn đang xem bản rút gọn của tài liệu. Xem và tải ngay bản đầy đủ của tài liệu tại đây (6.36 MB, 30 trang )
Analysis of Vibrations and Noise to Determine the Condition of Gear Units
319
frequencies appear in a spectrum. If time-frequency analysis is used, it can be determined
not only in what way frequency components of non-stationary signals change with time but
also their intensity levels.
Frequency analysis is often used in diagnostics, but good results are obtained more or less
only in relation to periodical processes without local changes. A presence of a damage or
fault leads to changes in dynamic parameters of a mechanical system. This influences the
frequency spectrum. Monitoring frequency reaction is one of the most common spectral
methods to identify the condition of a gear unit. With classical frequency analysis, time
description of vibration is transformed into frequency description, and changes within a
signal are averaged within the entire time period. This means that local changes are lost in
the average of the entire function of vibrations. As a result, it is very difficult if not
impossible to define local changes.
These deficiencies are eliminated with the use of the time-frequency analysis: local changes
that deviate from the global periodical oscillation are expressed with the appearance or
disappearance of individual frequency components in a spectrogram. A signal is presented
simultaneously in time and frequency.
Individual frequency components often appear only from time to time in signals related to
technical diagnostics. On the basis of classical frequency analysis of such signals, it is not
possible to determine when certain frequencies appear in the spectrum. The aim of time-
frequency analysis is to describe in what way frequency components of non-stationary
signals change with time and to determine their intensity levels.
Fourier, adaptive and wavelet transforms and Gabor expansion are representatives of
various time-frequency algorithms. The basic idea of all linear transforms is to perform
comparison with elementary function determined in advance. On the basis of various
elementary functions, different signal presentations are acquired.
Qian improved and concluded adaptive transform of a signal to a large extent although
many authors had been developing algorithms without interference parts, which make
individual transforms less useable as opposed to Cohen’s class.
Adaptive transform of a signal x(t) is expressed as follows:
(
)
(
)
pp
p
xt B h t=⋅
∑
(3)
where analysis coefficients are determined by means of the following equations
,
pp
Bxh= (4)
expressing similarity between the measured signal x(t) and elementary functions h
p
(t) of
transform. The original signal represents the starting point with parameter values p=0 and
x
0
(t)=x(t). In the set of desired elementary functions, h
0
(t) is searched for that is most similar
to x
0
(t) in the following sense
() ()
2
2
max ,
p
phpp
Bxtht= (5)
for p = 0. The next step includes the calculation of the remaining x
1
(t)
(
)
(
)
(
)
1pppp
xtxtBht
+
=−⋅
(6)
Advances in Vibration Analysis Research
320
Without giving up the generalisation idea, hp(t) is to have a unit of energy representation of
a signal.
()
2
1
p
ht
=
(7)
The energy in the remaining signal
() ()
222
1
ppp
xt xt B
+
=− (8)
The equation (6) is repeated in order to find h
1
(t) that would suit best x
1
(t), etc. One
elementary function h
p
(t) that suits best x
p
(t) is found in each step. The primary purpose of
adaptive signal representation is to identify a set of elementary functions {h
p
(t)}, most
similar to time-frequency structure of a signal, and at the same time satisfy equations (3)
and (4).
If Wigner-Ville distribution is used for both sides of the equation (3), and if equations are
organised into two groups, the result is as follows:
() ()
(
)
()
2
,,*,,
WV p WV p p q WV p q
ppq
Pxt BPht BBP hh t
ω
ωω
≠
=⋅ +⋅
∑∑
(9)
The first group represents elementary signal components and the second one represents
cross interference terms.
A new time-dependent adaptive spectrum can be defined in the following way:
() ()
2
,,
ADT p WV p
p
Pt BPht
ω
ω
=⋅
∑
(10)
As an adaptive spectrum based on representations, it is called an adaptive spectrogram. As
opposed to Wigner-Ville distribution, it contains no interferences and no cross terms, and it
also satisfies the condition of energy conservation.
() ()
2
1
,
2
ADT
xt P t dtd
ω
ω
π
=
⋅⋅⋅
⋅
∫∫
(11)
The basic issue related to linear presentations is the selection of elementary functions. When
it comes to Gabor expansion, a set of elementary functions comprises time-shifted and
frequency modulated prototype window function w(t). In relation to wavelets, elementary
functions are acquired by scaling and shifting a mother wavelet ψ(t). In these two examples,
structures of elementary functions are determined in advance. Elementary functions related
to adaptive representation are rather demanding.
As adaptive transform permits arbitrary elementary functions, it is, generally speaking,
independent from the choice of elementary functions h
p
(t).
Elementary functions, used for adaptive representation of a signal with equation (3), are
very general but this is not always so in practice. It is desirable that elementary functions are
localised in regard to time and frequency in order to emphasize time dependence of a signal.
Also it must be possible to use the presented algorithm in a relatively simple way. In
relation to adaptive representation, a Gauss type signal with its very favourable features is
considered a basic choice.
Analysis of Vibrations and Noise to Determine the Condition of Gear Units
321
The calculation of an adaptive spectrogram begins in a wide time range of a measured
signal. Then the range must be decreased, depending on what the goals are. Fourier integral
is among the elementary operations of searching for a suitable elementary function, and so
the described calculation process is very effective. The accuracy of approximation depends
primarily on the size of time-frequency interval. With narrower intervals, the representation
is more accurate, but the calculation time is longer. This means that it is necessary to find a
compromise between the accuracy of approximation and its efficiency.
4. Practical example
The measurements were performed in the test plant of the Laboratory for Pumps,
Compressors and Technical Acoustics of the Faculty of Mechanical Engineering, University
of Ljubljana. The room in which the tests were carried out was not specially adjusted for
performing acoustic measurements as the noice level was between 36 and 42 dB(A). This
level can be achieved also in an industrial environment that is located adequately far away
from intense noice sources.
A single stage gear unit with a helical gear unit with straight teeth integrated into it was
used.
Two pairs of spur gear-units, built in a single stage gear-unit, were used for noise
measurements. One of the pairs had a crack and the other one was without it. Thus, tests
were carried out, using faultless and faulty gear units.
The aim of the measurements was to determine the presence of individual changes in a gear
unit. The measured signal of a faultless gear unit and the signal of a faulty gear unit were
compared to determine the gear unit condition.
Measurements were carried out under operating conditions normally associated with the
relevant type of a gear unit. A ground gear pair used was a standard gear pair, with the
teeth quality 6, but it had a crack in the tooth root of a pinion. It is presented in Fig. 4.
Fig. 4. A pinion with a crack in the tooth root
Adaptive time frequency transform was used to determine the presence of a crack in the
tooth root, whereby the LabVIEW software tools, including the author’s own software
modules, were used [9].
The length of the signal of measured values was 1 s; on an average, the signal was
composed of 192000 measuring points. At the time of measurement, the rotational frequency
was 28,5Hz. The number of teeth of the pinion was 18, and of the gear unit 99.
Advances in Vibration Analysis Research
322
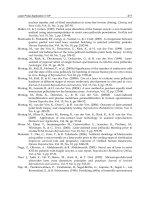
In Fig. 5, the acoustic image with sound level of a gear unit is presented, where the
engagement area of a gear pair can be observed as a noice source, wheras in Fig. 6, the
adaptive spectrogram of noise source is presented; it is not possible to note any rhythmic
pulsation of harmonics, with the exception of typical frequencies, defined on the basis
typical frequencies components. Some pulsation sources are indicated (but not expressed)
and their stohastics. It is very interesting to monitor the increase or decrease (even complete
disappearance) in appropriate frequency components with pulsating frequency.
In Fig. 7, the acoustic image of a gear unit with a crack in the tooth root is presented, where
it is possible to note the engagement area of a gear pair as a noice source, and in Fig. 8 and
Fig. 9, the adaptive spectrogram of noise source is presented. Rhythmic pulsation of some
frequency can be observed. This is typical for meshing frequency 515 Hz. Pulsating is
expressed only in relation to the presence of a crack. Pulsation reflects a single engagement
of a gear pair with a crack.
To determine the presence of a crack in the tooth root, adaptive transform was used for
vibration analysis. In relation to adaptive spectrogram, adaptive representation for signal
decomposition, prior to Wigner-Ville distribution, was used.
A fine adaptive time-frequency resolution is characteristic of an adaptive spectrogram due
to limited features of elementary functions. Consequently, time-frequency resolution of the
transform is adapted to signal characteristics. As an elementary function, it is possible to
apply Gauss function (impulse) and linear chirp with Gauss window. If a signal contains
linear chirps resulting from a linear change in the rotational frequency of a gear unit, it is
possible to use an adaptive spectrogram to determine in what ways a possible frequency
modulation is reflected in the time-frequency domain. The transform calculation time
increases, along with the larger amount of data and the increased number of cycles required
to search for an adequate elementary function.
Fig. 5. An acoustic image with noise source of a gear unit of a faultless gear
Analysis of Vibrations and Noise to Determine the Condition of Gear Units
323
Fig. 6. A adaptive spectrogram of a gear unit of a faultless gear
Fig. 7. An acoustic image with noise source of a gear unit with a crack in the tooth root
Advances in Vibration Analysis Research
324
Fig. 8. A adaptive spectrograms of a gear unit with a crack in the tooth root; position 1
Fig. 9. A adaptive spectrograms of a gear unit with a crack in the tooth root; position 2
Analysis of Vibrations and Noise to Determine the Condition of Gear Units
325
The vibration signal of measured values was 1 s long and composed of, on an average, 50000
measuring points. At the time of measurement rotational frequency was 20 Hz. Adaptive
spectrograms in relation to Gabor transforms are presented for comparison. The length of
the window is 6800 points, which is 15% more that the length of the period of one rotation of
a gear pair.
Calculation time required for adaptive spectrogram is at least 10 times longer than the
calculation time for the Gabor transform, but the resolution of the adaptive transform is, on
an average, two times better.
Fig. 10 shows Gabor spectrogram; no rhythmic pulsation of harmonics can be noted, with
the exception of typical frequencies, determined on the basis of power spectrum. When it
comes to adaptive spectrogram (Fig. 11), with a higher level of energy accumulation in the
origins, it is possible to note some pulsation sources but they are not very expressed. It is
very interesting to monitor how appropriate frequency components with rotational
frequency of 20 Hz increase or descrease or even completely disappear. This phenomenon is
typical of the 3rd harmonic, 1530 Hz is expressed, only in relation to the presence of a crack.
The phenomenon is much more expressed in relation to the adaptive spectrogram (Fig. 13)
than in relation to the Gabor spectrogram (Fig. 12).
The spectrogram evaluation can be based on an average spectrogram, which represents an
amplitude spectrum of a Fourier or adaptive transform of a measured signal, and on
observing pulsating frequencies of individual frequency components.
Fig. 10. Gabor’s spectrogram of a faultless gear unit
Advances in Vibration Analysis Research
326
Fig. 11. Adaptive spectrogram of a faultless gear unit
Fig. 12. Gabor’s spectrogram of a gear unit with a pinion with a crack
Analysis of Vibrations and Noise to Determine the Condition of Gear Units
327
Fig. 13. Adaptive spectrogram of a gear unit with a pinion with a crack
5. Conclusion
The resolution in time and in place achieved with the use of an acoustic camera with its
specific algorithm, which functions in time domain, and of specifically located microphones
for acoustic source visualization is better than with any other acoustic system.
Industrial gear units were used for noise analysis, the purpose of which was to identify
faults. The use of the presented methods can improve both, the safety of operation and the
reliability of monitoring operational capabilities.
The reliability of monitoring life cycle of a gear unit is improved with the use of appropriate
spectrogram samples and the achievement of a clear presentation of the pulsation of
individual frequency components, which, along with the average spectrum, for a criterion
for evaluating the condition of a gear unit.
When it comes to life cycle design, it is necessary to use an adequate method or criterion to
monitor the actual condition of a device and particularly of its vital component parts, which
can have a considerable impact upont the operational capability. If faults and damages are
detected in time, it is possible to control the reliability of operation to a great extent. The
prediction of the remaining life cycle of a gear unit is improved with the use of reliable fault
identification methods.
In this contribution, fault identification in industrial gear units is based on vibration
analysis; it increases the safety of operation and, consequently, of monitoring operational
capabilities.
The life cycle of a gear unit can be monitored more reliably with the use of appropriate
spectrogram samples and a clear presentation of the pulsation of individual frequency
components that, in addition to the average spectrum, represent a criterion for evaluating
the condition of a gear unit. Adaptive time-frequency representation is clearer, without
Advances in Vibration Analysis Research
328
increased dissemination of signal energy into the surroundings, and it enbles reliable fault
identification.
6. References
Christensen, J.J. and Hald, J. (2004). Beamforming, B&K technical reviev 1,
Hald, J. (2005). Combined NAH and Beamforming Using the Same Array, B&K technical reviev 1,
Heinz, G. (2004). Locating Noise Sources, A Comparison Between Different Noise Localization
Techniques, GFaI Report 001-06-21,
Fellner, W. (2004). Die Akustische kamera, Eine revolutionäre Lösung zum Orten
Schallemissionen, Newsletter für professionelle schall und
schwingungmesstechnik, Nr.7/2004, Wien
Suresh, S. (1998). Fatigue of Materials, Cambridge University Press
Buch, A. (1988). Fatigue Strength Calculation, Trans Tech Publications
Stephens, R.I. ; Fatemi, A. ; Stephens R.R ; Fuchs H.O. (2001). Metal Fatigue in Engineering,
John Wiley & Sons Inc., New York
Belšak, A. (2006). Časovno-frekvenčna analiza stanja zobniških gonil, doctoral thesis, University
of Maribor, Faculty of Mechanical engineering
Belšak, A. (2004). Razvoj sistema za odkrivanje napak zobniškega gonila, master thesis,
University of Maribor, Faculty of Mechanical engineering
Qian S., Chen D. (1996). Joint Time-Frequency Analysis, Prentice Hall
Fladrin, P. (1999). Time-Frequency/Time-Scale Analysis, Academic Press
Mertins, A. (1999). Signal Analysis, John Wiley & Sons Inc., New York
Bendar, J.S.; Piersol, A.G. (2000). Random Data, John Willey & Sons
Rohatgi, V.K. ; Saleh, A.K. (2001). An Intruduction to Propability and Statistics, John Willey
& Sons
Belšak, A. ; Flašker, J. Detecting cracks in the tooth root of gears, Engineering Failure Analysis,
Vol. 14(8), pp. 1466-1475
Robert, J. ; Marks, II. (1991). Introduction to Shannon Sampling and Interpolation Theory,
Springer Verlag, New York
Carmona, R. ; Hwang, W.L. ; Torresani B. (1998). Practical Time-Frequency Analysis, Academic
Press, San Diego
Feichtinger, H. ; Stroms T. (1998). Gabor Analysis and Algorithms: Theory and Applications,
Birkhasuer
JefWu, C. F. ; Hamada, M. (2000)., Experiments, John Willey & Sons
17
Methodology for
Vibration Signal Processing of an
On-load Tap Changer
Edwin Rivas Trujillo
1
,
Juan C. Burgos Diaz
2
and Juan C. García-Prada
3
1
Universidad Distrital Francisco José de Caldas-Facultad de ingeniería
Carrera 7 No 40-53 Bogotá
2
E.P.S Universidad Carlos III de Madrid -Departamento de Ingeniería Eléctrica
C/ Butarque 15, 28911Madrid,
3
E.P.S Universidad Carlos III de Madrid -Departamento de Ingeniería Mecánica
C/ Butarque 15, 28911Madrid,
1
Colombia
2,3
España
1. Introduction
A great percentages of transformer failures occur in the on-load tap changer (OLTC) (R.
Jongen & P. Morshuis et al.,2007) Fig 1. The OLTC is the only moving part of a power
transformer and its elements suffer from great mechanical and electrical stress.
The condition of some of the elements of the OLTC (diverter switch, resistors, contacts, etc.)
can be evaluated through periodic inspections. However, these inspections require having
the transformer out of service for a relatively long period. In addition, it is expensive and
requires a skilled staff.
Vibration is a suitable parameter to monitor the mechanical condition of an OLTC (P.
Kang,et al.,2000). Vibrations from a working OLTC are often readily available, but obtaining
them from a defective OLTC is not as easy.
Previous studies (P. Kang et al.,2001) show that OLTC failures can be diagnosed by using
vibration envelope analysis. Wavelet analysis is an effective technique for extracting the
main characteristics of the vibration signal, over the whole spectrum, without requiring a
dominant frequency band in the vibration signal.
The purpose of this paper is to present a methodology implemented to find the OLTC
diagnostic indicators (Number of vibration bursts, Vibration burst amplitude, Time between
vibration bursts, Main frequency bands in the burst, energy of the vibration bursts). To
obtain these indicators pre-processing and processing of the vibration signal is needed.
In the pre-processing stage the signal is synchronized, normalized and then Hilbert
transform is applied to obtain the envelope. In the signal processing stage a technique in
time-frequency domain, Discrete Wavelet Transform, is used and then a threshold based on
Advances in Vibration Analysis Research
330
preserved energy is applied in order to determine the characteristic bursts of the vibration
signal both the OLTC in good condition and with faults.
2. OLTC
An OLTC (Fig. 1) modify the transformer voltage ratio in response to voltage variations in
the electrical system, in order to maintain transformer output voltage. The OLTC changes
the tapping connection of the transformer winding without disconnecting it out of service.
An OLTC comprises the following elements:
• Tap Selector
• Diverter Switch
An OLTC always switches between two consecutive taps. The tap selector pre-selects the
next tap to work on and does not switch load current. The tap selector is inserted in the
transformer tank or attached to it, and it is refrigerated by the same oil refrigerating the
windings.
The tap selector is driven by a motor drive mechanism synchronized with the diverter
switch. The tap selector and the mechanical energy accumulator of the diverter switch are
the first elements to move when a tap change is ordered. The tap selector moves only to the
tap preceding the current tap or to the tap next the current tap.
The diverter switch is the element transferring the load current, without load interruption,
from the current tap to the pre-selected tap.
3. Vibration signal measurements
A test program was carried out to get vibration signals with different types of failures. As it
is no easy to record in field vibration signals from a given OLTC with different kind of
failures, failures were simulated physically in the laboratory.
An OLTC (Fig. 1) type D I 1200 150/110 12 23 3 W, from an 80 MVA single-phase
autotransformer 250.000/150.000 ±10x1517/17000 V was used. The OLTC is rated at 1200 A
and has 12 taps, 23 regulation positions, an inverter type pre-selector and 3 intermediate
positions when the inverter is in operation.
The OLTC was not mounted on the transformer tank and was not immersed in oil. So
pattern vibration changes slightly because no viscous lubrication is provided. Nevertheless
the experiment is valid in the essence.
The vibration measurements were obtained using an accelerometer, which measures tank
vibrations during the tap-change operation. A piezoelectric accelerometer was used with a
sensitivity of 1.02±0.02pC/ms
2
and a frequency range of 1 to 12 kHz. The data acquisition
card had PCMCIA architecture, 12-bit resolution, 50KS/s per channel and variable input
range of ±0.05V to ±10V. The measuring system is shown in Fig. 2.
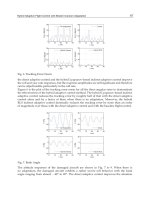
Vibration signal was recorded from the OLTC in good working condition. Fig. 3 shows the
vibration signal during a tap change in which the tap selector is operative. Six bursts can be
distinguished in the vibration signal.
- Burst 1: Starting of the motor drive.
- Burst 2: Activation of the Geneva drive. The tap selector contact attached to the
previous tap (n-1) starts moving.
- Burst 3: Moving contacts of the tap selector reach the final tap (n+1).
Methodology for Vibration Signal Processing of an On-load Tap Changer
331
- Burst 4: The movement of the Geneva drive ends.
- Burst 5: Group of bursts corresponding to the diverter switch’s activation.
- Burst 6: The motor drive stops.
Fig. 1. OLTC used in the experimental measurements
Fig. 2. Measuring system
Advances in Vibration Analysis Research
332
Fig. 3. Vibration signal during a tap change
4. Test programme
Some of the failures simulated in the experiment were: Broken contact bar (Fig. 4) and tap
selector contacts damaged by arcing (Fig. 5), worn selector contacts, etc.
Fig. 4. Broken contact bar
Methodology for Vibration Signal Processing of an On-load Tap Changer
333
Fig. 5. Tap selector fixed contacts damaged by arcing
5. Vibration signal treatment
Vibration signal analysis is used to detect on load tap changer failures. According to ( P.
Kang & D. Birtwhistle, 1998) the main parameters for diagnosis are: Number of vibration
bursts, vibration burst amplitude, time between vibration bursts.
When two consecutive changes are made from the same initial tap to the same final tap, the
obtained records are not identical. Large differences can be observed in amplitudes and in
time between vibration bursts. Consequently, some kind of signal processing must be used
when using vibration monitoring to detect OLTC faults.
The OLTC vibration signals are subjected to the treatment process shown in Fig. 6. The
purpose and meaning of each treatment is summarised below.
Normalization
Synchronization
Envelope
Wavelet
Transform
Bursts
Detection
X(t)
Original
Signal
Fig. 6. Process for obtaining the wavelet envelope spectrum
A. Normalization and synchronization of signals
In first place vibration signals are synchronised, so that they start at the same time. Then,
signals are normalised using their RMS value.
As in our study the sampling rate is 50kS/s, in a 10s record there are 500 000 samples (Fig.2).
By eliminating the samples with no information will the signals are reduced to 267,001-
269,001 samples.
Advances in Vibration Analysis Research
334
B. Envelope analysis
The main information in the vibration signal is in the signal envelope. So, once the vibration
signals are normalised and synchronised, the Hilbert transform is used to obtain the
envelope (A. I. Zayed., 1998).
The analytic signal corresponding to a real signal
()xt is defined as () ()xt jxt
+
, where the
real part of the analytical signal is the original signal and the imaginary part,
()xt is the
Hilbert transform of
()xt . The magnitude of this complex analytical signal forms the signal
envelope and is always a positive function.
As mentioned the vibration signal is not exactly the same when repeated a tap change. Even
some spurious bursts can appear. To solve this problem the vibration signal is converted
into energy with the same number of intervals for each input signal. The average energy
signal is computed, obtaining signals containing bursts with a similar number of samples.
For the correct detection of bursts present in the envelope of the vibration signal is divided
into six time intervals, thus reducing the signal to 640 samples (Fig. 7).
0 1 2 3 4 5 6
-0.02
0
0.02
0.04
0.06
0.08
0.1
0.12
Vibration (m/s )
2
Time(s)
Fig. 7. Average energy of the envelope in regular time intervals
C. Discrete wavelet transform
Envelope analysis based on Hilbert transform is used as Wavelet decomposition pre-
processing.
Discrete wavelet transform (DWT) is used to decompose a signal, through two types of
filters (low pass and high pass filter). The number of times the signal is filtered is
determined by the applied decomposition level. In this way, a set of coefficients
(approximation and detail coefficients) are obtained at each decomposition level.
Discrete wavelet transform (DWT) of a signal f (t) is defined by (S. Mallat, 1988):
Methodology for Vibration Signal Processing of an On-load Tap Changer
335
() [] []
j
jjj
n
nZ
DWTf t d n a n
ψ
−∞ ∈
=+
∑∑ ∑
, jZ
∈
(1)
[]
j
an : Approximation coefficients
[]
j
dn: Detail coefficients
j
n
ψ
: scaling function.
These coefficients represent part of the original signal, for certain frequency bands and time
intervals.
For the implementation of discrete wavelet transform to the envelope of the vibration signal
in a first instance we must select the mother wavelet and then decompose the signal. The
signal is reconstructed using Inverse Wavelet Transform (IDWT).
Mother wavelet selection
In order to have an indicator relating the correlation between the processed signal and the
selected mother wavelet Parseval’s theorem is used. This indicator is the sum of the squared
spectrum coefficients of the Fourier transform refer to frequency domain.
22
1
|[]| | |
k
f
tb
N
=
∑∑
(2)
Where N is the sampling period, and b
k
are the coefficients of the Fourier transform
Spectrum.
Then, we use (1) and (2) to apply Parseval’s theorem to the DWT application and we
obtain (3)
222
1
| [ ]| | [ ]| | [ ]|
j
jj
nZ
f
tdnan
N
−∞ ∈
=+
∑∑∑ ∑
(3)
Parseval’s theorem relates the energy of the signal f (t) to the energy in each component and
the wavelet coefficients.
Then we use (3) as a comparison index for evaluation of the different mother wavelets that
can be used. Table 1 shows the value of the aforementioned index with different mother
wavelets when using the original signal and when using the envelope.
Wavelet Type
Index
(Signal)
Index
(Envelope)
Daubechies db9 3500.103468 251.8379024
Symelet sym8 3497.532913 250.7456702
Coiflet coif5 3502.697888 253.4763404
Biortogonal bior 3.1 498043.4396 2420.976428
Biortogonal bior 3.3 20573.9404 639.0276636
Table 1. The value of the aforementioned index with different mother wavelets
Advances in Vibration Analysis Research
336
Fig. 8. Wavelet decomposition
From Table 1, it is evident that the best index when evaluating the envelope is the one
obtained with the Biorthogonal Wavelet 3.1. Nevertheless, this mother wavelet is not square
integrable (E. Rivas, et al.,2009), so the Fourier fast transform cannot be performed since it
does not converge. Therefore, a pseudofrequency cannot be associated allowing us to relate
one scale in the Wavelet domain with one frequency in the Fourier domain.
Then Bior 3.3 mother wavelet was chosen since this wavelet presents the greatest correlation
index when compared to other mother wavelets and it allows characterizing the vibration
signal.
Wavelet decomposition at level 3 (Fig. 8) is applied to the envelope of the energy signal
(Fig. 7). Signal reconstruction from the coefficients of third level has a correlation of 94%
with the original signal.
D. Bursts detection
Once discrete Wavelet Transform is performed, bursts are detected (Fig. 10). A smooth
filtering based on threshold is used, to reduce noise and eliminate spurious bursts. To
distinguish residual noise in the signal from the true burst, the energy present in the bursts
are computed as the energy of residual noise is very low. The indicators used to evaluate the
suitability threshold were:
-
Preserved energy in the signal (Ep): Measures the proportion of energy preserved in the
envelope signal after thresholding.
[]
[]
2
1
2
1
[]
100%
[]
N
th
i
N
i
env i
Ep x
env i
=
=
=
∑
∑
(4)
Where env= envelope and env
th=
smoothed envelope.
Methodology for Vibration Signal Processing of an On-load Tap Changer
337
- Mean Square Noise (MSE): This indicator is proportional to the distortion in the filtered
signal, thus its value should be the lowest possible.
[]
2
1
1
[] []
N
th
i
M
SE env i env i
N
=
=−
∑
(5)
-
Signal Noise Ratio (SNR): This indicator measures the noise proportion referring to the
signal.
[]
[]
2
1
2
1
[]
()10log
[] []
N
i
N
th
i
env i
SNR db
env i env i
=
=
=
−
∑
∑
(6)
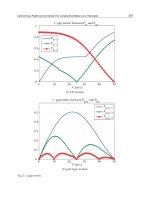
The criterion to choose the threshold value is based on capturing the greatest percentage of
energy with a low MSE and a suitable SNR. Fig. 9 shows Ep and MSE values as a function of
threshold value.
From this figure it is deduced that the appropriate threshold value is within the range from
0.8% to 1.3% of the envelope RMS value.
In our case a threshold of 1% was used. The average values (72 vibration records) of process
indicators were, Ep= 97.59%, MSE=1.28E-08 with SNR= 36. 55db. Fig. 9 shows the
reconstructed vibration signal after applying the threshold.
Fig. 9. Preserved energy versus threshold value (discontinuous line) and Mean Square Error
(dotted line) vs. threshold
Advances in Vibration Analysis Research
338
Fig. 10. Bursts detection
Methodology for Vibration Signal Processing of an On-load Tap Changer
339
Table 2. Vibration signals for the simulated failures
Advances in Vibration Analysis Research
340
Table 3. Statistical Study
6. Results
Table 2 shows the vibration signature for some of the simulated failures. The study was
carried out on 120 vibration signals, corresponding to 6 different conditions (Table 2) of the
OLTC (20 signals for each condition).
Some diagnostic indicators were extracted starting from the vibration signal (frequency
spectrum, wavelet coefficient comparison, etc). The best indicator to classify vibration
signals was time between vibration bursts. As vibration signals are not repetitive a statistical
study was carried out to prove the suitability of this indicator. Table 3 shows the results of
the statistical study. As it is deduced from Table 3, time between vibration bursts differs
Methodology for Vibration Signal Processing of an On-load Tap Changer
341
significantly when failures do exist and when failures are absent. In certain types of failures
some impulses (highlighted in grey in table 3) even disappear from the vibration signal.
7. Conclusion
It is of great importance to obtain indicators to assess the condition of high voltage
equipment. Vibration signal can be used to assess the condition of a transformer OLTC.
Main diagnostic indicators can be obtained by using Wavelet Transform to signal vibration.
The use of a mother wavelet with the highest correlation with the vibration signals allows
for a higher preservation of the original signal energy (and even with respect to the
smoothed signal). But this is not a guarantee for smoothing the obtained signal or spurious
burst elimination.
In order to automatically obtain the bursts in the vibration envelope it is necessary to obtain
wavelet coefficients of the signal. The proper election of those coefficients depends on the
required information and the mother wavelet used and is obtained as a trade-off between
the correlation of the envelope of the energy signal and the reconstructed signal.
After analyzing the ability of different diagnostic indicators (number of bursts, vibration
burst amplitudes, burst energy, time between vibration bursts, frequency band of bursts) to
properly classify different kind of OLTC failures, time between vibration bursts (and
eventually burst appearance or disappearance) are proven the most suitable indicators.
8. Acknowledgments
This study has been funded by the Spanish Science and Technology Ministry (MCYT) under
project no. DPI2009-07093.
9. References
L.A.L. de Almeida, M. Fontana, F.A. Wegelin, and L. Ferreira “A New Approach for
Condition Assessment of On-Load Tap-Changers Discrete Wavelet Transform”,
Instrumentation and Measurement Technology Conference, 2005. Proceedings of
the IEEE. Volume 1, 16-19 May 2005, pp. 653 - 656.
Simas, E.F., de Almeida, L.A.L., de Lima, A.C., “Vibration Monitoring of On-Load Tap
Changers Using a Genetic Algorithm” Instrumentation and Measurement
Technology Conference, 2005. Proceedings of the IEEE. Volume 3, 16-19, May 2005,
pp. 2288 - 2293.
M. Foata, R. Beauchemin, and C. Rajotte, “On-line testing of on-load tap changers with a
portable acoustic system,” IEEE 9th International Conference on Transmission and
Distribution Construction, Operation and Live-Line Maintenance Proceedings, pp.
293 – 298, Oct. 2001.
R. Jongen, P. Morshuis et al. “A statistical approach to processing power transformer failure
data” 19
th
Int Conf on Electricity Distribution CIRED 2007 paper 546. Vienna May
2007.
a. P. Kang, D. Birtwhistle, J. Daly, and D. McCulloch, “Non-invasive on-line condition
monitoring of on-load tap changers,” in Proceedings of IEEE Power Engineering
Society Winter Meeting, Singapore, 2000.
Advances in Vibration Analysis Research
342
b. P. Kang and D. Birtwhistle “Analysis Of Vibration Signals For Condition Monitoring Of
Power Switching Equipment Using Wavelet Transform” (Proc of the IEEE-SP
International Symposium on Time Frequency and time scale analysis 1998, Oct
1998, pp. 6-9)
S. Mallat, A Wavelet Tour of Signal processing. Academic Press, 1988.
E. Rivas, J. C. Burgos and J. C. Garcia-Prada. (2009, Condition assessment of power OLTC by
vibration analysis using wavelet transform. IEEE Transactions on Power Delivery
Vol 24 No 2, pp. 687-694. Abril 2009.
A. I. Zayed., Hilbert transform associated with the fractional fourier transform. Signal
Processing Letters, IEEE 5(8), pp. 206-208. 1998.
18
Analysis of Microparts Dynamics Fed
Along on an Asymmetric Fabricated Surface
with Horizontal and Symmetric Vibrations
Atsushi Mitani
1
and Shinichi Hirai
2
1
Department of Design, Sapporo City University
2
Department of Robotics, Ritsumeikan University
Japan
1. Introduction
Devices to feed along microparts, such as ceramic chip capacitors and resistors, have
become more common, due to their use in sorting, inspecting, and shipping mass produced
microparts. In microparts feeding, to feed along microparts in one direction, the driving
force applied to each micropart must vary according to the direction of motion of the
micropart. Especially, the motion of microparts smaller than submillimeter can be affected
by not only inertia but also adhesion which is caused by electrostatic, van der Waal's,
intermolecular forces, and surface tension.
Now we have developed a novel microparts feeder applied an asymmetric fabricated
surface, for example, sawtoothed surface, as a feeder table (Figure 1) (Mitani, 2006). The
asymmetric fabricated surface can feed along microparts in one direction using horizontal
and symmetric vibrations because contact between a micropart and the asymmetric
fabricated surface varies according to the direction of motion. In order to formulate the
dynamics of micropart, we need to analyse driving force and adhesion according to these
contacts.
In this chapter, we developed micropart dynamics considering the effect of contact.
Sawtoothed silicon wafers with various pitch were applied for feeder table, and also 0603
(size, 0.6 x 0.3 x 0.3 mm: weight, 0.3 mg) capacitors were applied for microparts.
First, we analysed contact between a micropart and a sawtoothed surface. Each surface
profile model was approximated by a linear polynomial based on measurements using a
microscopy system.
Secondly, we derived dynamics including the effect of adhesion. We analysed contact
between both approximated models, because both inertia caused by feeder vibrations and
adhesion vary according to contact. Supposing that adhesion occurs in the direction vertical
to the tangent and also adhesion acts when the distance between two surface models is
smaller than an adhesion limit, we obtained an adhesion model. Then the adhesion model
parameters were identified using the results of friction angle measurement experiments of
microparts.
Finally, we assessed the dynamics derived above. We firstly conducted feeding experiments
of microparts using various pitch of sawtoothed surface with the same driving and