Desalination Trends and Technologies Part 9 doc
Bạn đang xem bản rút gọn của tài liệu. Xem và tải ngay bản đầy đủ của tài liệu tại đây (1.15 MB, 25 trang )
New Trend in the Development of ME-TVC Desalination System
189
increase the feed seawater temperature and consequently decrease the energy added for
evaporation.
T
f1
T
f2
T
fj
D
s
D
r
+D
s
P
d
P
j
D
r
F
1
F
2
F
j
D
1
T
v1
T
v2
T
vj
T
1
T
2
T
j
D
j-1
D
j
P
s
B
1
B
j
B
2
2D
f
B
n
D
n
T
n
T
vn
T
j+2
T
vj+2
T
vj +1
D
s
D
r
F
T
f
M
c
T
c
B
j+1
B
j+2
T
f
T
fj+2
T
fj+1
D
M
c
-F
T
f1
T
f2
T
fj
D
s
D
r
+D
s
P
d
P
j
D
r
F
1
F
2
F
j
D
1
T
v1
T
v2
T
vj
T
1
T
2
T
j
D
j
B
1
B
j
B
2
D
s
D
r
ME-TVC 1
ME-TVC 2
MED
D
j-1
D
j+2
D
j+1
D
r
y
D
r
y
T
j+1
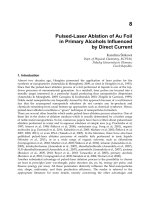
Fig. 2. A schematic diagram of two ME-TVC units combined with a conventional MED unit.
4. Thermal analysis of ME-TVC desalination system
First and Second Laws analysis are used in this section to develop a mathematical model of
the ME-TVC desalination system. The model is developed by applying mass and energy
conservation laws to the thermo-compressor, evaporators, feed heaters and end condenser.
The following assumption were used to simplify the analysis: steady state operation,
negligible heat losses to the surrounding, equal temperature difference across feed heaters,
salt free distillate from all effects and variations of specific heat as well as boiling point
elevation with the temperature and salinity are negligible.
The brine temperature in each effect is less than that of the previous one by ∆T. So, if the
brine temperature in the effect i is assumed to be T
i
, then the brine temperature in the next
effect i+1 and so on up to the last effect n and can be calculated as follow:
1
,1,2,
ii
TTT i n
+
=
−Δ = (1)
Desalination, Trends and Technologies
190
The temperature of the vapor generated in the effect i, T
vi
is lower than the brine
temperature by the boiling point elevation plus non equilibrium allowance, where T
vi
is a
saturation temperature corresponding to the pressure in the effect P
i
.
(),1,2,
ii
T T BPE NEA i n
ν
=− + = … (2)
The temperature difference between the effects is assumed to be the same in this analysis
and can be calculated as follows:
1
1
n
TT
T
n
−
Δ=
−
(3)
The feed seawater temperature flowing into each effect (T
fi
) can be calculated as follows:
[ ( 1)] 1,2,3
fi f
TT ni T i n
=
+−+ ⋅Δ = (4)
4.1 Mass and Energy Balance
The feed seawater flow rate F is distributed equally to all effects at a rate equal to F
i
which
can be calculated as follows:
,
2
i
Fn
Fj
nj
==
+
(5)
The brine leaving the first effect enters into the second effect and so on up to the last effect n,
and the brine from the last effect is rejected. The brine leaving the first, second and last effect
can be calculated considering mass balance law as follows:
ii i
BFD
=
− (6)
()
111
1
j
iii
i
BFD
+++
=
=−
∑
(7)
()
()
11
11
2
j
n
niijj
ij
BFDFD
++
=+
=⋅ − + −
∑∑
(8)
The salt mass conservation law is applied, assuming that the distillate is free of salt, to find
brine salinity from the first, second and last effect as follows:
()
i
f
bi
ii
FX
X
FD
⋅
=
−
(9)
()
1
1
11
1
if
bi
j
ii
i
FX
X
FD
+
+
++
=
⋅
=
−
∑
(10)
New Trend in the Development of ME-TVC Desalination System
191
()
()
11
11
2
nf
bn
j
n
ii j j
ij
FX
X
FD F D
++
=+
⋅
=
⋅−+ −
∑∑
(11)
The vapor generated in the first effect by boiling only and can be determined from the
energy balance of the first effect as follows:
()
(
)
11
11
11
sr dfd
f
DD h h
TT
DFC
LL
⎡⎤
+⋅−
−
⎛⎞
⎣⎦
=−⋅⋅
⎜⎟
⎜⎟
⎝⎠
(12)
The amount of vapor released from the second up to j can be expressed respectively as follows:
()
(
)
22
1
21 1 1 2
22 2
f
r
TT
LCT
DDDyFy B FC
LL L
−
⋅Δ
=+⋅−⋅⋅+⋅ −⋅⋅
(13)
(
)
2
1
11
1
[( ( ) ( 1) )]
j
jfj
j
jj ir j j j
jj j
i
TT
L
CT
DD DDyj Fy B FC
LL L
−
−
−−
=
−
⋅Δ
=++⋅−−⋅⋅⋅+⋅−⋅⋅
∑
(14)
The vapor formed in the last effect of each ME-TVC unit D
j
is divided into two streams; one
is entrained by the thermo-compressor (D
r
) and the other is directed to the MED unit.
j
r
f
DDD
=
+ (15)
The two streams of
D
f
are used as a heat source to operate low temperature multi effect
distillation unit (LT-MED).
So, the vapor formed in first, second and last effect of this unit can be calculated as follows:
(
)
11
11
11 1
22
jfj
j
jf j j
jj j
TT
L
CT
DD B FC
LL L
++
++
++ +
−
⋅Δ
=⋅ ⋅ +⋅ ⋅ − ⋅⋅
(16)
(
)
22
1
21 2 1 2
22 2
1
()() 2
j
jfj
j
jj ir j j j
jj j
i
TT
L
CT
DD DDyjnFy B FC
LL L
++
+
++ + + +
++ +
=
−
⎛⎞
⋅Δ
=++⋅−+⋅⋅⋅+⋅⋅ −⋅⋅
⎜⎟
⎜⎟
⎝⎠
∑
(17)
(
)
2
1
11
1
[( ( ) ( 1) )] 2
n
n
f
n
nn ir i n i
nnn
i
TT
L
CT
DD DDyjn Fy B FC
LLL
−
−
−−
=
−
⋅Δ
= + + ⋅−+−⋅⋅ ⋅ +⋅ ⋅ −⋅⋅
∑
(18)
The total distillate output from all effects is equal to
1
11
2 , 1,2, 3
j
n
ij
ij
DDDi
+
=+
=⋅ + =
∑∑
(19)
The energy balance of the thermo-compressor is used to calculate the enthalpy of the
discharged steam as shown in equation (20),
Desalination, Trends and Technologies
192
()
1
s
s
gj
r
d
s
r
D
hh
D
h
D
D
⎛⎞
⎛⎞
⋅+
⎜⎟
⎜⎟
⎜⎟
⎝⎠
=
⎜⎟
⎛⎞
⎜⎟
+
⎜⎟
⎜⎟
⎝⎠
⎝⎠
(20)
The most essential part in modeling the ME-TVC desalination system is to determine the
ratio of motive steam to entrained vapor (
D
s
/D
r
) in such thermo-compressors. An optimal
ratio will improve the unit efficiency by reducing the amount of motive steam (Utomo et al.,
2008). This ratio is a direct function of discharge pressure (
P
d
), motive steam pressure (P
s
)
and entrained vapor pressure (
P
j
) in terms of compression ratio (CR) and expansion ratio
(
ER) as follows (El-Dessouky & Ettouney, 2002; Al-Najem et al., 1997):
d
j
P
CR
P
=
(21)
s
j
P
ER
P
=
(22)
Several methods are available in the literature to evaluate entrainment ratios; most of these
methods need lengthy computation procedures and use many correction factors
(El-Dessouky & Ettouney, 2002). Two simple methods are used to evaluate this ratio in this
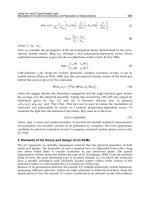
chapter: (1) Power’s graphical data method (Al-Najem et al., 1997), (2) El-Dessouky and
Ettouney’s semi–empirical model (El-Dessouky & Ettouney, 2002). Although Power’s
method is a straightforward and the entrainment ratio can be extracted directly from Fig. 3
Ds/Dr=kg motive steam
per kg load
1.6 1.7 1.8 1.9 2 2.2 2.6 3 4 5 6 8
10
15 20 30 50
10
2
5
10
4
5
10
3
6
1.05
1.06
1.07
1.08
1.09
1.10
1.12
1.14
1.16
1.20
1.4
1.3
1.5
1.6
1.7
1.8
2.0
2.2
2.4
2.6
3.0
3.5
4.0
5.0
6
7
8
10
20
15
12
2
0.3
0.25
0.4
0.5
0.6
1.2
0.8
1.0
1.5
2345
Ex
p
ansion ratio
(
motive
p
ressure/suction
p
ressure
)
Compression ratio (discharge pressure/suction pressure)
Fig. 3. Entrainment ratio for different compression and expansion ratios (Power, 1994)
New Trend in the Development of ME-TVC Desalination System
193
in terms of compression ratio and expansion ratio, it is too difficult to use in such
optimization and simulation models. The developed semi–empirical model in method 2 is
applicable only if the motive fluid is steam and the entrained fluid is water vapor
(Al-Juwayhel et al., 1997). The pressure and temperature correction factors were eliminated
for simplicity and the model equation is modified as shown in equation (23); results were
tested and compared with that obtained by Power’s graphical method for validity in the
following range of motive pressure 3000 ≥
P
s
≥ 2000 (kPa).
()
()
()
1.19
0.015
1.04
0.235
d
s
r
j
P
D
ER
D
P
⎛⎞
=
⎜⎟
⎜⎟
⎝⎠
(23)
4.2 Exergy balance
An exergy balance is also conducted to the system to find the exergy destruction (I) in each
component; in thermo-compressor, effects, condenser and the leaving streams in kJ/kg
according to the following equation:
in out
IT SE E
ο
=
⋅Δ = − (24)
Where Δ
S is the entropy increase, E
in
is the input exergy and E
out
is the output exergy.
4.2.1 Thermo-compressor
The exergy destruction in the thermo-compressor can be expressed as follows:
()()
(
)
(
)
ej s s d o s d r d gj o d gj
I D hh TSS D h h TS S
⎡
⎤
⎡⎤
=⋅ − −⋅− −⋅ − −⋅ −
⎣⎦
⎣
⎦
(25)
4.2.2 Effects
The exergy destruction in the first, second and last effect can be expressed respectively as
follows;
()
()() ()
1
111111
11
1
o
e s r d fd o d fd f o
vf
T
T
IDDhhTSS DL FCTTTIn
TT
⎡
⎤
⎛⎞
⎛⎞
⎡⎤
⎢
⎥
⎜⎟
=+⋅ −−⋅− −⋅⋅− −⋅⋅ − −⋅
⎜⎟
⎜⎟
⎣⎦
⎜⎟
⎢
⎥
⎝⎠
⎝⎠
⎣
⎦
(26)
()
()
1
21 21 1 22
122
2
222
2
11
oo
er o
fo
f
TT
T
IDDyFyL BCTTIn DL
TTT
T
FC T T TIn
T
⎡⎤
⎛⎞ ⎛⎞ ⎛⎞
= + − ⋅⋅− +⋅⋅Δ−⋅ − ⋅⋅−
⎢⎥
⎜⎟ ⎜⎟ ⎜⎟
⎜⎟ ⎜⎟ ⎜⎟
⎢⎥
⎝⎠ ⎝⎠ ⎝⎠
⎣⎦
⎡⎤
⎛⎞
⎢⎥
⎜⎟
−⋅⋅ − −⋅
⎜⎟
⎢⎥
⎝⎠
⎣
⎦
(27)
()
()
()
2
1
111
1
1
112
1ln
n
on
en n i r i n n o
nn
i
on
nn i n f o
nf
TT
ID DDyjnFyL BCTTIn
TT
TT
DL FC T T T
TT
−
−
−−−
−
=
⎡
⎤
⎡⎤
⎛⎞ ⎛⎞
=+ +⋅−+−⋅⋅⋅−+⋅⋅⋅Δ−⋅
⎢
⎥
⎜⎟ ⎜⎟
⎢⎥
⎜⎟ ⎜⎟
⎢
⎥
⎝⎠ ⎝⎠
⎣⎦
⎣
⎦
⎡⎤
⎛⎞
⎛⎞
⎢⎥
⎜⎟
−⋅⋅− −⋅⋅ − −⋅
⎜⎟
⎜⎟
⎜⎟
⎢⎥
⎝⎠
⎝⎠
⎣⎦
∑
(28)
Desalination, Trends and Technologies
194
4.2.3 Condenser and leaving streams
The exergy destruction in the condenser, and in the leaving streams, D
r
,D
f
and B
n
can be
expressed using the following equations respectively:
()
1ln
f
o
cnn c fc o
nc
T
T
IDL MCTT T
TT
⎡
⎤
⎛⎞
⎛⎞
=⋅⋅− − ⋅⋅ −−⋅
⎢
⎥
⎜⎟
⎜⎟
⎜⎟
⎜⎟
⎢
⎥
⎝⎠
⎝⎠
⎣
⎦
(29)
()
ln
vj
Dr r vj c o
c
T
IDCTTT
T
⎡
⎤
⎛⎞
=⋅⋅ −−⋅
⎢
⎥
⎜⎟
⎜⎟
⎢
⎥
⎝⎠
⎣
⎦
(30)
()
ln
vj
Df f vj c o
c
T
IDCTTT
T
⎡
⎤
⎛⎞
=⋅⋅ −−⋅
⎢
⎥
⎜⎟
⎜⎟
⎢
⎥
⎝⎠
⎣
⎦
(31)
()
ln
n
Bn n n c o
c
T
IDCTTT
T
⎡
⎤
⎛⎞
=⋅⋅ −−⋅
⎢
⎥
⎜⎟
⎜⎟
⎢
⎥
⎝⎠
⎣
⎦
(32)
4.3 Thermal load
The heat transfer area of an effect can be obtained from the latent heat of condensation
(thermal load) of each effect as shown in equation (33), where ∆T
e
is the temperature
difference across the heat transfer surface.
ee e
QUA T
=
⋅⋅Δ (33)
Therefore, the heat transfer area for the first, second and last effect can be obtained as
follows:
()
()
1
11
sr d
f
d
e
ed
DD h h
A
UTT
⎡
⎤
+⋅−
⎣
⎦
=
⋅−
(34)
()
111
2
212
()
r
e
ev
DD
y
F
y
L
A
UTT
+
⋅− ⋅ ⋅
=
⋅−
(35)
()
2
11
1
1
[( ( ) ( 1) ]
n
nir in
i
n
en vn n
DDDyjnFyL
A
UT T
−
−
−
=
−
++⋅−+−⋅⋅⋅
=
⋅−
∑
(36)
The overall heat transfer coefficient (U
e
) depends mainly on the type, design and material of
the tubes (El-Dessoukey et al., 2000), and for simplicity it can be calculated as follows
(El-Dessouky & Ettouney, 2002):
() ()
(
)
23
1939.4 1.40562 0.0207525 0.0023186
1000
ii i
ei
TT T
U
+⋅− ⋅+ ⋅
=
(37)
New Trend in the Development of ME-TVC Desalination System
195
The cooling seawater flow rate can be obtained by applying the energy conservation law on
the condenser as shown below:
()
fn
c
f
c
DL
M
CT T
⋅
=
⋅−
(38)
The latent heat of condensation of the un-entrained vapor
D
f
flowing to the condenser is
used to increase cooling seawater temperature to feed seawater temperature. The thermal
load of the condenser is used to calculate the condenser heat transfer area as follows:
()
fn
c
c
c
DL
A
ULMTD
⋅
=
⋅
(39)
The logarithmic mean temperature difference and the overall heat transfer coefficient of the
condenser can be obtained from equations (40) and (41) respectively (El-Dessouky &
Ettouney, 2002).
()
(
)
()
()
()
ln
vn
f
vn c
c
vn f
vn c
TT TT
LMTD
TT
TT
−− −
=
−
−
(40)
() ()
23
25 7
1.7194 3.2063 10 1.5971 10 1.9918 10
cvnvnvn
UTTT
−− −
=+⋅⋅−⋅⋅+⋅⋅
(41)
Similarly, the heat transfer area of the feed heaters can be expressed as follow assuming that
the overall heat transfer coefficient of the feed heaters are equals to that of the condenser.
(
)
1
1
()
ln , 1, 2, 2
()()
if vifi
fi
ffifi vifi
iF C T T T
Ain
UTT TT
+
+
⋅⋅Δ −
=
⋅=−
⋅− −
(42)
4.4 System performance
The system performance of the ME-TVC model can be evaluated in terms of the following:
4.4.1 Gain output ratio, GOR
The gain output ratio is one of the most commonly performance used to evaluate
thermal desalination processes. It is defined as the ratio of total distilled water produced (D)
to the motive steam supplied (D
s
).
s
D
GOR
D
=
(43)
4.4.2 Specific heat consumption, Q
d
This is one of the most important characteristics of thermal desalination systems. It is
defined as the thermal energy consumed by the system to produce 1 kg of distilled water,
where L
s
is the motive steam latent heat in kJ/kg
Desalination, Trends and Technologies
196
ss
d
DL
Q
D
⋅
= (44)
4.4.3 Specific exergy consumption, A
d
The specific exergy consumption is one of the best methods used to evaluate the
performance of the ME-TVC based on the Second Law of thermodynamics. It considers the
quantity as well as the quality of the supplied motive steam. It is defined as the exergy
consumed by the motive steam to produce 1 kg of distillate when the steam is supplied as
saturated vapor and leaves as saturated liquid at ambient temperature equal to
T
o
, according
to the following equation (Darwish et al., 2006):
()()
s
d s fd o s fd
D
AhhTSS
D
⎡
⎤
=⋅ − −⋅−
⎣
⎦
(45)
where h
s
, S
s
are the inlet motive steam enthalpy and entropy at saturated vapor and h
fd
, S
fd
are that of the outlet condensate at saturated liquid.
4.4.4 Specific heat transfer area, A
t
The specific total heat transfer area is equal to the sum of the effect, feed heaters and the
condenser heat transfer areas per total distillate product (m
2
/kg/s).
2
111
2
j
nn
fi
deiei c
ii i
iji
A
At A A A
DDDDD
−
=+=
=⋅ + + +
∑∑∑
(46)
4.4.5 Specific exergy destruction, I
t
This term shows the total exergy destruction due to heat transfer and in the thermo-
compressor, evaporators, condenser and the leaving streams per unit of distillate water.
i
t
I
I
D
=
∑
(47)
where I
i
is the exergy destruction in each component in kJ/kg.
4.5 Model validity
Engineering Equation Solver (EES) software is used to evaluate the ME-TVC system
performance. The validity of the model was tested against some available data of three
commercial units having different unit capacities: ALBA in Bahrain (2.4 MIGD), Umm Al-
Nar in UAE (3.5 MIGD) and Al-Jubail in KSA (6.5 MIGD). The results showed good
agreements as shown in Table 2.
It is also cleared from Table 2 that the available data of Al-Jubail unit is limited in the
literature. Hence, the developed mathematical model is used to predict the missing values in
order to evaluate the system performance of this plant.
New Trend in the Development of ME-TVC Desalination System
197
Desalination Plant ALBA UMM Al-NAR AL-JUBAIL
Number of effects, n 4 6 8
Operating and Design Parameters
ModelActualModelActualModel Actual
Motive pressure, bar 21 21 2.8 2.8 2.7 2.7
Top brine temperature,
o
C 63 63 63 62 63 NA
Minimum brine temperature,
o
C 48 48 44 43 42 NA
Feed sea water temperature,
o
C 43 43 40 40 40 NA
Motive steam flow rate, kg/s 8.5 × 2 8.3 × 2 11×2 10.65×2 15.5×2 NA
Temperature drop per effect,
o
C 5 5 3.8 3.8 3 NA
Thermo-compressor Design
Compression ratio 1.57 NA 1.7 NA 1.75 NA
Expansion ratio 120 NA 18.11 NA 18.7 NA
Motive to entrained vapor ratio 0.58 NA 0.885 NA 0.98 NA
System Performance
Distillate production, kg/s 123 127 184.2 184.38 340.4 342.22
Gain output ratio 7.23 7.5 8.37 8.6 10.9 9.8
Specific heat consumption, kJ/kg 348.4 NA 292.1 287.5 223 NA
Specific exergy consumption,
kJ/kg
127.7
NA 74.6 NA 56.44 NA
Specific heat transfer area,
m
2
/kg/s
244.2 NA 335.6 310 452.2 NA
Specific exergy destruction,
kJ/kg/s
94.65 NA 54.24 NA 41.16 NA
Table 2. Mathematical model calculations against some commercial plants.
5. Sensitivity analysis
The new trend of combining ME-TVC desalination system with a conventional Multi effect
distillation (MED) unit has been used lately in different large projects and has been also
discussed in a few published works (Al-Habshi, 2002), (Darwish & Alsairafi, 2004) and (Bin
Amer, 2009). Thus, a sensitivity analysis will be presented in this section to investigate the
system performance variations of Al-Jubail ME-TVC unit. This project belongs to Marafiq
Company and it is currently considered as the largest ME-TVC desalination plants in the
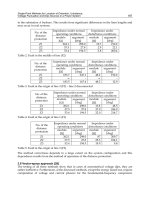
world, it consists of 27 units each of 6.5 MIGD as shown in Fig.4.
The available data of this unit in the literature are: the gain output ratio, number of effect,
motive pressure and the unit capacity. These data are used along with the model equations
to evaluate the system performance of the plant.
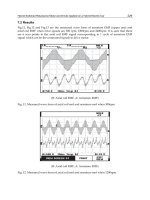
Fig.5. shows the effect of motive steam flow rate on the vapor formed in each effect of this
unit, at
T
1
= 63
o
C and ΔT=3
o
C. The total distillate production can be controlled by adjusting
the motive steam flow rate. The reason is when the motive steam flow rate increases the
entrained vapor also increases for constant entrainment ratio (
D
s
/D
r
), this will lead to
generate more vapor and consequently more distillate water.
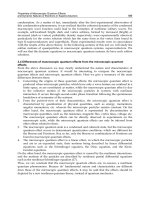
The variation of the gain output ratio and the distillate production as a function of top brine
temperature is shown in Fig.6. It is cleared that as the top brine temperature increases the
distillate output production decreases and consequently gain output ratio decreases. This is
Desalination, Trends and Technologies
198
Distillate water
Vapor
Seawater
Brine
T
1
= 63 T
2
= 60 T
3
= 57 T
4
= 54
T
5
= 51
T
6
= 48
T
7
= 45
T
8
= 4 2
D
1
= 30.94
D
2
= 30.05
D
3
= 29.17 D
4
= 2 8 .3
D
5
= 26.76 D
6
= 25.96 D
7
= 25.47
D
8
= 25.29
D
s
=15.5
P
s
= 27 0 [k pa]
D
r
= 15.73 [kg/s]
M
c
= 1581 [kg/s]
T
f1
= 58 [C ]
D
f
= 12.56 [kg/s]
D = 34 0. 4 [k g/s ]
B
8
= 458.9
F = 1021 [kg/s]
T
f2
= 55 [C]
T
f3
= 52 [C]
n = 8
MI GD = 6 .46 5
GR = 10.98
Q
d
= 222.9 [kJ/kg]
A
d
=56.44 [kJ/kg]
I
t
=41.16[kJ/kg/s]
A
t
=452.2
T
1
= 63
T
2
= 60
T
3
= 57
T
4
= 54
D
1
= 3 0 .9 4
D
2
= 30.05
D
3
= 29.17 D
4
= 28.3
D
r
= 15.73 [kg/s]
D
s
=15.5
P
s
= 27 0 [ kpa ]
B
4
= 22 1.9
Fig. 4. Schematic diagram similar to Al-Jubail (MARAFIQ) ME-TVC unit, 6.5 MIGD.
New Trend in the Development of ME-TVC Desalination System
199
Motive steam, kg/s
7 8 9 10 11 12 13 14 15 16 17 18
D
i
kg/s
10
15
20
25
30
35
D
1
D
2
D
3
D
4
D
5
D
6
D
7
D
8
98.0
63
3
1
=
=
=Δ
r
s
o
o
D
D
CT
CT
Fig. 5. The effect of motive steam on the distillate production from the effects.
Top brine temperature,
o
C
60 62 64 66 68 70 72
Gain output ratio, GOR
8.5
9.0
9.5
10.0
10.5
11.0
11.5
Distillate production, MIGD
5.2
5.4
5.6
5.8
6.0
6.2
6.4
6.6
6.8
7.0
GOR
MIGD
Fig. 6. The effect of top brine temperature on the distillate production and gain output ratio.
because more amount of sensible heating is required to increase the feed seawater
temperature to higher boiling temperatures. Additionally, the latent heat of the vapor
decreases at higher temperatures.
The direct dependence of the top brine temperature on the specific heat consumption and
the specific exergy consumption are shown in Fig. 7. Both of them increase linearly as the
top brine temperature increases, because higher top brine temperature leads to higher vapor
pressure and consequently larger amount of motive steam is needed to compress the vapor
at higher pressures. Fig.8. demonstrates the variations of the specific heat transfer area as a
function of temperature difference per effect at different top brine temperatures. The
increase in the specific heat transfer area is more pronounced at lower temperature
difference per effect than at lower top brine temperatures. So, a high overall heat transfer
coefficient is needed to give a small temperature difference at reasonable heat transfer area.
Desalination, Trends and Technologies
200
Top brine temperature,
o
C
60 62 64 66 68 70 72
Specific heat consumption, Q
d
kJ/kg
200
220
240
260
280
Specific exergy consumption, A
d
kJ/kg
50
55
60
65
70
Q
d
A
d
Fig. 7. The effect of top brine temperature on the specific heat consumption and specific
exergy consumption.
Temperature drop per effect,
o
C
2.0 2.2 2.4 2.6 2.8 3.0
Specific heat transfer area, m
2
/kg/s
400
500
600
700
800
900
T
1
= 65
o
C
T
1
= 63
o
C
T
1
= 61
o
C
Fig. 8. The effect of temperature drop per effect on the specific heat transfer area.
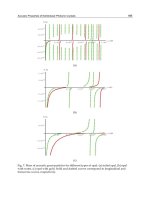
The exergy analysis is also used to identify the impact of the top brine temperature on the
specific exergy destruction for different ME-TVC units as shown in Fig.9. It shows that as
the top brine temperature increases, the specific exergy destruction of ALBA, Umm Al-Nar
and Al-Jubail plants are increased. It shows also that Al-jubail unit has the lowest values
compared to other units. Fig.10 gives detail values of exergy destruction in different
components of Al-Jubail units, while Fig.11 pinpoints that thermo-compressor and the
effects are the main sources of exergy destruction. On the other hand, the first effect of this
unit was found to be responsible for about 31% of the total effects exergy destruction
compared to 46% in ALBA and 36% in Umm Al-Nar as shown in Fig.12.
New Trend in the Development of ME-TVC Desalination System
201
Top brine temperature,
o
C
60 62 64 66 68 70 72
Specific exergy destruction, kJ/kg
20
40
60
80
100
120
ALBA, 4 effects
Umm Al-Nar, 6 effects
Al-Jubail, 8 effects
Fig. 9. The effect of top brine temperature on the specific exergy destruction for different units.
Top brine temperature,
o
C
60 62 64 66 68 70 72
Specific exergy destruction, kJ/kg
0
5
10
15
20
25
30
35
Effects
Thermo-compressor
Condenser
Leaving streams
Fig. 10. The effect of top brine temperature on the specific exergy destruction in different
components of Al-Jubail ME-TVC unit.
Fig. 11. The exergy destruction in the effects, thermo-compressor, condenser and leaving
streams of Al-Jubail unit.
Desalination, Trends and Technologies
202
Fig. 12. The exergy destruction in the effects of ALBA, Umm Al-Nar and Al-Jubail units.
6. Development of ME-TVC desalination system.
The first ME-TVC desalination unit of 1 MIGD capacity was commissioned in 1991 in the
UAE. It has four effects with a gain output ratio close to 8. A boiler was used to supply
steam at high motive pressure of 25 bars (Michels, 1993). The next unit capacity was 2 MIGD
which started up in 1995 in Sicily (Italy). It consisted of four identical units; each had 12
effects, with a gain output ratio of 16. The steam was supplied from two boilers at 45 bars to
the plant (Temstet, 1996). More units of 1, 1.5 and 2 MIGD were also ordered and
commissioned in UAE between 1996 –1999 due to excellent performance of the previous
projects (Sommariva, 2001).
New Trend in the Development of ME-TVC Desalination System
203
The trend of combining ME-TVC desalination system with multi-effect distillation (MED)
allowed the unit capacity to increase into a considerable size with less number of effects and
at low top brine temperature.
The first desalination project of this type was commissioned in 1999 by SIDEM Company in
Aluminum of Bahrain (ALBA). A heat recovery boiler is used to supply high motive steam
of 21 bars into four identical units of 2.4 MIGD. Each unit had four effects with a gain output
ratio close to 8 (Darwish & Alsairafi, 2004). The next range in size was achieved is 3.5 MIGD
in 2000. Two units of this size were installed in Umm Nar; each unit had six effects with a
gain output ratio close to 8. The steam was extracted from a steam turbine at 2.8 bars to
supply two thermo-compressors in each unit (Al-Habshi, 2002). This project is followed by
Al-Taweelah A
1
plant, which was commissioned in 2002 as the largest ME-TVC project in
the world at that time. It consists of 14 units; each of 3.8 MIGD. The next unit size that
commissioned was in Layyah with a nominal capacity of 5 MIGD (Michels, 2001). The unit
size jump to 8 MIGD in 2005 where two units were built in UAE. SIDEM has been also
selected to build the largest hybrid plant to date in Fujairah (UAE) which has used two
desalination technologies (ME-TVC and SWRO) to produce 130 MIGD as shown in Table 3.
Plant Details ALBA Umm Al-NAR Al-JUBAIL Al-Fujairah
Country
Bahrain UAE KSA UAE
Year of commission
1999 2000 2007 2008
Source of
steam/Arrangement
Boiler CG-ST/HRSG CG-ST/HRSG CG-ST/HRSG
Type of fuel
Diesel oil Natural gas Natural gas Natural gas
Power Capacity, MW
- 1700 2700 2000
Desalination technology
ME-TVC ME-TVC ME-TVC ME-TVC/RO
Unit capacity, MIGD
2.4 3.5 6.5 8.5/RO
Number of units
4 2 27 12/RO
Total capacity, MIGD
9.6 7 176 100+30
Number of effects
4 6 8 10
Water cost, US $/m
3
NA NA 0.827 0.60
Table 3. Specifications of different ME-TVC desalination units.
6.1 New large projects
This technology is starting to gain more market shares now, in most of the GCC countries
for large-scale desalination projects like in Bahrain, Saudi Arabia, and Qatar.
6.1.1 Al-Hidd.
Al-Hidd power and water plant located in northern of Bahrain, consists of three gas fired
combined cycle units that produces around 1000 MW. A low motive steam pressure of 2.7
bars is used to feed 10 ME-TVC units, each of 6 MIGD and 9 gain output ratio.
6.1.2 Al-Jubail.
The Independent Water and Power Project (IWPP) MARAFIQ became one of the largest
integrated power and desalination plant projects in the world under a BOOT scheme. The
Desalination, Trends and Technologies
204
project located near Al-Jubail City, north east of Kingdom of Saudi Arabia. It consists of a
combined cycle power plant produces 2750 MW along with the world's largest ME-TVC
desalination plants of 176 MIGD capacity (27 units × 6.5 MIGD). The units are driven by low
motive steam pressure of 2.7 bars. Each unit consisting of 8 effects with gain output ratio
around 10.
6.1.3 Ras Laffan.
Ras Laffan is the largest power and water plant in Qatar so far. It will provide the city with
2730 MW electricity and 63 MIGD desalinated water. The power plant consists of eight gas
turbines each in conjunction with heat recovery steam generator (HRSG). The high pressure
steam enters four condensing steam turbines. A heating steam of 3.2 bars is used to operate
10 ME-TVC units, each of 6.3 MIGD and gain output ratio of 11.1.
6.2 New design and material selection.
Most of the construction materials used in ALBA and Umm Al-Nar desalination plants are
almost the same as shown in Table 4. Stainless steel 316L was used for evaporator,
condenser and pre-heaters shells, tube-plates, water boxes, spray nozzles and thermo-
compressor. Aluminum brass was selected for the tube bundles of the evaporator, except the
top rows which
were made of titanium in order to prevent erosion corrosion, as water is
sprayed from nozzles with high velocities at the upper tubes of the tube bundles
(Wangnick, 2004).
Plant ALBA Umm Al-Nar New projects
Evaporator vessel
- Shell in contact with seawater
-
Shell in contact with vapor
-
Vapor and distillate boxes
Cylindrical
SS 316L
SS 316L
SS 316L
Cylindrical
SS 316L
SS 316L
SS 316L
Rectangular
Duplex SS
Duplex SS
Duplex SS
Heat tube bundles
- Tubes (top rows)
-
Tubes (other rows)
-
Tube-plates
Titanium
Aluminum
brass
SS 316L
Titanium
Aluminum
brass
SS 316L
Titanium
Aluminum
brass
SS 316L
Demisters
SS 316 SS 316-03 polypropylene
Spray nozzles
SS 316L SS 316L SS 316L
Condenser & Pre-heaters
- Shell & tube-plates
- Tubes
- Water boxes
SS 316L
Titanium
SS 316L
SS 316L
Titanium
SS 316L
Duplex SS
Titanium
SS 316L
Thermo-compressor
NA SS 316L Duplex SS
Table 4. Construction materials of the ME-TVC desalination plants.
The new ME-TVC units have rectangular vessel evaporators instead of circular ones as
shown in Fig. 13, which gives much more freedom of design (Wangnick, 2004).
Additionally, the Duplex stainless steel is also used in these plants instead of 316L Stainless
steel as it has better corrosion resistance, higher strength, longer service life as well as lower
weight and less market price. (Olsson et al., 2007)
.
New Trend in the Development of ME-TVC Desalination System
205
(a) Circular vessel evaporator. (b) Rectangular vessel evaporator.
Fig. 13. Two types of vessel evaporator used in different ME-TVC units.
In 2005, the first large capacity unit of 8 MIGD was commissioned in UAE, which used the
duplex grades stainless steel. It was then used for Al-Hidd plant in Bahrain in 2006 followed
by eight units in Libya in 2007, 27 units in Kingdom of Saudi Arabia in 2008 and 12 units in
Al-Fujairah in 2009 (Peultier et al., 2009).
6.3 System performance development
The rapid developments in the performance criteria of the ME-TVC during the last ten years
can be also observed clearly from Tables 1, 2, 3 and 4 under the following points:
1.
This technology is gaining more market shares recently in Bahrain, Saudi Arabia and
Qatar in large scale desalination projects with a total installed capacity of 60 MIGD, 176
MIGD and 63 MIGD, respectively.
2.
Although the unit size capacities of these desalination projects were almost around six
MIGD, their gain output ratios increased gradually to 8.9, 9.8 and 11.1 during 2006, 2007
and 2009 respectively, as shown in Fig. 14.
3.
Duplex stainless steels are used in manufacturing the new units instead of 316L
stainless steel which have better resistance to corrosion, less costly due to lower
contents of nickel and molybdenum, (Olsson et al., 2007).
4.
The manufacturer tried to increase the number of effects gradually (4, 6, 8, etc.) in order
to increase the size of the units in a compact design.
5.
The new generation of large ME-TVC units with high gain output ratio working in
conjunction with reverse osmosis as in Al-Fujairah has dramatically decreased the
desalinated water production cost as shown in Fig. 15.
Desalination, Trends and Technologies
206
Year
2004200520062007200820092010
Gain Output Ratio
8.0
8.5
9.0
9.5
10.0
10.5
11.0
11.5
Sharjah
Al-Hidd
Al-Jubail
Fujairah
Ras Laffan
Fig. 14. The increase in the gain output ratio of new ME- TVC projects
Year
1996 1998 2000 2002 2004 2006 2008 2010
Water cost, US $/m
3
0.4
0.6
0.8
1.0
1.2
1.4
1.6
Al-Jubail
Al-Tawelah A1
Al-Fujairah
Ras Al-Khaimah
Fig. 15. The drastic decrease in the water cost in the UAE in the last decade.
New Trend in the Development of ME-TVC Desalination System
207
7. Optimization of ME-TVC desalination system
The schematic diagram consists of n number of effects varying from 4 to 16. In any
mathematical optimization problem, the objective function, design variables and constrains
should be specified in order to formulate the problem properly and to select the appropriate
optimization method (Bejan et al., 1996). The general statement of the optimization problem
is in the following form:
Find
{
}
12
,,
N
χ
χχ χ
= …
To Max
(
)
(
)
12
,,
N
ff
χ
χχ χ
= …
Subject to
(
)
0
j
g
χ
≤
, j=1, 2… m
Where
N is the number of design variables and m is the number of constraints.
7.1 Optimization approaches
The objective of this optimization work is to find the optimum operating and design
conditions of ME-TVC desalination unit for different number of effects to maximize the gain
output ratio (
GOR). MATLAB algorithm solution is used to solve the mathematical model
equations by two approaches: (1) Smart Exhaustive Search Method (SESM), which is used
for linear and non-linear programming model, based on "for-loops" algorithm, and (2)
Sequential Quadratic Programming (SQP), which is a versatile method for solving non-
linear constrained optimization problem, based on finding a feasible solution and then start
optimization.
The motive steam flow rate is considered to be available at 7 kg/s, directly from a boiler at
25 bars. The cooling and sea seawater temperatures are 30
o
C and 40 °C respectively.
The main variables that affect the gain output ratio for a particular number of effects and
which can be modified by optimization process are top brine temperature, entrainment ratio
and temperature difference per effect (Alasfour et al., 2005).
A set of lower and upper values of those variables were selected as constraints from
literatures. Since most ME-TVC plants operate with low top brine temperature (TBT) (not
exceeding 75°C) so as to avoid scale formation and corrosion troubles (Al-shammiri & Safar,
1999). The TBT of 76 °C is set here for the upper limit while the lower limit is assumed to be
56 °C (Fisher et al., 1985). The discharged steam temperature
T
d
is considered to be the hot
end temperature of the unit and it is limited by the compression ratio of the steam jet ejector,
usually 3 to 5°C above the allowable top brine temperature. In contrast, the last brine
temperature,
T
n
is kept at least 2°C greater than the feed water temperature, T
f
(El-Dessouky
& Ettouney, 2002), which is assumed to be 10°C greater than the cold end temperature of the
model,
T
c
.
The minimum temperature drop per effect including all thermodynamic losses is close to 1.5
- 2°C (Ophir & Lokiec, 2005) and the maximum temperature drop per effect is set as an
upper limit equal to 5°C, and making it higher than this value leads to high top brine
temperature and consequently high operating cost (Michels, 2001).
The constraints of entrainment and compression ratios are
s
r
D
D
≤ 4 and 4 ≥ CR ≥ 1.81
respectively (El-Dessoukey et al., 2000). The problem can be formulated in a standard design
optimization model as shown in Fig. 16.
Desalination, Trends and Technologies
208
n > 16
n = 4
T
1
= 56
T
n
=
42.8
T
n
>
46
For i = 1: n - 1
T
(i+1 )
T
v (i+
1)
Compute
11.
h
f
i
,
h
gi
,
L
i
,
S
fi
,
S
gi ,
12.
D
1
,
D
i
… ,
D
n
13.
B
1
, B
i
…
, B
n
14.
X
b1
, X
bi
… , X
bn
15. D
f
16. F/D
17. D
No
No
Yes
Yes
Print the optimal
T
1
, T
n
, ΔT , D
s
/D
r
, CR , ER
to give max GOR
Start
Yes
No
n = n+1
T
1
= T
1
+1
End
For i = 1: n
Read in put
T
c
, T
f
, P
s
, D
s
, C, BPE, X
f
For i = 1: n
18.
U
e1,
U
ei
, … , U
en
19.
A
1,
A
i
…
,
A
n
Compute
1.
T
v
1
,
T
vn
2.
ΔT
3.
T
d
=
T
1
+
ΔT
4. F
i
=F/n
5.
P
n
,
P
d
6.
h
fd
h
gd
,
S
fd
,
S
gd
,
L
d
7.
T
s
, h
g
s
,
L
s
,
S
g
s
8.
CR, ER
9.
D
s
/D
r
10.
h
d
Check constrains and updates the optimal
1.
164 ≤≤ n
2.
7656
1
≤≤ T
,
o
C
3.
468.42 ≤<
n
T
,
o
C
4.
481.1 << CR
5.
4<
⎟
⎟
⎠
⎞
⎜
⎜
⎝
⎛
r
s
D
D
6.
575.1 <Δ< T
,
o
C
7. 69,000 <
f
Χ
< 46,000, ppm
T
n
= T
n
+1
Compute
20
. M
c
, A
c
, (LMTD)
c
, U
c
21
. GOR, Q
d
,
At
,
A
d
T
1
>
76
Fig. 16. Solution algorithm of the optimization problem.
New Trend in the Development of ME-TVC Desalination System
209
7.2 Results and discussion
The optimal computed results of the mathematical optimization problem are displayed
below in Table 5.
Temperature,
o
C Ejector Design System performance GOR
n T
1
T
n
ΔT
CR ER D
s
/D
r
Q
d,
kJ/kg
A
d
kJ/kg
At
d
m
2
/kg/s
SESM SQP
4
56 45.8 3.4 1.95 263 0.792 312.8 116.9 450.8 8.18 8.24
5
56 45.8 2.55 1.87 263 0.756 249.6 93.15 699.8 10.27 10.26
6
56 45.8 2.04 1.82 263 0.734 240.1 89.5 947.8 10.67 11.72
7
56 45.3 1.78 1.85 270 0.744 216.3 80.67 1150 11.87 13.28
8
56 43.3 1.81 2 300 0.831 202 75.3 1016.8 12.7 14.57
9
57 42.8 1.77 2.2 307 0.902 187 69.82 982 13.7 15.8
10
59 42.8 1.8 2.43 307 1 174.8 65.42 879 14.61 16.93
11
60.5 42.8 1.77 2.6 307 1.01 161.5 60.5 851.5 15.78 18.1
12
62.5 42.8 1.79 2.85 307 1.22 150 56.36 786.84 16.94 19.41
13
64 42.8 1.76 3 307 1.32 138.3 52 776.5 18.32 20.6
14
66 42.8 1.78 3.33 307 1.47 128.1 48.34 744.6 19.71 21.93
15
67.5 42.8 1.76 3.56 307 1.58 118.2 44.67 752.6 21.31 23.3
16
69.5 42.8 1.78 3.88 307 1.76 109.5 41.47 748.47 22.93 24.74
Time, s 8.89 0.109
Table 5. Optimal operating and design conditions for different number of effects.
In the light of the results shown in Table 5 the following facts can be reported: -
1.
The optimal results of GOR obtained by SQP method are close but better than that
obtained by SESM and the corresponding total execution time is also less (0.109 sec
compared to 8.89 sec, CPU time).
2.
The maximum gain output ratio is varied between “8.2 to 24.7” for 4-effects and 16-
effects and the optimal top brine temperature varies between 56 to 69.5
o
C respectively
as shown in Fig.17.
3.
ME-TVC system can operate at top brine temperature below 60°C with a maximum
gain output ratio of 16.9 for 10 effects.
Desalination, Trends and Technologies
210
50
55
60
65
70
75
80
4
5
6
7
8
9
10
11
12
13
14
15
16
0
5
10
15
20
25
T1
n
GOR
Fig. 17. The impact of top brine temperature and the number of effects on the gain output
ratio.
50
55
60
65
70
75
80
4
5
6
7
8
9
10
11
12
13
14
15
16
0
50
100
150
200
250
T1
n
Ad
Fig. 18. The impact of top brine temperature and the number of effects on the specific exergy
consumption.
New Trend in the Development of ME-TVC Desalination System
211
4. A maximum gain output ratio of 15.8 can be achieved by ME-TVC, which is close to
that of an existing plant (in Sicily), but
with low motive pressure (25 bar compared to 45
bar), less number of effects (9 effects compared to 12) and less top brine temperature
(57°C compared to 63°C).
5.
The optimal entrainment ratios (D
s
/D
r
) vary from 0.79 for 4 effects to 1.76 for 16 effects.
6.
It is clear that as the number of effects increases the gain output ratio, compression ratio
and entrainment ratio increases, while the specific exergy consumption decreases as
shown in Fig. 18.
8. Conclusion
- This chapter outlines the performance developments in multi-effect thermal vapor
compression systems during the last decade in view of some commercial units which
were built by SIDEM Company. The new trend of combining ME-TVC desalination
system with a conventional Multi effect distillation (MED) unit has been used lately in
several large projects. This trend provides an approach to increase the unit capacity
with a more compact design.
-
Most of the new ME-TVC units are commonly operated with large combined cycle
power plants (CC-PP) which are characterized by high efficiency in order to reduce the
power and water costs. Al-Fujairah is an ideal example of a large hybrid desalination
project which led to considerable reduction in the desalinated water cost.
-
Greater understanding of the behavior of the material at different operating conditions
led the manufacturer to use Duplex grades of stainless steel in different parts of the new
units instead of conventional material (316L). Titanium is being selected also for the
tube bundles instead of aluminum brass.
-
Exergy analysis shows that the specific exergy destruction in ALBA unit (94.65 kJ/kg) is
almost twice that in Umm Al-Nar and Al-Jubail units (54.24 kJ/kg and 41.16 kJ/kg
respectively) because high motive pressure of 21 bars is used in ALBA compared to low
motive pressure of 2.8 bars in other units. The analysis indicates that thermo-
compressor and the effects are the main sources of exergy destruction in these units.
On the other hand, the first effect of this unit was found to be responsible for about 31%
of the total effects exergy destruction compared to 46% in ALBA and 36% in Umm Al-
Nar. The specific exergy destruction can be reduced by increasing the number of effects
as well as working at lower top brine temperatures.
-
The manufacturer has tried to improve the new ME-TVC desalination system
projects based on their experience in the previous projects. Further developments can
be achieved by technical optimization in order to reduce the desalinated water
cost.
-
A MATLAB algorithm was developed and used to solve a mathematical model
optimization problem, where different numbers of effects were tested to maximize the
gain output ratio using: (1) Smart Exhaustive Search Method and (2) Sequential
Quadratic Programming. The maximum gain output ratio varied between 8.24 to 24.74
for 4 and 16 effects with an optimal top brine temperature ranging between 56 to 69.5
o
C
and reasonable specific heat transfer area. The optimal ranges of compression and
entrainment ratios were between 1.82 to 3.88 and 0.734 to 1.76, respectively. The
Desalination, Trends and Technologies
212
optimal results of GOR obtained by SQP method are close but better than that obtained
by SESM and the corresponding total execution time is also less (0.109 sec compared to
8.89 sec, CPU time).
-
To conduct a complete and successful optimization in a multi effect thermal vapor
compression desalination system, exergo-economic analysis must be understood to
know the behavior of the quality of the energy from a cost point of view and
this chapter can be an introduction to exergo-economic optimization design in future
work.
9. References
Alasfour, F.; Darwish, M. & Bin Amer, A. (2005). Thermal analysis of ME- TVC + MEE
desalination system.
Desalination, Vol. 174 (2005) 39-61.
AL-Habshi, S. (2002). Simulation and economic study of the MED-TVC units at Umm Al-
Nar desalination plant.
Thesis report, (2002) UAE.
Al-Juwayhel, F.; El-Dessouky, H. & Ettouney, H. (1997). Analysis of single-effect evaporator
desalination systems combined with vapor compression heat pumps.
Desalination,
Vol. 114 (1997) 253-275.
Al-Najem, N.; Darwish, M. & Youssef, F. (1997). Thermo-vapor compression desalination:
energy and availability analysis of single and multi-effect systems.
Desalination,
Vol. 110 (1997) 223 – 238.
Al-Shammiri, M. & Safar, M. (1999). Multi-effect desalination plants: state of the art.
Desalination, Vol. 126 (1999) 45-59.
Ashour, M. (2002) Steady state analysis of the Tripoli West LT-HT-MED plant.
Desalination,
Vol. 152 (2002) 191-194.
Bejan, A.; Michael, J. & George, T. (1996).
Thermal design and optimization, John Wiley & Sons,
0471584673, New York.
Bin Amer, A. (2009). Development and optimization of ME-TVC desalination system.
Desalination, Vol. 249 (2009) 1315-1331.
Choi, H.; Lee, T.; Kim, Y. & Song, S. (2005). Performance improvement of multiple-effect
distiller with thermal vapor compression system by exergy analysis.
Desalination,
Vol. 182 (2005) 239-249.
Cipollina, A.; Micale, G. & Rizzuit, L. (2005). A critical assessment of desalination operation
in Sicily.
Desalination, Vol. 182 (2005) 1-12.
Darwish, M. & Alsairafi, A. (2004). Technical comparison between TVC/MEB and MSF.
Desalination, Vol. 170 (2004) 223-239.
Darwish, M.; Alasfour, F. & Al-Najem, N. (2002). Energy consumption in equivalent work
by different desalting methods case study for Kuwait.
Desalination, Vol. 152 (2000)
83-92.
Darwish, M.; Al-Juwayhel, F. & Abdulraheim, H. (2006). Multi–effect boiling systems from
an energy viewpoint.
Desalination, Vol. 194 (2006) 22-39.
El-Dessouky, H. & Ettouney, H. (1999). Multiple-effect evaporation desalination systems:
thermal analysis.
Desalination, Vol. 125 (1999) 259-276.
New Trend in the Development of ME-TVC Desalination System
213
El-Dessouky, H.; Ettouney, H. & Al-Juwayhel, F. (2000). Multiple effect evaporation- vapor
compression desalination processes.
Trans IChemE, Vol. 78, Part a, (May 2000) 662-
676.
El-Dessouky, H. & Ettouney, H. (2002).
Fundamental of salt-water desalination, Elsevier
Science, 0444508104, Amsterdam.
Fisher, U.; Aviram, A. & Gendel, A. (1985). Ashdod multi-effect low temperature
desalination plant report on year of operation.
Desalination, Vol. 55 (1985)
13-32.
Hamed, O.; Zamamiri, A.; Aly, S. & lior, N. (1996). Thermal performance and exergy
analysis of a thermal vapor compression desalination system.
Energy Conversion
Mgmt
, Vol. 37 (1996) 379-387.
Michels, T. (1993). Recent achievements of low temperature multiple effect desalination in
the western areas of Abu Dhabi, UAE.
Desalination, Vol. 93 (1993) 111-118.
Michels, T. The modern MED pursuing its way in the Gulf Region.
European Desalination
Society, Newsletter,
11 January 2001.
Olsson, J. & Snis, M. (2006). Duplex- A new generation of stainless steel for desalination
plants.
Proceeding of EDS congress on desalination strategies in South Mediterranean
Countries
, Montpelier, 2006.
Ophir, A. & Lokiec, F. (2005). Advanced MED process for most economical sea water
desalination.
Desalination, Vol. 182 (2005) 187-198.
Peultier, J.; Baudu, V.; Boillot, P. & Gagnepain, J. (2009). New trends in selection of metallic
material for desalination industry.
Proceeding of IDA world congress on desalination
and water reuse
. Dubai, November, 2009, UAE.
Power, R. (1994).
Steam Jet Ejectors for the Process Industries, McGraw-Hill, 0070506183,
NewYork.
Reddy, K. & Ghaffour, N. (2007). Overview of the cost of desalinated water and costing
methodologies.
Desalination, 205 (2007) 340-353.
Sayyaadi, H & Saffaria, A. (2010). Thermo-economic optimization of multi effect distillation
desalination systems.
Applied Energy, Vol. 87 (2010) 1122-1133.
Sommariva, C.; Hogg, H. & Callister, K. (2001). Forty-year design life: the next target
material selection and operation conditions in thermal desalination plants.
Desalination, Vol. 136 (2001) 169-176.
Sommariva, C. & Syambabu, V. (2001). Increase in water production in UAE.
Desalination,
Vol. 138 (2001)173-179.
Temstet, C.; Canon, G., Laborie, J. & Durante, A. (1996). A large high-performance MED
plant in Sicily.
Desalination, Vol. 105 (1996) 109-114.
Utomo, T.; Ji, M.; Kim, P.; Jeong, H. & Chung, H. (2008). CFD analysis of influence of
converging duct angle on the steam ejector performance.
Proceeding of the
International Conference on Engineering Optimization,
Rio de Janeiro, June 2008,
Brazil.
Wade, N. (2001). Distillation plant development and cost update.
Desalination, 136 (2001) 3-
12.
Wangnick, K. (2004). Present status of thermal seawater desalination techniques.