Waste Water Evaluation and Management Part 8 docx
Bạn đang xem bản rút gọn của tài liệu. Xem và tải ngay bản đầy đủ của tài liệu tại đây (2.44 MB, 30 trang )
Intelligent Photonic Sensors for Application in Decentralized Wastewater Systems
199
5. References
Abdel-Shafy H. I., Azzam A. M. & EI-Gamal I. M. (1988) Studies on the Degradation of
Synthetic Detergents by Sewage, Bull. Environ. Contain. Toxicol. 41: 310-316
Bartrand T. A., Weir M. & Haas C. N. (2007) Advancing the Quality of Drinking Water:
Expert Workshop to Formulate a Research Agenda, Environmental Engineering
Science 24: 863-872
Basheer C., Chong H. G, Hii T. M., & Lee H. K. (2007) Application of Porous Membrane-
Protected Micro-Solid-Phase Extraction Combined with HPLC for the Analysis of
Acidic Drugs in Wastewater, Anal. Chem. 79: 6845–6850
Bates N. R & Hansell D. A. (2004) Temporal variability of excess nitrate in the subtropical
mode water of the North Atlantic Ocean, Marine Chemistry 84: 225-241
Biswas S., Chowdhury B. & Ray B. C. (2004) A novel spectrofluorimetric method for the
ultra trace analysis of nitrite and nitrate in aqueous medium and its application to
air, water, soil and forensic samples (2004) Talanta 64: 308-312
Borecki M. (2007) Intelligent Fiber Optic Sensor for Estimating the Concentration of a
Mixture-Design and Working Principle, Sensors 7: 384-399
Borecki M., Korwin-Pawlowski M.L. & Bebłowska M. (2008a) A Method of Examination of
Liquids by Neural Network Analysis of Reflectometric and Transmission Time
Domain Data from Optical Capillaries and Fibers, IEEE Sensors J. 8: 1208-1213
Borecki M., Korwin-Pawlowski M.L., Wrzosek P. & Szmidt J. (2008b) Capillaries as
components of photonic sensor micro-systems, Meas. Sci. Technol. 19: 065202 (9pp)
Borecki M. & Korwin-Pawlowski M. L. (2010) Optical capillary sensors for intelligent
microfluidic sample classification. In: Nanosensors: Theory and Applications in
Industry, Healthcare and Defence Lim T C. (Ed.), 215- 245, CRC Press, ISBN 978-1-
4398073-6-1, Boca Raton, FL, USA,
Borecki M., Korwin-Pawlowski M.L., Beblowska M., Szmidt J & Jakubowski A. (2010)
Optoelectronic Capillary Sensors in Microfluidic and Point-of-Care
Instrumentation, Sensors 10: 3771-3797
Bourgeois W., Burgess J. E. & Stuetz R. M. (2001) On-line monitoring of wastewater quality:
a review, J. Chem. Techn. Biotechn. 76: 337 – 348
Bourgeois W., Gardey G., Servieres M & Stuetz R.M. (2003) A chemical sensor array based
system for protecting wastewater treatment plants, Sensors and Actuators B 91: 109-
116
Bürck J., Mensch M & Krämer K. (1998) Field experiments with a portable fiber-optic sensor
system for monitoring hydrocarbons in water, Field Anal. Chem. Technol. 2: 205-219
Cho S J., Sasaki S., Ikebukuro K. & Karube I. (2001) A fluorescent nitrate sensing system
using a reaction cartridge and titanium trichloride, Talanta 54: 903-911
Cusano A., Giordano M., Cutolo A., Pisco M. & Consales M. (2008) Integrated Development
of Chemoptical Fiber Nanosensors. Curr. Anal. Chem. 4: 296-315
Dabek-Zlotorzynska E. & Celo V. (2006) Recent advances in capillary electrophoresis and
capillary electrochromatography of pollutants, Electrophoresis 27: 304-322
Dabek-Zlotorzynska E., Celo V. & Yassine M. M. (2008) Recent advances in CE and CEC of
Pollutants,
Electrophoresis 29: 310-323
De Melas F., Pustogov V. V., Wolcott D. K., Olson D. C., Inberg A., Croitoru N. & Mizaikoff
B. (2003) Combination of a mid-infrared hollow waveguide gas sensor with a
Waste Water - Evaluation and Management
200
supported capillary membrane sampler for the detection of organic compounds in
water, Intern. J. Environ. Anal. Chem. 83: 573-583
Ensafi A. A. & Kazemzadeh A. (2002) Monitoring nitrite with optical sensing films,
Microchemical J. 72: 193-199
Falate R., Kamikawachi R. C., Müller M., Kalinowski H. J. & Fabris J. L. (2005) Fiber optic
sensors for hydrocarbon detectors, Sensors and Actuators B 105: 430-436
Fazalul Rahiman M.H. & Abdul Rahim R. (2010) Development of Ultrasonic Transmission-
Mode Tomography for Water-Particles Flow, Sensors & Transducers Journal 117: 99-
105
Fernàndez-Sànchez J. F., Carretero A. S., Cruces-Branco C. & Fernàndez-Gutièrrez A. (2004)
Highly sensitive and selective fluorescence optosensor to detect and quantify
benzo[a]pyrene in water samples, Analytica Chimica Acta 506: 1-7
Ferrer, L., de Armas G., Mirò M., Estela J. M. & Cerdà V. (2004) A multisyringe flow
injection method for the automated determination of sulfide in waters using a
miniaturised optical fiber spectrometer, Talanta 64: 1119-1126
Holtmann D. & Sell D. (2002) Detection of the microbial activity of aerobic heterotrophic,
anoxic heterotrophic and aerobic autotrophic activated sludge organisms with an
electrochemical sensor, Biotechnology Letters 24: 1313–1318
Hua G. & Reckhow D. A. (2006) Determination of TOCl, TOBr and TOI in drinking water by
pyrolysis and off-line ion chromatography, Analytical and Bioanalytical Chemistry
384: 495-504
Jeon E C., Son H K & Sa J H. (2009) Emission Characteristics and Factors of Selected
Odorous Compounds at a Wastewater Treatment Plant, Sensors 9: 311-326
Ji J., Schanzle J. A. & Tabacco M. B. (2004) Real-Time Detection of Bacterial Contamination in
Dynamic Aqueous Environments Using Optical Sensors, Anal. Chem. 76: 1411-1418
Jo J O. & Mok Y.S. (2009) In-situ production of ozone and ultraviolet light using a barrier
discharge reactor for wastewater treatment, Journal of Zhejiang University Science 10:
1359-1366.
Kamikawachi R. C., Possetti G. R. C., Müller M. & Fabris J. L. (2004) Optical sensor based on
fiber grating for hydrocarbon detection in aquatic environment, Anais de Optica 6:
20-23
Lucklum R., Rössler S., Hartmann J. & Hauptmann P. (1996) On-line detection of organic
pollutants in water by thickness shear mode resonators, Sensors and Actuators B 35-
36: 103-111
Masár M., Sydes D., Luc M., Kaniansky D. & Kuss H M. (2009) Determination of
ammonium, calcium, magnesium, potassium and sodium in drinking waters by
capillary zone electrophoresis on a column-coupling chip, J. Chromatography A 1216:
6252-6255
Mauriz E., Calle A., Montoya A. & Lechuga L. M. (2006) Determination of environmental
organic pollutants with a portable optical immunosensor, Talanta 69: 359-364
Meyer S. (2010) Dewats – Decentralised Wastewater Treatment in Developing Countries, Bremen
Overseas Research and Development Association BORDA, Bremen, Germany
Moorcroft M. J., Davis J. & Compton R. G. (2001) Detection and determination of nitrate and
nitrite: a review, Talanta 54: 785-803
Muttamara S. (1996) Wastewater characteristics, Resources, Conservation and Recycling 16: 145-
159
Intelligent Photonic Sensors for Application in Decentralized Wastewater Systems
201
Nakamura H. & Karube I. (2003) Current research activity in biosensors, Anal. Bioanal. Chem.
377: 446-468
Nakamura H., Shimomura-Shimizu M. & Karube I. (2008) Development of Microbial
Sensors and Their Application. In: Advances in Biochemical Engineering/Biotechnology
vol. 109, Biosensing for the 21st Century, .F. Lisdat (Ed.), Springer, ISBN 978-3-642-
09444-6, Berlin/Heidelberg
Palaniappan A., Moochhala S.,Tay F. E. H., Phua N. C. L. & Su X. (2008) Selective and
enhanced nitric oxide detection using hemoprotein/silica hybrids, Sensors and
Actuators B 133: 241-243
Pons C., Forteza R. & Cerdà V. (2005) Optical fibre reflectance sensor for the determination
and speciation analysis of iron in fresh and seawater samples coupled to a
multisyringe flow injection system, Analytica Chimica Acta 528: 197-203
Praus P. (2004) Determination of chlorite in drinking water by on-line coupling of capillary
isotachophoresis and capillary zone electrophoresis, Talanta 62: 977-982
Qadir M., Bahri A., Sato T. & Al-Karadsheh E. (2010) Wastewater production, treatment, and
irrigation in Middle East and North Africa, Irrig. Drainage Syst. 24: 37-51
Richardson S.D. (2003) Water Analysis: Emerging Contaminants and Current Issues, Anal.
Chem. 75: 2831-2857
Richardson S. D. (2004) Environmental Mass Spectrometry: Emerging Contaminants and
Current Issues Anal. Chem., 76: 3337–3364
Rodrìguez I., Calvo F., Quintana J. B., Rubì E., Rodil R. & Cela R. (2006) Suitability of solid-
phase microextraction for the determination of organophosphate flame retardants
and plasticizers in water samples, J. Chromatography A. 1108: 158-165
Rössler S., Lucklum R., Borngräber R., Hartmann J. & Hauptmann P. (1998) Sensor system
for the detection of the organic pollutants in water by thickness shear mode
resonators, Sensors and Actuators B 48: 415-424
Rulkens W. (2008) Increasing significance of advanced physical/chemical processes in the
development and application of sustainable wastewater treatment systems, Front.
Environ. Sci. Engin. China 2: 385–396
Savage N. & Diallo M. S. (2005) Nanomaterials and Water Purification: Opportunities and
Challenges, J. Nanoparticle Research 7: 331-342
Scharring S. (2002) A Sensor for Organic Compounds in Process Water Control, Chemical
Engineering & Technology 25: 606 – 609
Shirish S., Haberl R., Moog O., Shrestha R. R., Shrestha P. & Shrestha R. (2009) Performance
of an anaerobic baffled reactor and hybrid constructed wetland treating high-
strength wastewater in Nepal—A model for DEWATS Ecological Engineering 35:
654–660
Sivret E. C., Peirson W. L. & Stuetz R. M. (2008) Nitrous oxide monitoring for nitrifying
activated sludge aeration control: A simulation study, Biotechn. and Bioeng. 101:
109 – 118
Sluszny C., Gridin V. V., Bulkatov V. & Schechter I. (2004) Polymer film sensor for sampling
and remote analysis of polycyclic Aromatic hydrocarbons in clear and turbid
aqueous environments, Analytica Chimica Acta 522: 145-152
Sun J., Zhang X., Broderick M. & Fein H. (2003) Measurement of Nitric Oxide Production in
Biological Systems by Using Griess Reaction Assay, Sensors 3: 276-284
Waste Water - Evaluation and Management
202
Tao S. & Sarma T. V. S. (2006) Evanescent-wave optical Cr VI sensor with a flexible fused-
silica capillary as a transducer, Optics Letters 31: 1423-1425
Thomas O., Theraulaz F., Cerda V., Constant D. & Quevauviller P. (1997) Wastewater
quality monitoring, Trends Anal. Chem. 16: 419-424
Toda
K. & Ohba T. (2005) Highly Sensitive Flow Analysis of Trace Level Arsenic in Water
Based on Vaporization-collection In-line Preconcentration, Chemistry Letters 34: 176-
177
Vanrolleghem P.A. & Lee D.S. (2003) On-line monitoring equipment for wastewater
treatment processes: state of the art, Water Science and Technology 47: 31-34
Wen Z H. & Kang T F. (2004) Determination of nitrite using sensors based on nickel
phtalocyanine polymer modified electrodes, Talanta 62: 351-355
Yang J., Her J W. & Chen S H. (1999) Development of an Infrared Hollow Waveguide as a
Sensing Device for Detection of Organic Compounds in Aqueous Solutions, Anal.
Chem. 71: 3740-3746
Yang J. & Chen P Y. (2002) Development of an Infrared Hollow Waveguide Sampler for the
Detection of Organic Compounds in Aqueous Solutions with Limited Sample
Volumes, Analytical Sci. 18: 555-560
Yang J. & Lee C J. (2002) Development of the Infrared Hollow Waveguide Sampler for the
Detection of Chlorophenols in Aqueous Solutions, J. of AOAC International 85: 163-
172
Zourob M., Mohr S., Brown B. J. T., Fielden P. R., McDonnell M. B. & Goddard, N. J. (2005)
An Integrated Metal Clad Leaky Waveguide Sensor for Detection of Bacteria, Anal.
Chem. 77: 232-242
9
Analysis and Selective Treatment of
Radioactive Waste Waters and Sludges
György Pátzay
1
, László Weiser
1
, Ferenc Feil
2
and Gábor Patek
2
1
Budapest University of Technology and Economics
2
Paks Nuclear Power Plant
Hungary
1. Introduction
In the Hungarian PWR-type nuclear power plant Paks (four 500 MW
e
capacity VVER-
440/213 blocks) the radioactive waste waters are collected in common tanks. These water
streams contain radioactive isotopes in ultra-low concentration and inactive compounds as
major components (borate 1.7 g/dm
3
, sodium-nitrate 0.4 g/dm
3
, sodium-hydroxide 0.16
g/dm
3
, and oxalate 0.25 g/dm
3
).
Up to the present the low salinity solutions were evaporated (by adding sodium-hydroxide)
till 400 g/dm
3
salt content (pH~13) and after solidification by cementing buried. There is
about 6000 m
3
concentrated evaporator bottom residue in the tanks of the PWR. In order to
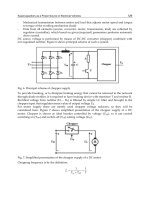
separate the inactive salt content before cementing a Liquid Wastewater Treatment
Technology (LWT see Figure 1.) was developed to treat this wastewater before solidification
and burial (Pátzay et al., 2006).
The long-life radionuclides are present in very low concentration (10
-9
-10
-12
mol/dm
3
) as
ions, suspended, colloid particles and in complex (EDTA, oxalate, citrate) form. In this
technology the SELION CsTreat cesium selective ion exchanger is used for the selectice
separation of radiocesium isotopes (
134
Cs,
137
Cs). The SELION CsTreat cyanoferrate based
cesium-selective ion exchanger is not stable at pH>11 (see reaction equation below), so the
use of CsTreat needs partial neutralisation of the evaporator bottom residue to pH~9-11,
and during neutralisation sodium-borate crystals precipitate with about 15-30% of the
radioactivity.
[
]
4
26 6 2
() 2 2 [()] ()K Co Fe CN OH K Fe CN Co OH
−+ −
+⇒+ + (1)
The contaminated crystals should be washed to remove the radioactive isotopes from the
crystals. To eliminate the generation of radioactive borate crystals and additional wastes we
have developed a M
2
Ni[Fe(CN)
6
] type cesium selective granulated ion exchanger (where M
is an alkali ion) which has good stability even at pH>11.
Based on this new cesium selective ion exchanger stable at pH>11 we have modified the
radioactive evaporator bottom residue treatment technology at the nuclear power plant. The
basic idea of the new technological scheme is the selective separation of all radionuclides
with inorganic sorbent materials or reagents in very simple processes without any prior
neutralization, dilution. After the separation of all radionuclides the inorganic salt content
Waste Water - Evaluation and Management
204
Fig. 1. The Liquid Wastewater Treatment Technology
(borates, partially nitrates) could be separated with crystallization using nitric acid
neutralization and the inactive crystals could be treated as chemical waste. In the first part
of this report this modified separation technology will be discussed.
In the Nuclear Power Plant Paks at the bottom of some radioactive liquid waste containing
tanks there are segregated sludge phases, containing more or less organic complex builder
compounds (including EDTA, citrate and oxalate compounds). The radioactive waste water
treatment technology, developed at the plant is not suitable to treat sludges, so a modified
technology is needed using cementing as solidification. For this technology the detailed
analysis of these sludge phases are of great importance. According to this problems we
started a research work to investigate the international experience in the analysis of
Analysis and Selective Treatment of Radioactive Waste Waters and Sludges
205
radioactive sludges and fulfilled laboratory scale experiments for chemical and
radiochemical analysis of different sludge samples. In the second part of this report the
analysis of these radioactive sludges will be discussed.
2. The modified liquid wastewater treatment technology
The developed modified technology consists of the following parts:
• Firstly the high salt content, strongly alkaline (pH~13-14) evaporator bottom residue is
microfiltered.
• Then the free EDTA, citrate, oxalate content is oxidized with underwater plasma torch
and with Fenton oxidation (in this process Co isotopes removed by precipitation as
oxide-hydroxide and can be separated by filtration). The treated solution is
microfiltered and ultrafiltered.
• Selective separation of the radioactive cesium isotopes (
137
Cs,
134
Cs) using ion exchange
material stable at alkaline pH.
• Crystallization of borates from the mother lye by neutralization with nitric acid.
The modified waste treatment technology was tested at the NPP. After microfiltration about
500 dm
3
evaporator bottom residue was oxidized with underwater plasma torch for the EDTA,
citrate and oxalate removal. The oxidized evaporator bottom residue was then microfiltered
and ultrafiltered to remove suspended matter and cobalt precipitation from the solution
having a pH~12.3 The separation efficiency of the ultrafiltration is shown in Table 1.
60
Co
activity
concentration
(Bq/kg)
%
134
Cs
activity
concentration
(Bq/kg)
%
137
Cs
activity
concentration
(Bq/kg)
%
Feed 2310
100 1350 100 181000 100
Permeate 258 11.2 1210 89.6 164000 90.6
Table 1. Ultrafiltration of the waste water after oxidation of the complex compounds
0 1000 2000 3000 4000 5000 6000
100
1000
DF
DF
Cs-137
throughput in bed volumes (BV)
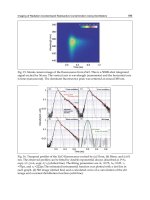
Fig. 2. Breakthrough curve of
137
Cs (BV-bed volume)
Waste Water - Evaluation and Management
206
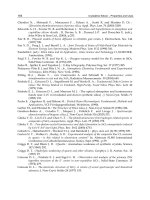
The solution purified from radioactíve cesium was then acidified with concentrated nitric
acid in 20 dm
3
batches in a cooled mixed reactor till pH~9.0. The crystallization reactor is
shown in Figure 3.
Fig. 3. The crystallyzation reactor
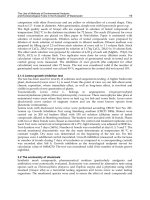
Fig. 4. The separated wet crystals by the original (left) and by the modified (right) technology
The crystals were separated by filtration, dried at 50
0
C and weighted. The crystalline
product contained mainly sodium-metaborate (NaBO
2
*8H
2
O). Heating the product above
55
o
C the crystalline phase released four water molecules and NaBO
2
*4H
2
O formed. Figure 4
shows the separated wet crystals by the original and by the modified technology.
The measured specific radioactivity of the separated, dried crystalls and the unconditional
clearance limit values are summarized in Table 2.
Analysis and Selective Treatment of Radioactive Waste Waters and Sludges
207
Radionuclide Measured specific activity (Bq/g) Unconditional clearance limit (Bq/g)
51
Cr 1.42E-02 30
54
Mn 1.19E-03 1
58
Co 1.01E-03 1
59
Fe 1.93E-03 0.9
60
Co 1.17E-03 0.9
65
Zn 2.66E-03 2
95
Nb 1.10E-03 0.9
95
Zr 1.81E-03 3
106
Ru 1.15E-02 1
110m
Ag 1.83E-03 0.9
124
Sb 1.83E-03 0.9
125
Sb 7.63E-03 1
134
Cs 1.66E-03 0.9
137
Cs 1.11E-01 2
144
Ce 1.02E-02 30
154
Eu 2.59E-02 0.9
3
H 2.94E-02 2000
14
C 1.91E-05 200
55
Fe 3.01E-05 100
59
Ni 6.20E-06 800
63
Ni 2.72E-04 300
90
Sr 3.19E-02 1
99
Tc 7.19E-05 1
129
I 1.24E-09 0.9
234
U 4.69E-07 0.9
235
U 1.71E-07 0.9
238
U 1.09E-07 0.9
238
Pu 4.83E-07 0.9
239,240
Pu 3.62E-07 0.9
241
Am 5.48E-08 0.9
242
Cm 4.01E-07 0.9
244
Cm 4.26E-07 0.9
Table 2. The measured specific radioactivity of the separated, dried crystalls and the unconditional
clearance limit values
Based on our modification of the original wastewater treatment technology in the
Hungarian Nuclear Power Plant we get beneficial results summarized as follows:
• The use of the new cesium selective ion exchanger eliminates the acidification of the
evaporator bottom residue before the cesium removal by ion exchange.
• Hence we can avoid the formation of borate crystals contaminated with radionuclides
of cesium etc. and the additional washing of the separated crystals for the radioactivity
removal.
• According to measured specific activity data we are able to release the dried solid
crystals from the NPP and could be used as non-radioactive borate chemical.
Waste Water - Evaluation and Management
208
3. Chemical and radiochemical analysis of radioactive sludges fron NPP Paks
According to the international experiences the sampling process depends on the sludge
characteristics. The first step of the sampling process is a previous sampling to determine
the boundary between the supernatant and sludge layers. This is followed after 3-4 days by
the sampling. For diluted, liquid type sludges below the supernatant layer we can detect
very often a crystalline salt and amorf sludge layer too. Sampling are usually done from the
top, intermediate and bottom layers using a sampling pipe and vacuum For the
concentrated sludges the samples are taken from different layers of the sludge phase.
Following the sampling the sludge samples are photographed and characterized. The
samples for organic content determination (TC, TOC, TIC) are collected in glass bottles, the
samples for ion chromatographic analysis are stored in polyethylene botles at 4
0
C. The
liquid samples are analysed for pH.
We investigated two times three sludge samples taken from the tanks 02TW30B001,
02TW01B001, 01XZ06B001 of the Paks NPP. The sample characteristics are summerized in
Table 3.
Sample
Code
Tank code Sample type Sampling time
P3 02TW30B001 sludge from the evaporator, pH~13 2008. 11. 06. 11:45
P4 02TW01B001
settled sludge from diluted waste
water tank, pH~8
2008. 11. 06. 11.45
P5 01XZ06B001 sludge from the wash-house waste 2008. 11. 07. 10.30
P3-2 02TW30B001 sludge from the evaporator, pH~13 2009.01.20.
P4-2 02TW01B001
settled sludge from diluted waste
water tank, pH~8
2009.01.20.
P5-2 01XZ06B001 sludge from the wash-house waste 2009.01.20.
Table 3. Sludge sample characteristics
The samples P3 and P4 are seen on Picture 1. The P3 and P4 samples contained liquid phase
too, while sample P5 contained only solid, consistent type phase.
Picture 1. The samples P3 and P4 shaked(left) and settled(right)
Analysis and Selective Treatment of Radioactive Waste Waters and Sludges
209
Physical chracateristics of the sludge samples
Because of the high dissolved and suspended content, high pH and other characteristics the
direct determination of the sludge densities, the total solid content (TS), the dissolved and
undissolved solid content (DS, UDS) was questionable. Separation of the liquid content of
the composite sludge samples by vacuum filtration resulted a given amount of liquid phase
remaining between the particles of the sludge sample and the determination of the total
solid content of the sample is also problematic. Washing the dried sample may cause some
dissolution losses. Because the above mentioned reasons we used an indirect method
suggested by analysts (Ceo et al.,1990) for the determination of the densities and solid
content of the samples. The results are shown in Table 4.
original sludge centrifuged sludge
Sample DS
*
liquid mass UDS
**
flocculation
density
DS
*
liquid mass UDS
**
flocculation
density
% g/ml % g/ml % g/g % g/ml
P3-2
20.417 0.971 10.174 1.139 15.022 0.847 24.415 1.179
P4-2
0.121 0.818 18.274 1.208 0.065 0.772 22.851 1.355
P5-2
- - - - - - - -
(* DS-dissolved solid content,
**
UDS-undissolved solid content, floculation density-undissolved solid
density)
Table 4. Physical charactersitsics of the sludge samples P3-2, P4-2 and P5-2
Organic content of the samples
We determined the TOC, TC and COD values of the centrifuged at 4000g supernatant
portion of the samples P3-2 and P4-2, characterizing the dissolved organic content of the
sludge samples. For the TC and TOC determination we used a SHIMADZU OceaniaTOC-V
CS device, and COD was determined by the potassium bicromate method using potassium-
hydrogen-phtalate reference. Results are seen in Table 5.
Sample dilution COD TC TIC TOC
mg/l mg/l mg/l mg/l
P3-2 100 3785 5271 4177 1094
P4-2 100 971.8 250.5 140.1 110.3
Table 5. Organic content of the centrifuged supernatants
It is seen that sample P3-2 contains higher organic content then sample P4-2.
Chemical composition
Samples P3-2 and P4-2 contained supernatant liquid, which was separated by centrifuging
at 4000g for 15 minutes and the separated liquid phase was analysed for anions (fluoride,
chloride, nitrate, phosphate and sulfate) and for cations (lithium, sodium, potassium,
ammonium, calcium and magnesium) ,by ion chromatography with dilution factors
between 100 and 1000. We used an IC 861 Metrohm type ionchromatograph with a
conductometric detector using an Asupp4-250 type anion, and a C3-250 type cation exchanger
columns, with a Metrohm 837 type degasser and a Metrohm 838 type sampler.
Waste Water - Evaluation and Management
210
Alkalinity (hydroxide, carbonate and hydrogen-carbonate) was determined by titrimetry.
Result of the supernatant chemical analysis of samples P3-2 and P4-2 are shown in Table 6.
P3-2
Cations Anions
mg/l mekv/l mg/l mekv/l
Na 70389.60 3354.9 F 46.27 2.67
NH
4
0 0 Cl 346.16 10.69
K 4021.67 112.69 NO
3
27094.24 478.80
Mg 0 0 PO
4
199.77 6.92
Ca 0 0 SO
4
1170.01 26.69
Mn 0 0 OH 20199.16 1301.19
CO
3
44809.96 1636.66
Sum 74411.27 3467.59 Sum 93865.58 3463.64
P4-2
Cations Anions
mg/l mekv/l mg/l mekv/l
Na 311.2 13.53 F 0 0
NH
4
0 0 Cl 8 0.22
K 0 0 NO
3
40 0.64
Mg 0 0 PO
4
12.2 0.38
Ca 0 0 SO
4
3.7 0.08
Mn 0 0 OH 0 0
CO
3
263.67 8.79
HCO
3
289.70 4.75
Sum 311.2 13.54 Sum 617.27 14.87
Table 6. Chemical analysis of the centrifuged supernatants of samples P3-2 and P4-2
It is seen from the ionic composition of the supernatants, that in the P3-2 sample sudium is
the main cation and important anions are carbonate, hydrogencarbonate and hydroxide. P4-
2 supernatant sample contains only small amount of sodium and hydrogencarbonate ions.
The chemical composition of the remaining after centrifugation solid phases and of the
sample P5-2 was determined by simultaneous wasing water analysis and fusion of the solid
phases using potassium-hydroxide fusion and hydrochloric acid dissolution and sodium-
peroxyde-sodium-hdroxide fusion and hydrochlorid acid dissolution. Washing was
completed by washing 1 g dry sample with 10 ml ultrapure water at 25
0
C and 350 rpm
stirring for 10 minutes, then filtered with a 0,45 micrometer size microfilter. Filtrates were
analsed with ion chromatography. According to results of analysis based on five paralell
measurements sodium cation and chloride, hydroxide, nitrate, phosphate and
hydrogencarbonate anions are present in the washing water samples.
Chemical composition of the solid phase sludges were also determined by the fusion of the
solid phases using potassium-hydroxide fusion and hydrochloric acid dissolution and
sodium-peroxyde-sodium-hdroxide fusion and hydrochlorid acid dissolution.
Fusion using potassium hydroxide was completed with ~1g dry sludge mixed with 5 g
potassium-hydroxide and heated for 30 minutes and after cooling dissolved in 50 ml conc.
Analysis and Selective Treatment of Radioactive Waste Waters and Sludges
211
HCl and 50 ml ultrapure water. The determined potassium content was recalibrated using
the potassium content of washing water samples, supposing that all potassium content is
soluble in water. The total ionic content of the sludge samples P3-2 and P4-2 was calculated
by summing the ionic contrations determined by wasing water and fusion solution analysis.
The equivalent concentrations of the anions were calculated according to the distribution af
the anions in the centrifuged supernatants of samples P3-2 and P4-2 and to the distributions
of the anions in the washing water of sample P5-2.
The variances of the five repeated analysis results of this fusion was between 0,4-39% for the
different ionic components.
For each sludge sample we completed also a sodium-peroxide-sodium-hydroxide fusion
and a hydrochloric acid dissolution too. In the fusion process we mixed ~0.25 g dry sludge
with a mixture of 1.5 g sodium-peroxide and 1 g sodium-hydroxide and heated for 15
minutes at 600
0
C. After cooling the residue was dissolved with a mixture of 50 ml cc. HCl
and 50 ml ultrapure water. Solutions were analyzed by ion chromatography. The variances
of the five repeated analysis results of this fusion was significantly higher (23-87%) then in
case of the potassium.hydroxide based fusion, so we used the results of the smaller
variances.
Results are summarized in Table 7.
a) P3-2
Cations
KOH fusion+HCL total (supernatant+fusion)
mg/g dry sludge mg/l sludgep mekv/l sludge mekv/l sludge mg/l sludge
Na 200.59 17016.05 435.17 3790.07 87132.97
NH
4
0 0 0 0
K 3.83 324.89 8.31 121.00 4731.58
Mg 18.82 1596.50 131.37 131.37 1596.50
Ca 62.42 5295.08 264.22 264.22 5295.09
Mn 281.28 23860.98 1963.46 1963.46 53934.36
Sum
285.66 24232.54 839.07 4306.67 98756.14
Anions
total equivalent capacity ditributed according to supernatant distribution
F - 12.34 0.64 3.31 63.07
Cl - 92.31 2.60 13.30 471.59
NO
3
- 7225.88 116.53 595.33 36913.83
PO
4
- 53.29 1.68 8.60 272.26
SO
4
- 312.03 6.49 33.18 1594.07
OH - 5383.97 316.70 1617.90 27504.34
CO
3
- 11950.68 398.35 2035.02 61050.69
Sum - 25030.54 843.03 4306.675 127869.90
Waste Water - Evaluation and Management
212
b) P4-2
Cations
KOH fusion+HCl total (supernatant+fusion)
mg/g dry sludge mg/l sludge mekv/l sludge mekv/l sludge mg/lsludge
Na 39.04 4199.53 182.67 196.20 4510.73
NH
4
0 0 0 0 0
K 0 0 0 0 0
Mg 11.12 1196.18 98.43 98.43 1196.18
Ca 68.49 7367.47 367.64 367.64 7367.47
Mn 136.66 14700.52 267.58 267.58 7350.26
Sum 118.65 12763.18 648.74 662.27 13074.38
Anions
total equivalent capacity ditributed according to supernatant distribution
F - 0 0 0 0
Cl - 348.30 9.82 10.05 356.30
NO
3
- 1741.50 28.08 28.73 1781.50
PO
4
- 531.16 16.78 17.16 543.36
SO
4
- 161.09 3.35 3.43 164.79
OH - 0 0 0 0
CO
3
- 11479.55 382.65 391.44 11743.22
HCO
3
- 12612.84 206.71 211.46 12902.54
c) P5-2
Cations
KOH fusion+HCl Total(fusion)
mg/g
dry sludge
mg/l
sludge
mekv/l
sludge
mekv/l
sludge
Na 29.29 11704.87 509.13 509.13
NH
4
0 0 0 0
K 0 0 0 0
Mg 6.967 2784.153 229.10 229.10
Ca 60.99 24372.82 1216.21 1216.21
Mn 138.75 55447.28 1009.27 1009.27
Sum
97.247 38861.85 1954.44 1954.44
Anions
total equivalent capacity ditributed according to washing water distribution
F - 0 0 0
Cl - 1535.89 43.32 43.32
NO
3
- 1000.38 16.13 16.13
PO
4
- 21549.04 680.70 680.70
SO
4
- 3731.21 77.69 77.69
OH - 0 0 0
CO
3
- 0 0 0
HCO
3
- 69352.12 1136.60 1136.60
Sum - 97168.64 1954.44 1954.44
Table 7. Ionic composition of solid sludges using KOH fusion and the total sludge
composition
Analysis and Selective Treatment of Radioactive Waste Waters and Sludges
213
We determined also the the undissolved oxalate content of the sludges by treating the
samples first with cc. HCl for the dissolution of iron complexes, followed with a cc. nitric
acid dissolution. The undissolved oxalate content of the samples P3-2, P4-2 and P5-2 was
4.177, 6.848, 23.362 meq/l accordingly.
The EDTA content of the centrifuged supernatants were determined with ion
chromatography with the method suggested by analysts (Krokidis et al.,2005). The EDTA
content (as Na
2
H
2
-EDTA*2H
2
O) was for centrifuged supernatant samples P3-2 and P4-2
10.86 and 12.82 mmol/l accordingly. The iron and manganese content of the sludge samples
were determined by AAS.
The borate content of the centrifuged supernate samples P3-2 and P4-2 was determined also
with ion chromatography with the method suggested by analysts (Tapparo et. al.,1998). The
borate content was for centrifuged supernatant samples P3-2 and P4-2 164.35 and 1.172 g/l
accordingly.
The sludge composition was then calculated based on the ion chromatographic and
titrimetric analysis of the supernatant, washing water, fusion samples and on the ICP-MS
analysis. The calculated sludge compositions are summerized in Table 8.
a) P3-2
Composition mekv/l sludge mmol/l sludge mg/l sludge
NaOH 1618 1618 63084.53
Na
2
CO
3
2035 1017.5 107843.6
NaNO
3
137 137 11644.27
KNO
3
121 121 16723.8
Ca(NO)
3
)
2
264 132 13211.77
MgCO
3
125 62.5 2634.819
sum of ionic 4300 3088 215142.8
Fe(OH)
3
2279.7 759.9 81209
Mn(OH)
2
109.7 54.85 4879.5
b) P4-2
Composition mekv/l sludge mmol/l sludge mg/l sludge
NaNO
3
28.73 28.73 2441.898
Na
2
CO
3
163.47 81.735 8662.995
CaCO
3
227.93 113.965 11406.67
Ca(HCO
3
)
2
139.71 69.855 11324.5
Mg(HCO
3
)
2
71.79 35.895 5252.853
MgCl
2
10.05 5.025 478.4353
Mg
3
(PO
4
)
2
17.16 2.86 751.7733
MgSO
4
3.43 1.715 206.4219
Sum of ionic 662.27 339.78 40525.54
Fe(OH)
3
6134.34 2044.78 218523.6
Mn(OH)
2
581.18 290.59 25848.81
Waste Water - Evaluation and Management
214
c) P5-2
Composition mekv/l sludge mol/l sludge mg/l sludge
NaCl 43.32 43.32 2531.742
NaNO
3
16.13 16.13 1370.965
Na
3
PO
4
449.68 149.8933 24573.63
Ca
3
(PO
4
)
2
231 38.5 11942.04
Ca(HCO
3
)
2
985.21 492.605 79858.36
Mg(HCO
3
)
2
151.4 75.7 11077.89
MgSO
4
77.71 38.855 4676.689
sum of ionic 1954.45 855.0033 136031.3
Fe(OH)
3
4572.75 1524.25 162895.3
Mn(OH)
2
12.742 6.371 566.73
Table 8. The calculated composition of the sludge samples
Radiochemical composition
The radiochemical composition of the sludge samples was determined using gamma- and
alpha-spektrometry and liquid scintillation measurements. For the gamma-spektrometry we
used an ORTEC Model GMX25P4-76-C, Gamma-X HPGe Coaxial Detector with a
CarbonFiber window, connected to a multichannel anlyser ORTEC DSPEC-jr-2.0, the spectra
were measured with 100 cm
3
poliethylene sample with a 3600 sec counting time. Spectra
were evaluated with a Gamma Vision – 32 code. The results show, that in the P3-2 sludge
~99,5% of the gamma-activity is from
137
Cs,
134
Cs and
60
Co isotopes. The centrifuged
supernatant contains 92-92,7% of the cesium, 14,26% of the cobalt and 91,35% of the total
gamma-activity. In the P4-2 sludge ~99,4% of the gamma-activity is from
60
Co
and
137
Cs,
134
Cs
54
Mn isotopes. The centrifuged supernatant contains only 0.62% of the total gamma-
activity. After fusion of the solid parts of the sludges for the P3-2 sample 97% of the gamma
activity is due to
137
Cs and
60
Co, while for the P4-2 sample 89% of the gamma-activity is due
to
60
Co, 5,7%
137
Cs and there is also
54
Mn isotope present. P5-2 sample contains less activity
of which 50,6% is
60
Co and conatins
54
Mn and
137
Cs isotopes too.
Finally we determined the alpha- and beta-emitting isotopes in the samples too using
preconcentration and salt removal techniques.For the alpha-activity measurements we used
TRU columns and alpha-spectrometry and for the determination of beta-activity liquid
scintillation technique. Detailed description of these measurements will be submitted later.
Resultst for the KOH fusion samples radionuclide analysis are shown in Table 9.
Sample P-3-2 Sample P-4-2 Sample P-5-2
Isotope
Act. conc.
Bq/kg
σ
Bq/kg
Isotope
Act. conc.
Bq/kg
σ
Bq/kg
Isotope
Act. conc.
Bq/kg
σ
Bq/kg
234
U
234
U
234
U
238
U
238
U
238
U
239,240
Pu 78.5 ±8.68
239,240
Pu 549 ±21.1
239,240
Pu 127 ±12.7
238
Pu 78.1 ±8.79
238
Pu 429 ±18.5
238
Pu 194 ±15.7
241
Am 73.8 ±3.78
241
Am 771 ±16.5
241
Am 99.8 ±8.82
244
Cm 11.9 ±1.47
244
Cm 124 ±5.64
244
Cm 54.5 ±5.68
90
Sr 21500 ±1080
90
Sr 10200 512
90
Sr 20700 ±1040
Table 9. The measured alpha- and beta-activities of the fused samples with KOH
Analysis and Selective Treatment of Radioactive Waste Waters and Sludges
215
4. Conclusion
The evaporator bottom residue in the NPP Paks contains high inactive salt content
(~400g/dm
3
) with trace amount of radioactive fission and activation products. The
separation of the bulk borate and nitrate from the radioactive minor components is of great
importance before solidification. The modified separation technology produces clean
crystals without radioactive pollutants above the „unconditional” clearance limits. The final
volume reduction factor is higher then 1000.
There are some tanks at the power plant containing sludge type radioactive waste
containing more or less liquid phase too. The general physical and chemical charactersitics
(density, pH, total solid, dissolved solid etc.) and chemical and radiochemical composition
of these sludges are important information for volume reduction and solidification
treatment of theese wastes. Based on the literature sources we have investigated and
constructed a complex analysis system for the radioactive sludge and supernatant analysis,
including the physical, as well as the chemical and radiochemical analysis methods. Using
well known analysis techniques as ion chromatography, ICP-MS, AAS, gamma-and alfa-
spectrometry and chemical alkaline fusion digestion and acidic dissolution methods we
could analyze the main inorganic, organic and radioactive components of the sludges and
supernatants. Determination of the mass and charge balance for the sludge samples were
more difficult then for the supernantant samples. Not only are there assumptions required
about the chemical form and the oxidation state of the species present in the sludge, but
many of the compounds in the sludge are mixed oxides which are not directly measured.
Also, the sludge is actually a slurry with a high water content. The interstitial liquid is in
close contact with the sludge, and there are many ionic solubility equilibriums. The anion
data for the sludge samples are based on the water soluble anions that would be available to
a water wash. The water wash would not account for the insoluble hydroxides, carbonates,
and mixed oxides present. The insoluble species do not contribute to the charge balance, and
the cation charge is not used in the calculation. Most of the nitrate reported for the sludge is
due to the interstitial liquid. Considering the limitations of these calculations, the mass
balance was within the analytical error (±20%) for the sludge samples. There were three
sample preparation methods used to investigate the total anion content of the sludge
samples, which included water leach, potassium-hydroxide and/or sodium
peroxide/sodium hydroxide fusion and acidic dissolution.
5. References
Ceo, R. N., M. B. Sears, J. T. Shor (1990). Physical characterisation of Radioactive Sludges in
Selected Melton Valley and Evaporator Facility storage Tanks. ORNL/TM—11653
Krokidis, A.A., et. al. (2005). EDTA Determination in Pharmaceutical Formulations and
Canned Foods Based on Ion Chromatography with Supressed Conductimetric
Detection. Analytica Chimica Acta, 535, pp. 57-63
Patzay, G.,et. al. (2006). Radioactive wastewater treatment using a mixture of TANNIX
sorbent and VARION mixed bed ion exchange resin, International Journal of Nuclear
Energy Science and Technology (IJNEST), 2(4), 328-341,
Waste Water - Evaluation and Management
216
Tapparo, A., P. Pastore, G. Bombi (1998). Ion chromatographic Determination of Borate in
Aqueous Samples Together with Other Common Anions, Analyst, August, Vol.
123 (1771-1773)
Part 2
Evaluation of Waste Water
Effects on the Environment
10
Effects of Waste Water on Freshwaters in
Semiarid Regions
Miguel Alvarez-Cobelas, Salvador Sánchez-Carrillo,
Angel Rubio-Olmo
1
and Santos Cirujano-Bracamonte
2
1
CSIC-Institute of Natural Resources,
2
CSIC-Royal Botanical Garden,
Spain
1. Introduction
Some freshwater ecosystems have received waste water for many centuries (Alvarez-
Cobelas & Verdugo, 1995), i.e. the Latium wetlands close to Rome or the Thames and the
Spree rivers downstream London and Berlin, respectively. The strong development
experienced in many areas of the world in the 20
th
century has resulted in increasing waste
water disposal almost everywhere that has increasingly threatened freshwater ecosystems
receiving these loadings. The concern of human health and, later, ecosystem health resulted
in the implementation of waste water treatment facilities in many developed countries, such
as those of Northern and Central Europe, USA, Canada and Japan (Tchobanoglous et al.,
2003), which diminished wastewater inputs to freshwater environments. Unfortunately, this
has not been the case in many semiarid countries whose economy or, more often, some lack
of concern for environmental quality does not enable funding enough for these otherwise
expensive facilities. While waste water pollution cannot always be abated, its effects are
likely to be diminished if enough water is available to produce both dilution and wash out,
as often occurs in cold temperate and tropical environments. Unfortunately, this is not the
case in semiarid areas where rainfall is unevenly distributed throughout the year, also
showing a strong interannual variability. For example, Fig. 1 depicts the long-term (1945-
2006) annual precipitation falling on a semiarid central Spanish area, which results in an
average of 418 ± 128 mm/year, ranging 189-857 mm/year.
In fact, traditional approaches to water management in semiarid regions have been based
more on the increase of water availability rather than improving the water quality of waste
waters to make them feasible for future use. In water shortage scenarios, domestic lifestyle
adaptations and optimization of water consumption by both agriculture and industry have
been managed to maintain the balance between water supply and demand. However,
although this balance could be achieved and the amount of waste water reduced, the
characteristic low water flow of semiarid rivers makes impact of waste water discharge in
freshwater ecosystems stronger. Streamwater discharge to wetlands and lakes is highly
variable over time in semiarid areas. Fig. 2 shows an example of these fluctuating water
flows of a semiarid river that drains to a central Spanish wetland (Las Tablas de Daimiel
National Park). Semiarid regions of the world are confronted with a largely unpredictable
Waste Water - Evaluation and Management
220
Fig. 1. Long-term series of rainfall in the vicinity of Las Tablas de Daimiel National Park, a
freshwater marshland in Central Spain. Data were compiled by the Spanish Meteorological
Institute. The long-term trend (P < 0.05) is also shown.
Fig. 2. Long-term water discharge of Gigüela river in central Spain, draining to Las Tablas
de Daimiel National Park. In addition to natural changes, there has been a stronger
variability from the seventies onwards as a result of groundwater exhaustion that
diminished river flow. Data have been gathered by the Guadiana Water Authority, which is
the Spanish administrative office dealing with water quantity and quality in the area.
climate, often recognizing water availability as the single most important limiting resource
for the conservation of aquatic ecosystems. Besides, the natural fluctuating hydrology is
often increased by anthropogenic variability arising from water abstraction for irrigation
purposes. This impact is certainly more frequent in semiarid areas whose agriculture
heavily relies upon water resources that can be either stored in aquifers or flowing in
Effects of Waste Water on Freshwaters in Semiarid Regions
221
streams, thus diminishing the amount of water available for diluting pollutants and cleaning
freshwater environments. That is, the high variability of water availability very often
experiences a positive feedback as a result of unsustainable agricultural consumption
(Postel, 1992), i.e. unsustainable irrigation promotes more variability of water availability.
Furthermore, this excessive irrigation usually uses groundwater as the main water source,
which it is often the single source on which most semiarid ecosystems depend. Already in
many semiarid regions aquifer drawdown by irrigation pumping is such that aquifers
appear overexploited. Therefore, it is not unusual that semiarid aquatic ecosystems receive
sewage as the almost exclusive inflow, becoming the main threat for conservation purposes.
These reduced, natural and man-made inputs of water to aquatic environments usually fail
to minimize pollution impacts triggered by waste water. The point of view that water is
water regardless of its quality results in overlooking the basis of water management in these
areas.
Under these scenarios of water management, it is obvious that the information available is
rather scarce and, more specifically, hardly addresses the topic of waste water effects on
freshwaters in semiarid regions. The conservation of these valuable freshwater ecosystems
demands the need to consider water quantity and quality jointly in any water policy.
Ecological effects of waste water on ecosystems located downstream have been the core of
much research after the initial studies by Kolkwitz & Marsson (1908) and Streeter & Phelps
(1925). Unfortunately, there are pitfalls in this approach. First, it is not of a widespread
nature, mostly pertaining to cold temperate areas where water availability is rarely limited.
Second, effects are only sought in the changing of biological communities and their species
numbers, paying no attention to other processes such as biogeochemical effects, biomass
and productivity effects, and food web effects.
The main goal of this chapter is to outline how waste water (either raw or treated) discharges
can affect the ecological performance of semiarid freshwaters downstream. We will review the
water quality of waste water and later consider both abiotic and biotic effects of those waters
on these ecosystems; since there are very few contributions on this topic, we will mainly rely
on our own research, mostly reporting unpublished information. We will also suggest some
easy-to-use remedial actions to cope with these environmental impacts posed by waste water.
To conclude, we will describe some ideas on future research on the topic.
2. Methods
This chapter mostly relies on data of our own because there is not much published evidence
on the effects of waste water on the ecological performance of semiarid freshwater
ecosystems. Therefore, we will report the studies available on the topic, which are not many.
Since we have been working over more than 30 years on these impacts in some Spanish
ecosystems, including rivers and wetlands and waste water treatment facilities as well, we
will also report unpublished data. Chemical oxygen demand, total nitrogen and total
phosphorus contents have frequently been measured following APHA (1989) procedures.
Also data compiled by some Spanish offices, such as the Guadiana Water Authority and the
National Meteorological Institute, will be used to describe raw and treated waste water
quality. Anyway, we will mainly focus on phosphorus because it is often the main factor
limiting productivity in lakes (Lewis & Wurtsbaugh, 2008).
Waste Water - Evaluation and Management
222
We have also undertaken chemical and biological measurements in streams, lakes and
wetlands over the years. Elemental composition of sediments has also been measured using
a CHN Perkin-Elmer analyzer. Species richness of algae, macrophytes and
macroinvertebrates have also been recorded in streams and wetlands. Cover, biomass and
productivity measurements of phytoplankton, submerged-, emergent- and pleustonic
vegetation have also been carried out (see Alvarez-Cobelas et al., 2011, and Alvarez-Cobelas
& Cirujano, 1996, for an overview of methods).
3. Wastewater quality
Water supply and treatment often received more priority than wastewater collection and
treatment. The trend in human population increase, however, might result in greater
emphasis on wastewater treatment. Although there is a growing awareness of the impact of
sewage contamination on rivers and lakes, few countries recognize that it may affect
valuable ecosystems severely because waste water is deemed for managers and politicians
to be ashamed of. Hence, it is not surprising that there are too few studies reporting its
effects on valuable ecosystems downstream. Table 1 shows some stagnant water bodies that
receive waste water in semiarid areas. It is sure that there will be many more because
treatment facilities are less common in these countries than in higher developed countries
and because the maintenance of operations, and hence the improvement of water quality of
the treated effluents to be discharged to freshwaters, is much better in these countries than
in semiarid, mostly poorer countries.
NAME COUNTRY LATITUDE LONGITUDE
Chott Aïn el Beïda
(playa lake)
Algeria 32° N 5° E
Nature Park Krpacki rit
(floodplain wetland)
Croatia 46° N 19° E
Lake Vistonis, Porto Lagos and Lake Ismanis Greece 41° N 25° E
Lakes Volvi and Koronia Greece 40° N 23° E
Cagliari pond Italy 39° N 9° E
Punte Alberete wetland Italy 45° N 11° E
Babícora lagoon Mexico 29° N 108° W
Souss Massa wetlands Morocco 30° N 10°W
Albufera de Valencia lagoon Spain 39° N 0° W
Alcázar de San Juan lagoons Spain 39° N 3° W
Doñana National Park
(wetlands and marshes)
Spain 37° N 6° W
El Hondo wetland Spain 38° N 1° W
Manjavacas lagoon Spain 39° N 3° W
Las Tablas de Daimiel National Park
(freshwater marsh)
Spain 39° N 4° W
Lake Burdur Turkey 38° N 30° E
Table 1. Some stagnant freshwater ecosystems in semiarid areas which experience
wastewater pollution. Most data are either reported in www.ramsar.org or are authors’
unpublished data.
Effects of Waste Water on Freshwaters in Semiarid Regions
223
One feature of either raw or treated waste water in semiarid areas that deserves mention is the
high variability of its water quality indices (Table 2). Besides, in comparison to most temperate
countries, domestic wastewater in arid areas like the Middle East are up to five times more
concentrated in the amount of chemical oxygen demand per volume of sewage because the
domestic water consumption is lower (Al-Salem, 1987). This is extremely high and may cause
a large amount of sludge production, high-energy consumption for aeration, operational
problems, and high consumption of polymers and clean water for drying the sludge after
digestion (Massoud et al., 2009). Could this mean that conventional Western treatment systems
may even be technologically inadequate to handle the produced sewage in semiarid regions?
Traditional treatment systems are implemented without considering the appropriatedness of
the technology for the economy, culture, land, and climate. If the aridity of climate tends to
increase the concentration of pollutants in waste waters because water use by the human
population living in these regions is often rather low, then the implanted treatment systems
must address this peculiarity; otherwise chances of ecologically successful treatment are very
limited. Although it is not the purpose of this chapter, there is clear evidence that the
application of conventional treatment systems in semiarid countries cause several problems in
the waste water plant functioning, revealing its inability to mitigate the adverse effects to
freshwater ecosystems. Coupled with this, probably the lack of environmental control
mechanisms, the absence of long-term environmental planning and the weakness of the legal
requirements are preventing to achieve the necessary improvements to solve the problem of
waste water discharges in these regions.
Alcázar de
San Juan
Typical domestic wastewater
Biochemical oxygen demand (mg O
2
/L) 25-1750 100-500
Chemical oxygen demand (mg O
2
/L) 70-2550 500-1200
Suspended solids (mg/L) 50-940 250-850
Total nitrogen (mg N/L) 7-36 20-85
Total phosphorus (mg P/L) 2-27 6-20
Table 2. Ranges of raw waste water quality entering the treatment plant of Alcázar de San
Juan (Central Spain, data gathered by the Guadiana Water Authority) compared to a typical
domestic sewage (data reported by Pescod, 1992). The effluent of this facility often flows
into Las Tablas de Daimiel National Park, 60 km downstream.
4. Abiotic effects
Waste water may enter freshwater ecosystems either in raw form or treated. In any case,
water quality variability in sewage is noteworthy, as Table 2 and Figure 3 clearly depict. For
example, total phosphorus concentration in treated waste water can experience high
variations in periods of a few years (Fig. 3), ranging from 55 to 173% as CV in the effluent.
These strong variations in waste water inputs give rise to strong variations in pollution
contents in the reception streams, which is also altered by streamflow fluctuations. Figure 4
shows the dramatic changes in total nitrogen and phosphorus concentrations in a semiarid
river that has experienced waste water inputs since the early seventies in central Spain. If
current European regulations of nutrient levels at the entrance of environmentally-protected
areas were applied (e.g. total phosphorus contents in the waste water effluent lower than 2
mg P/L), this river would be demonstrated to experience at least one episode of strong
pollution per year in recent decades.