Waste Water Treatment and Reutilization Part 6 ppt
Bạn đang xem bản rút gọn của tài liệu. Xem và tải ngay bản đầy đủ của tài liệu tại đây (1.97 MB, 30 trang )
Excess Sludge Reduction in Waste Water Treatment Plants
139
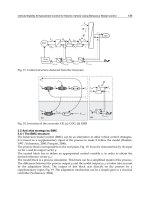
3. The activated sludge which had gathered in the settling tank was sent back to the
aeration tank by a pump (Roller Pump; Furue Science Co.) for a fixed period of time. It
is to be noted that magneto-ferrite effect is applied on system 2 whether another system
was kept without any of the treatment.
4. In order to verify the effect of the magneto-ferrite treatment, the MLSS was measured
periodically for the each of the aeration tanks. The excess sludge was removed if
necessary, then dried and measured the amount of the sludge.
5. The COD of the effluent was measured periodically by a COD meter and COD removal
efficiency was calculated.
The experiments were performed to make clear the effect of the magneto-ferrite treatment;
so the major conditions were kept same for both WWTPs (system 1) and system 2. However,
the values of MLSS of the two aeration tanks were little different at the initial stage which
was not so big in amount and was acceptable. The ingredients of the artificial influent were
as follows;
1. Peptone (Becton, Dickinson and Co.) 0.5g/L
2. Glucose (Kanto Chemical Co.) 0.5g/L
3. Yeast (Becton, Dickinson and Co.) 0.25g/L
4. Ammonium Dihydrogenphosphate (NH
4
H
2
PO
4
) (Kanto Chemical Co.) 7mg/L
5. 25% Ammonia water (Wako Pure Chemical Industries Ltd.) 1mL/L
6. The pH values (6-8.5) were measured regularly of the activated sludge and controlled
the value with NaOH (Nacalai Tesque) dropping if needed.
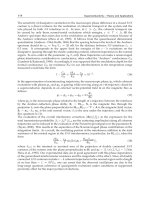
Fig. 5. Model diagram of two laboratory WWTPs
Waste Water - Treatment and Reutilization
140
CAS EA
BOD-Sludge Loading 0.40 0.15
BOD-Volume Loading 0.20 0.05
MLSS [mg/L] 2000 3000
COD of Influent [mg/L] 300 150
Amount of Influent [L/d] 4.48 3.36
Aeration rate [L/min] 3.00 3.00
Table 1. The factors for the reduction of excess sludge
The COD of the influent was controlled at 300mg/L for both systems for CAS method. It
was 150mg/L for EA method. The magneto-ferrite treatment device was run for 12h/d. The
ability of the return pump was fixed at 30mL/min of activated sludge. The return pump
was operated for 1min in every 30min (1min×2 times (in 1h)).
The experiments were continued for about 4 weeks for CAS method while it was run about
10 weeks for EA method. The MLSS of both two aeration tanks were measured periodically
and controlled accordingly to the factors of the experiments. So, we drew up the excess
sludge from the both aeration tanks and compared the amounts of the dried sludge. The
results for CAS method will be described first. The amount of the excess sludge removed
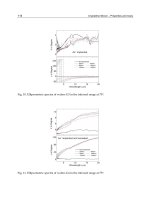
from the two systems can be seen in Fig. 6. It can be seen that for the first 2 weeks, the
amount of excess sludge was about half comparing to the non treated sludge. However,
later the difference in the amount of the excess sludge was getting closer to the non-
treatment aeration tank’s sludge. The BOD of the system 2 was not only from the waste
Fig. 6. Amount of discarded sludge during test tube treatment plant (CAS)
Excess Sludge Reduction in Waste Water Treatment Plants
141
Fig. 7. COD removal efficiency during test tube treatment plant (CAS)
water, but it can be understood that the treated activated sludge was also contributed in the
increasing of BOD of the relevant aeration tank. Thus the input BOD was greater than the
non treated aeration tank (system 1) comparing to the system 2. This reason may influence
the increase of excess sludge in system 2. So, a less amount of BOD is preferable to check the
validity of the magneto-ferrite treatment on activated sludge in laboratory environment. The
COD removal efficiency for CAS method was calculated and plotted in Fig. 7. It can be seen
that the removal efficiency of COD of the activated sludge had been more than 90% in
average. The error bar shows the standard deviation of the efficiency of COD removal of
sludge for both the systems 1 and 2.
Again, the same WWTPs were run with EA process on which one was exposed to the
magneto-ferrite treatment while the other one was run without any treatment. The values of
the amount of the discarded sludge can be found in Fig. 8. It is clear that no excess sludge
was found in system 2 which had been exposed to magneto-ferrite treatment for 10 weeks.
As the whole conditions but the magneto-ferrite effect were same for the two aeration tanks,
it is clear that the excess sludge was disrupted by magneto-ferrite treatment system. The
values of initial stage of two systems were 2744 mg/L (system 1) and 3084 (system 2),
respectively. The average of the MLSS for both aeration tanks were 3303 (system 1) and 2843
(system 2). The standard deviation values for both aeration tanks’ MLSS were 351 for
magneto-ferrite treatment and 546 mg/L for non-treatment system. These figures also
proved the effectiveness of magneto-ferrite treatment on the excess sludge. The COD
removal efficiency for EA method was calculated and plotted in Fig.9. It can be seen that for
EA method, the removal efficiency of COD of the sludge were quite similar. The error bar
shows the standard deviation of the efficiency of COD removal of sludge for both the
systems 1 and 2. At the same time, the values of COD of the effluent for both systems as
they were less than 20mg/L in our observation period.
We checked the ferrite particles after 10 weeks after applying the magneto-ferrite treatment.
The ferrite particles were collected, dried and observed by a photo microscope. The particles
were found in the same size and shape of the initial stage of the experiment.
Waste Water - Treatment and Reutilization
142
Fig. 8. Amount of discarded sludge during test tube treatment plant (EA)
Fig. 9. COD removal efficiency during test tube treatment plant (EA)
Again, the magneto-ferrite treatment was applied for only 12h/d, which showed a good
result. These results proved that our new method is quite effective to reduce excess
activated sludge in miniature WWTPs.
2.2.2 Rotary Plant (Kabir et al., 2010)
We succeded in sludge reduction with test tube plant in lab. scale. The general use of this
method can only be possible if we can build up a treatment plant which can treat large
amount of sludge at a time. However, it is not wise to make a larger test tube for large
Excess Sludge Reduction in Waste Water Treatment Plants
143
amount of sludge treatment. It can be understood that a larger plant should possess the
following characteristics;
a. It can be applicable easily,
b. The setup cost is low and sound in economic,
c. It can be usable with the WWTPs easily
A rotary treatment plant can fulfill these demands. So, we proposed a rotary treatment plant
which can be easily applicable with WWTPs (Fig.5). By the two miniature WWTPs, the
validity of this method can be evaluated at the same room temperature and humid
conditions. A brief explanation of the magneto-ferrite devices will be introduced here.
The rotary magneto-ferrite treatment plant can be seen in Fig.10. Two permanent magnets
are set up on a rotor which is coupled with the shaft of a motor (M590-501K, Oriental Motor
co.). The size and shape of the rotor is shown in Fig.11(a). The strength of a permanent
magnet is 220mT. An acryl plate is fixed above the rotor. This acryl plate is movable. A
round shaped container is fixed on it. The magnetic flux in the container can be changed
with the position of acryl plate. The size of the container is 17cm×5cm and it can contain
870ml of liquid. The material of the container is PVC. It is connected to the return sludge
line of the miniature WWTP (system 2). A fixed amount of ferrite particles with activated
sludge is kept in the container. A stirrer made of free plastic is placed in the container. Free
plastic can be shaped in any size easily as it liquefies at 60°C. The stirrer has a metal plate
installed in it. There are two cuts in the corner side of the stirrer. When the stirrer moves the
activated sludge can easily get under the stirrer. The top and front view of the stirrer can be
seen in Fig.11(b).
The rotor circles when the shaft of the motor starts to move. At the same time, the stirrer and
the ferrite particles of the container start to move with the magnets (Fig.10). The distance
between the stirrer and ferrite particles is a very important factor in this method. This
distance can be controlled by the magnetic flux. Though we could not measure this distance
in this system, we chose a suitable magnetic flux working on the stirrer as well as ferrite
particles by changing the position of the acryl plate in vertical direction. The stirrer with a
metal plate in it is attracted to the bottom of the treatment container. The activated sludge is
oppressed and stirred in the container. The collision is occurred with ferrite particles that
cause the breakdown of the cell wall of microorganisms. Thus the sterilization is performed
and the organic compounds are to be hydrolyzed in the solution. It will plug into the
reduction of activated sludge.
To determine the parameters of the rotary magneto-ferrite system, several experiments were
performed under several circumstances. For a certain amount of activated sludge, there
should be a certain amount of ferrite particles. The speed of the motor that is connected to
the speed of the rotor is an essential parameter. It can be understood that a faster rotor as
well as moving magnets can make more collisions of ferrite particles and sludge. The
treatment time is also important as it is related with running costs of the system.
So, we have performed three types of experiments to determine the parameters. They are as
follows,
a. The density of magnetic flux,
b. The speed of the moving magnets (speed of motor) and
c. The amount of the ferrite particles.
Each experiment was followed by the written processes,
1. Initial amount of microbes were measured. Essential amount of activated sludge was
taken to a beaker for it and it was kept at the room temperature.
Waste Water - Treatment and Reutilization
144
2. 300ml of activated sludge was taken to the container of rotary magneto-ferrite system.
This activated sludge was cultured in laboratory’s aeration tank.
3. Necessary amount of ferrite particles were added in the container.
4. The motor moved for a fixed time with a certain speed. Thus, the magneto-ferrite
treatment was applied.
5. Viable cell was counted for treated activated sludge after each experiment. The living
cell number was compared with that of the initial stage of activated sludge to justify the
degree of sterilization. Sterilization linked to cell lysis.
Fig. 10. Model diagram for rotary treatment plant
(a) rotor and magnets (b) stirrer
Fig. 11. Diagrams of the rotor and stirrer
The sterilization of the microbes was evaluated by calculating the VCC of the samples.
Excess Sludge Reduction in Waste Water Treatment Plants
145
First, we considered the movements of stirrer in the treatment container. If the magnets are too
closer to the container, the stirrer as well as ferrite particles cannot move with the magnets for
the stronger magnetic flux. The stirrer itself gets stick on the bottom of the container. So, we
chose a suitable distance for magnets where the ferrite particles and stirrer can move
smoothly. We could not measure the distance between the bottom of the container and the
stirrer. From the Fig.10, it can be understood that this distance was very short. The magnetic
flux in the container was about 30-50mT in average with the suitable position of acryl plate.
100g of ferrite particles were taken with activated sludge in the treatment container. It was
sealed well so that the sludge could not overflow from the container. The motor of the
rotary plant could rotate up to 1400rpm. The speed of motor was 40rpm and treatment time
was 1h. The viable cells of non-treated sludge and treated sludge were count before and
after the experiments. Then VCC was calculated which had been 1-10%. Other experiments
were performed with 50g of ferrite particles and speed of the motor. The conditions of the
experiments and their results can be seen in Table 2. From, Table 2 it is clear that at least 1h
of treatment is necessary for this system. On the basis of VCC, it can be said that the
sterilization was performed for 2 types of conditions (e.g. 100g ferrite + 40rpm speed of
motor & 50g ferrite + 90rpm speed of motor). Both these conditions showed good
sterilization performances but the stirrer had extra frictions with 100g of ferrite particles
which turned into the instability of the stirrer. So, we chose 50g of ferrite particles for rotary
treatment system.
Two miniature WWTPs were used to evaluate the effect of rotary treatment plant. The
experiments were carried out in CAS method. The shape and the volume of the treatment
container were 17cm × 5cm and 870ml respectively. It can treat about 300ml of activated
sludge at a time. The container was sealed tightly so that only the Roller pump could control
the flow of the sludge in between settling tank and treatment container. The amount of
influent and COD of influent were 3.36L/d and 400mg/L respectively. The treatment time
was 1h. Again, as this system can treat a large amount of sludge at a time comparing to test
tube plant, the running time of this plant was only 4h/d. In 6h, an hour of treatment was
applied to the sludge. The Roller pump was used to send sludge from settling tank to
treatment container.
The initial conditions for system 1 and system 2 were same. However, the initial values of
MLSS of the two aeration tanks were little different. The experiment period was for about
two weeks. MLSS of the two aeration tanks (system 1 and 2) were measured to evaluate the
treatment effect. The measured data of MLSS and calculation data of COD removal
efficiency are shown in Fig.12.
Amount of ferrite [g] Speed of motor [rpm] Treatment time [h] VCC [%]
100 40 1 1-10
50 40 1 10
50 90 1 1-10
50 90 0.5 10-100
Table 2. Determination of parameters for the rotary plant
Waste Water - Treatment and Reutilization
146
From the MLSS values, it can be seen that the activated sludge had been increasing with
time in system 1 but it was well controlled in system 2. The initial values of MLSS for system
1 and 2 were 1960mg/L and 2482mg/L respectively. After 2 weeks, it became 3954mg/L for
system 1 and 3056mg/L for system 2. A simple calculation of activated sludge from the
MLSS values showed that in system 2 (with magneto-ferrite treatment) only 3.8g of sludge
had increased while the non-treated aeration tank it had increased by 13.4g. So, it can be
said that with this rotary plant, a total of 72% reduction had been possible in this
experiment.
The calculation results of COD removal efficiency of the two WWTPs. There was not any
significant difference between the removal efficiency of two miniature WWTPs due to the
magneto-ferrite treatment. The magneto-ferrite treatment was applied for only 4h/d, which
showed a good result. These results proved that our new method is quite effective to reduce
excess activated sludge in miniature WWTPs.
500
1500
2500
3500
4500
0246810121416
Time [d]
MLSS [mg/L
]
0
20
40
60
80
100
COD removal [%
]
MLSS treatment
MLSS non-treatment
COD removal treatment
COD removal non-treatment
Fig. 12. Sludge reduction rotary treatment plant
2.2.3 Magneto-ferrite treatment with electromagnets (Kabir et al., 2012)
The motion of ferrite particles can be controlled by an electromagnet easily. Electromagnets
can be operated with an AC supply. So, electromagnets may be helpful to use magneto-
ferrite treatment. If ferrite particles taken with activated sludge, can be steered up at a height
and let it be down with a certain velocity then it can produce a lot of collisions with
activated sludge to switch on to sterilization as well as reduction of sludge. The results have
showed that electromagnets with AC supply can easily control the motion of ferrite
particles. By controlling the movements of ferrite particles with activated sludge,
sterilization and cell lysis of sludge have been achieved. It will pave the way of excess
sludge reduction in WWTPs.
Two coils (1.51H each) were set up in vertical direction with a certain gap in between them.
These coils were connected with an AC voltage source (BP4610, NF). The coils were
connected with 2 diodes (GSF05A40, VRRM=400V, IFAV=5A) which were installed in
opposite direction to each other. The experimental setup model can be seen in Fig.13. The
diodes were set up with the coil in a way that when the coils were connected with AC
power supply, the electric current was provided alternative directions to the coils.
Excess Sludge Reduction in Waste Water Treatment Plants
147
Fig. 13. Setup model diagram using electromagnets
Thus, the coils become electromagnets alternatively with the AC voltage source. A certain
amount of ferrite particles and activated sludge were taken to the treatment container.
Ferrite particles are magnetic substance and they move with the magnetic flux. While they
moved in the container, collisions occured with the activated sludge. For a certain AC power
supply with frequency, these collisions may break down the cell wall or cell membrane of
bioorganisms of activated sludge. It may switch to sterilization and cell lysis of the activated
sludge. If these treated sludge is taken to the aeration tank where they can be decomposed
by the non-treated sludge, then the sludge reduction can be achieved.
At first, we measured the I-V relationship with 2 types of wave. Sine wave and square wave
were applied to the coils and we measured the electric current in it. Due to the limit of the
voltage source, the voltage applied in the range of 0-120Vp-p. The electromagnetical
charateristics of the coils were measured by a Gauss meter (GM04, HIRST MAGNETIC
Instrument). Thus after learning the electrical properties and magnetical properties, we
utilized them for several measurements regarding on sterilization and cell lysis of activated
sludge.
The material of the treatment container was soft polyethelen and the shape was cylindrical
(φ 41mm×32mm). The capacity of the container was 40ml. Considering the previous results
of magneto-ferrite treatment, 9g of ferrite particles were taken into the container with 20ml
of activated sludge (Kabir et al., 2007, 2009). The treatment was applied for 1-3h.The ferrite
particles and sludge were taken in this container and kept between the coils. A short
description will be provided for the sterilization experiment. Activated sludge was taken from
the aeration tank. An MLSS meter (SS-5F, KRK) was used to measure the MLSS of the sludge
and the values were adjusted if needed. 20ml of sludge was taken in the container with 9g of
ferrite particles. Then sterilization process was investigated.
The I-V relationship of the coils and voltage source was determined. The r.m.s. value was
calculated for both voltage and current for the coils. The electrical characteristics were
measured for the coils for square wave. The frequency was fixed at 1.0Hz. Fig.14 shows the
measured data of current and magnetic flux produced by a coil. The current increased
almost linearly in the coils with voltage. Magnetic flux also increased with current. As the
maximum range of input voltage (120Vp-p) the maximum value of current was found at
4.8A in a coil and 594mT of magnetic flux was achieved. This magnetic flux was sufficient
Waste Water - Treatment and Reutilization
148
enough to move ups and downs of ferrite particles in the treatment container in our
experiment.
The treatment was performed with the determined parameters. The treatment container
with 20ml of sludge and 9g of ferrite particles was set up on the lower coil. We made a room
of 1-2mm between the lower coil and treatment container. The frequency was chosen 1.0Hz
and the wave was 90Vp-p of square wave. The seed activated sludge was taken from the
Yabase Sewage Treatment Plant of Akita city, Japan. The seed activated sludge was cultured
in miniature WWTPs run at Suzuki Lab. of Akita University. The MLSS was 3000-4000mg/l
of the sludge and their COD removal efficiency was about 94%.
0
100
200
300
400
500
600
700
0.01.02.03.04.05.06.0
magnetic flux [mT]
current[A]
square wave
Fig. 14. B-I relationship of a coil
The sterilization of the activated sludge was investigated for 1-3h of treatment. When the
treatment was carried on, 20ml of fresh activated sludge was kept at room temperature
without any treatment. The viable cell was measured for each sample by Easycult T.T.C. The
VCC was calculated after each experiment. The values of VCC for non-treated sludge was
found 100% all the time during the experiments. The sterilization was confirmed with the
treatment after 2-3h of treatment to the sludge. The VCC decreased to 10% after 2-3h of
treatment to the activated sludge. The ferrite particles were moved ups and downs in the
treatment container with magnetic flux. A larger magnetic flux can be helpful to produce
more collisions of ferrite particles with the microorganism of activated sludge and thus
sterilization is performed. Cell lysis can also be achieved at the same time of the sterilization
with the electromagnets which can lead to the reduction of excess activated sludge.
3. Conclusion
Excess sludge is a problem which cannot be steered around in waste water treatment by
biological analysis method. It is a growing demand to control the production of excess
sludge for the sustainable WWT methods as well as the better society. We developed an
innovative method with controlling ferrite particles‘ motion which resulted in the
sterilization and cell lysis of sludge.
Excess Sludge Reduction in Waste Water Treatment Plants
149
It also points towards the new possibilities of this magneto-ferrite treatment. The method can
be applied in the sterilization of the water of swimming pool, ballast tank not only in the
reduction of activated sludge but it can be used of a cargo boat etc. As this process is a non-
thermal sterilization method, many other uses can be expected. Again, this process can be used
as a hydrolyzed method of activated sludge. Activated sludge is well known byproduct for
its water retention ability. So, dewatering is very important process for the treatment of excess
sludge. Our method can be helpful in it. One thing is to be noted that if we can be successful in
reducing even 1% of total excess sludge produced in Japan every year, it can save about
billions of Yen (Japanese currency; Yen) in a year. Thus, our methods have pointed out several
possibilities in the view of both economical and environmental aspects.
4. References
Eckenfelder, W.W. & Grau, P. (Eds.) (1998). Activated Sludge Process Design and Control:
Theory and Practice (2nd ed.), Vol.1, Technomic Publishing Co., Lancaster
Ide, T. (1990). Water Treatment Engineering (2nd ed.), Gihodo Shuppan, ISBN 4-7655-3122-8,
Tokyo [in Japanese]
Ito, T., Murayama, Y., Suzuki, M., Yoshimura, N., Iwano, K. & Kudo, K. (1992). Evidence for
sterilization of Saccharomyces Cerevisiae K7 by an external magnetic flux. Japanese
Journal of Applied Physics, Vol.31, No.6A, pp. L 676-L678
Ghyoot, W. & Verstraete, W. (1999). Reduced sludge production in a two-stage membrane-
assisted bioreactor. Water Resource, Vol.34, No.1, pp.205-215
Kabir, M. Suzuki, M. & Yoshimura, N. (2007). Reduction of Excess Sludge by Ferrite
Particles. Japanese Journal of Water Treament Biology, Vol.43, No.4, pp.189-197
Kabir, M. Suzuki, M. & Yoshimura, N. (2009). Reduction of Excess Sludge by Magneto-
Ferrite Treatment: Observation on Lab Scale WWTPs. IEEJ Transactions on Electrical
and Electronic Engineering, Vol.4, No.4, pp.584-586
Kabir, M. Suzuki, M. & Yoshimura, N. (2010). Reduction of Excess Activated Sludge by
Ferrite Particles: Methods for Practical Use. International Journal of the Society of
Materials Engineering for Resources, Vol.17, No.2, pp.120-125
Kabir, M. Suzuki, M. & Yoshimura, N. (2012). Excess Activated Sludge Reduction by Using
Electromagnets and Ferrite Particles. IEEJ Transactions on Electrical and Electronic
Engineering, Vol.7, No.2 (accepted)
Miyoshi, Y. (2006) Ideas and Techniques of Sewage and Wastewater Treatment, Ohmsha, ISBN 4-
274-02480-6, pp.55-169, Tokyo [in Japanese]
Murayama, Y., Itoh, T., Suzuki, M. & Yoshimura, N. (1993). Effect of magnetic field and
ferrite treatment on various organism. Transaction IEE of Japan, Vol.113-A, No.8,
pp.594-595 [in Japanese]
Press release of Ministry of the Environment, Government of Japan (January 2010).
Available from
[in Japanese]
Sano, A., Bando, Y., Yasuda, K., Nakamura, M., Senga, A. & Kiyokawa, E. (2005).
Enhancement in biodegradability of excess sludge by using centrifugal vibration
mill. Journal of Chemical Engineering Japan, Vol.38, No.6, pp.446-449
Waste Water - Treatment and Reutilization
150
Sawada, Y., Nagashima, S., Uchida, T., Kawashima, N., Takeuchi, S., Akita, M. & Nagaoka,
H. (2005). Basic study on sludge concentration and dehydration with ultrasonic
exposure. Japanese Journal of Applied Physics, Vol.44, No.6B, pp.4678-4681
Yasui, H. & Shibata, M. (1994). An innovative approach to reduce excess sludge production
in the activated sludge process. Water Science Technology, Vol.30, No.9, pp.11-20
Yoshida, T.(Publ.) (2000). Technologies for Minimization of Sludge and Reduction of Sludge
Growth, NTS, Tokyo [in Japanese].
Yoshimura, N. & Suzuki, H. (1991). Sterilizing effect on Yeast cells by ferrite powders.
Transactions IEE of Japan, Vol.111-D, No.11, pp.988-989 [in Japanese]
Yoshimura, N., Suzuki, M. & Sato, T. (1994). Microbic Handling by Means of Electricity and
Magnetism. Journal of the Institute of Electrostatics Japan, Vol.18, No.1, pp.11-17 [in
Japanese]
8
Microbial Fuel Cells for Wastewater Treatment
Liliana Alzate-Gaviria
Yucatan Centre for Scientific Research (CICY),
Mexico
1. Introduction
A typical domestic wastewater treatment plant consists of a series of unit processes, each of
which is designed with specific functions. Process trains will be more variable for industrial
wastewater and for nutrient control.
Conventional sewage treatment may involve these stages:
1.1 Screening
The influent is strained to remove all large objects carried in the sewage stream. This is most
commonly performed with an automated mechanically-raked bar screen in modern plants
serving large populations, whilst in smaller or less modern plants a manually-cleaned
screen may be used. The raking action of a mechanical bar screen is typically paced
according to the accumulation on the bar screens and/or flow rate. The solids are collected
and later disposed of in landfill or incinerated. Bar screens or mesh screens of varying sizes
may be used to optimise solids removal, so as to trap and remove the floating matter, such
as pieces of cloth, paper, wood, kitchen refuse, etc. These floating materials will choke pipes
or adversely affect the working of the pumps if not removed. They should be placed before
the grit chambers. However, if the quality of grit is not of much importance, as in the case of
landfilling etc., screens may even be placed after the grit chambers. They may sometimes be
accommodated in the body of the grit chambers themselves.
1.2 Primary treatment
In the primary sedimentation stage, tanks commonly called “primary clarifiers” or “primary
sedimentation tanks” are used to settle sludge while grease and oils rise to the surface and
are skimmed off. Primary settling tanks are usually equipped with mechanically driven
scrapers which continually drive the collected sludge towards a hopper in the base of the
tank where it is pumped to sludge treatment facilities. Grease and oil from the floating
material can sometimes be recovered for saponification. The dimensions of the tank should
be designed to effect removal of a high percentage of the floatables and sludge. A typical
sedimentation tank may remove from 60% to 65% of suspended solids, and from 30% to
35% of biochemical oxygen demand (BOD) from the sewage.
1.3 Secondary treatment
This is designed to substantially degrade the biological content of the sewage which is
derived from human waste, food waste, soaps and detergent. The majority of municipal
Waste Water - Treatment and Reutilization
152
plants treat the settled sewage liquor using aerobic biological processes. To be effective, the
biota require both oxygen and food to live. The bacteria and protozoa consume
biodegradable soluble organic contaminants (e.g. sugars, fats, organic short-chain carbon
molecules, etc.) and bind much of the less soluble fractions into floc. Secondary treatment
systems are classified as fixed-film or suspended-growth.
It has been estimated that the activated sludge process in publically owned treatment works
in the U.S. requires 0.349 kWh of electricity per cubic metre of wastewater, accounting for
about 21 billion kWh of electricity consumption per year (Goldstein and Smith, 2002).
Pumping and aeration are the predominant energy consuming processes (21% and 30–55%
of the total treatment energy demand, respectively) (EPA, 2008). Similarly in the UK, 3–5%
of national electricity consumption goes towards wastewater treatments. If activated sludge
processes were adopted by engineers in the rapidly developing world to serve, say 19
million people, this would produce an energy bill equivalent to 6.8% of the entire U.S.
electricity consumption (UNICEF, 2000; Water, 2006). We suggest that this is unsustainable,
both on economical and environmental grounds (Oh et al., 2010). The cost of energy will
undoubtedly rise as carbon-based resources become depleted and renewable sources
struggle to make up the shortfall. Operating costs of treating wastewater are therefore likely
to become prohibitively expensive.
Anaerobic digestion of wastewater, particularly industrial wastewater, is usually a cheaper,
if more fickle, option than aerobic technologies. However, the effluent often requires further
treatment to remove residual organics.
1.4 Tertiary treatment
Finally, the purpose of tertiary treatment is to provide a final treatment stage to raise
effluent quality before it is discharged to the receiving environment (sea, river, lake, ground,
etc.). More than one tertiary treatment process may be used at any treatment plant. If
disinfection is performed, it is always the final process. It is also called “effluent polishing”.
The organic matter concentration in wastewater is usually evaluated in terms of either its
biochemical oxygen demand (BOD) in a five day test (BOD
5
) or its chemical oxygen demand
(COD) in a rapid chemical oxidation test. Total BOD or COD can be viewed as consisting of
two fractions: soluble BOD (sBOD) and particulate BOD (pBOD). Most pBOD is removed in
the primary clarifier sludge and sBOD is converted to bacterial biomass (Logan, 2008).
Recycled Sludge
Influent
Effluent
Screens
Grit
Removal
Primary
Clarifier
Biological
System
Secondary
Clarifier
Tertiary
Treatment
Waste
Sludge
Fig. 1. Process flow for a typical wastewater treatment plant. (Metcalf and Eddy, 2003)
Based on this summary of a wastewater treatment process train, we can see that a microbial
fuel cell (MFC) would replace the secondary treatment system and tertiary treatment
(removal of nutrients, ammoniacal nitrogen, phosphorus and organics components)
(Yokoyama et al., 2006). These organics are often volatile fatty acids, which are metabolic
Microbial Fuel Cells for Wastewater Treatment
153
products of anaerobic digestion, whose accumulation has been reported to hinder the
process (Hawkes et al., 2007; Logan and Regan, 2006b; Oh and Martin, 2009). However,
these acids, such as acetate and butyrate, are effectively consumed in MFCs, even at low
concentrations (Kim et al., 2010, Lee et al., 2008; Liu et al., 2005). The sensitivity of MFCs to
low levels of organic contaminants is well documented and has led to their application as
biosensors (Chang et al., 2004; Kim et al., 1999). In addition, multi-stage treatment
combining anaerobic digestion and/or hydrogen fermentation and MFC technologies may
result in reduced accumulation of inhibitory by-products and allow effluent polishing to
more stringent discharge standards (Kim et al., 2010, Logan and Regan, 2006b; Pham et al.,
2006). Combining an MFC with AD and Bio-hydrogen would therefore maximise total
energy recovery and consequently increase the sustainability of wastewater treatment. The
additional heating system to maintain temperature may not be necessary for energy
recovery or wastewater treatment using MFC technology.
2. Exoelectrogens
The idea of using microorganisms as catalysts in an MFC has been explored since the 70s
and 80s (Suzuki, 1976; Roller et al., 1984). MFCs used to treat domestic wastewater were
introduced by Habermann and Pommer (1991). However, these devices have recently
become attractive again for electricity generation, providing opportunities for practical
applications (Schröder et al., 2003; Liu and Logan, 2004; Liu et al., 2004a).
Most microorganisms use respiration to convert biochemical energy into ATP. This process
involves a cascade of reactions through a system of electron-carrier proteins in which
electrons are ultimately transferred to the terminal electron acceptor. Most forms of
respiration involve a soluble compound (e.g. oxygen, nitrate, and sulphate) as an electron
acceptor. However, some microorganisms are able to respire solid electron acceptors (metal
oxides, carbon, and metal electrodes) in order to obtain energy. Several mechanisms explain
how microorganisms respire using a solid electron acceptor (Hernandez and Newman, 2001;
Weber et al., 2006; Rittmann, 2008). Some of these mechanisms involve the use of chelators
or siderophores which effectively solubilise the solid electron acceptor and introduce them
into the cell (Gralnick and Newman, 2007). Other mechanisms involve extracellular electron
transfer (EET), in which microorganisms externalise their electron transport to the surface of
the solid electron acceptor. Researchers have proposed three distinct EET mechanisms,
which are depicted in Figure 2. The first mechanism proposes direct electron transfer
between electron carriers in the bacteria and the solid electron acceptor. This mechanism is
supported by the presence of outer-membrane cytochromes which can interact directly with
the solid surface to carry out respiration (Beliaev et al., 2002; Magnuson et al., 2001). Bacteria
using this mechanism require direct contact with the solid electron acceptor and therefore
cannot form a biofilm. The second mechanism proposes the presence of a soluble electron
shuttle: a compound which carries electrons from the bacteria by diffusive transport to the
surface of the metal oxide (or electrode) and is able to react with it, discharging its electrons.
This compound in its oxidised state then diffuses back to the cells, which should be able to
use the same compound repeatedly (hence the name ‘shuttle’). Bacteria are known to
produce compounds which act as electron shuttles, including melanin, phenazines, flavins,
and quinones (Newman and Kolter, 2000; von Canstein et al., 2008). The third mechanism
proposes a solid component which is part of the extracellular biofilm matrix and is
conductive for electron transfer from the bacteria to the solid surface. This mechanism is
Waste Water - Treatment and Reutilization
154
Fig. 2. Schematic of three EET mechanisms used by ARB: (a) direct electron transfer, (b) an
electron shuttle, and (c) a solid conductive matrix. (Torres et al., 2010)
supported by the recent discovery of the possible role of cellular pili as nanowires (Reguera
et al., 2005; Gorby et al., 2006), which are being characterised for their capability to conduct
electrons. Other components may also be conductive and contribute in EET, such as
extracellular cytochromes or bound electron mediators (Marsili et al., 2008; Rittmann, 2008).
Currently, researchers have not reached a consensus regarding the conditions under which
these EET mechanisms are dominant in natural and engineered systems. Evidence can be
found to support more than one EET mechanism in some cases. For example, recent
discoveries have shown that Shewanella oneidensis is capable of producing shuttles (Marsili
et al., 2008; von Canstein et al., 2008) and nanowires (Gorby et al., 2006). It is not obvious
under which conditions an EET mechanism would be used and whether more than one
mechanism is concurrently utilised by S. oneidensis and other bacteria.
The use of EET is of special importance in microbial fuel cells and electrolysis cells
(collectively referred to as MXCs). In MXCs, anode-respiring bacteria (ARB) carry out a
respiration process in which a solid electrode (the anode) is their electron acceptor. Because
most MXC electrodes are solid conductors which can neither be solubilised nor reduced
(they only act as a conductor), ARB can only externalise electrons through EET in order to
respire using the anode. To date, ARB include members from diverse phyla, such as Alpha-,
Beta-, Gamma-, and Deltaproteobacteria, Firmicutes, Acidobacteria, and a yeast (Logan,
2009, Alzate et al., 2010). Most of these members are known to utilise solid Fe (III) as an
electron acceptor, and they are anaerobic, gram-negative oligotrophs. Substrate-utilisation
capabilities of most of these bacteria are limited to simple fermentation products, such as
acetate and H
2
. However, some members can utilise a wider range of substrates, such as
propionate, butyrate, lactate, and glucose (Debabov, 2008).
A few studies have shown that the maximum current densities produced by ARB are
limited by proton transport inside the biofilm (Torres et al., 2008b; Franks et al., 2009). If
protons produced as a result of substrate oxidation accumulate inside the biofilm, they
decrease the pH and inhibit the ARB. The maximum current density obtained therefore
appears to depend on proton transport rather than factors associated with EET. The highest
current densities reported so far are consistent with relatively high buffer concentrations
(4100mM buffer) (Fan et al., 2007; Logan et al., 2007; Torres et al., 2008; Xing et al., 2008). It is
therefore possible that higher current densities are achievable in ARB biofilms if better
proton transport is achieved (Torres et al., 2010).
Microbial Fuel Cells for Wastewater Treatment
155
3. MFC
MFCs convert a biodegradable substrate directly into electricity and are new types of
bioreactors which use exoelectrogenic biofilms for electrochemical energy production
(Logan, 2008; Logan and Regan, 2006b; Rabaey et al., 2005). (Figure 3).
e
-
e
-
e
-
e
-
H
2
O
O
2
H
+
H
+
Bacteria
Anode
Cathode
Organic
Matter
CO
2
H
+
MED
red
MED
ox
NAD
+
NAD
+
NADH
Membrane
Fig. 3. Schematic of the basic components of a MFC. Bacteria grow on the anode, oxidising
organic matter and releasing electrons. The cathode is sparged with air to provide dissolved
oxygen for the reaction of electrons, protons and oxygen at the cathode, completing the
circuit and producing power. (Logan, 2008)
MFCs have advantages over other technologies used for generating energy from organic
matter. First, the direct conversion of substrate into electricity permits high conversion
efficiencies. Second, they operate efficiently at ambient temperature, including low
temperatures. Third, they do not require the treatment of biogas generated in the cell. Fourth,
they do not require additional energy to aerate the cathode, given that it can be aerated
passively. Fifth, they have the potential for application in remote areas without electrical
infrastructure, making them an additional renewable energy option to meet global energy
requirements. Finally, MFCs involve an anaerobic process, and bacterial biomass production
will therefore be reduced compared to that of an aerobic system. Estimated cell yield from a
MFC process is in the order of Yx/s=0.16 g-COD-cell/g-COD. This is about 40% of the value
produced by an aerobic process of Yx/s=0.4 g-COD-cell/g-COD (Logan, 2008)
A variety of biofuels and by-products can be obtained from organic biomass present in solid
and liquid waste, with glucose forming the main source of carbon (Logan, 2004; Alzate et al.,
2007; He and Angenent, 2006). The main stoichiometric reactions in fermentative
microbiological metabolism include:
Waste Water - Treatment and Reutilization
156
There are three typical configurations amongst MFCs with a proton exchange membrane
(PEM) (Figure 4): A. Bioreactor separate from the MFC: the microorganisms generate
hydrogen, which is then used as fuel in a fuel cell. B. Bioreactor integrated into the MFC: the
microorganisms generate hydrogen which is converted into electricity in a single cell. C.
MFC with direct electron transfer: microbiological electricity generation and direct transfer
to the anode (Rabaey et al., 2005).
Bacteria
Electrode
PEM
(Proton Exchange
Membrane)
H
2
O
2
H
2
O
H
+
e−
e−
Organic
Matter
H
2
A
Bioreactor
B
Organic
Matter
O
2
H
2
O
H
2
e−
e−
H
+
C
O
2
H
2
O
H
+
e−
e−
Organic
Matter
Fig. 4. Different MFC configurations with PEM. (Rabaey et al., 2005)
Microbial Fuel Cells for Wastewater Treatment
157
MFCs can be monitored via electrochemical parameters, such as power density, generated
electrical current and voltage. Equally, a very important biological parameter is the organic
load of the substrate to be used, expressed in Kg m
-3
d
-1
(Rabaey et al., 2003).
Recently, much attention has been focused on the tubular type of MFCs (Clauwaert et al.,
2007; Kim et al., 2010; Rabaey et al., 2005a) which increase sludge retention time and reduce
hydraulic retention time, which would reduce the long term operating cost. Power densities
from industrial and domestic wastewater using MFCs range from 4 to 15 W/m
3
(Cheng et
al., 2006; Feng et al., 2008; Liu and Logan, 2004). The anode has, for example, been made of
graphite granules (diameters between 1.5 and 5 mm, surface areas between 1000 and 3000
m
2
/m
3
), which microorganisms can easily attach to. Rabaey et al. (2005) observed a
maximum power density of 90 W/m
3
with acetate feeding at 1.1 kg COD/m
3
/day.
Clauwaert et al. (2007) used a similar configuration but with a biocathode exposed to air
which produced a maximum power density of 65 W/m
3
at 1.5 kg COD/m
3
/day (Oh et al.,
2010).
Finally according to Oh et al. (2010), innovation in the design of new MFC reactors has been
driven by the desire to increase power output and decrease capital costs. Therefore,
materials which minimise internal electrical resistance, designs which maximise the surface
area which electrogenic bacteria can attach to and the removal of expensive materials such
as noble metal catalysts on the cathode have been the focus of much of the research activity.
This iteration towards optimal design has paid dividends. Reported power outputs in
laboratory-scale MFCs have increased from 0.001 to 6.9 W/m
2
(Fan et al., 2008) in less than a
decade. Material costs have deceased, but need to decrease further to make MFCs attractive
alternatives to other forms of wastewater treatment and pilot plants are emerging (Cha et
al., 2009, Rabaey and Keller, 2008). Electricity produced by MFCs may never be a cost
effective source of energy in its own right. Rather their contribution will be one of reducing
the energy used in wastewater treatment. Switching wastewater treatment from an aerobic
to anaerobic process would dramatically cut energy consumption by obviating the need to
aerate the sludge. However, conventional anaerobic treatment technologies are often
thought of as being slow, need concentrated waste and high temperatures to operate
reliably, the effluent often requires further treatment before it can be discharged and sludge
disposal is still required. Microbial fuel cells appear to operate at lower temperatures and
yield less biomass. In addition, the fact that the bacteria donate electrons to an external
circuit with a controllable resistance may ultimately make the whole treatment process
amenable to real-time control. The electrical current is a continuous index of the efficiency of
the process. This is a neglected area of research for microbial fuel cells which will assume
greater importance when MFCs are scaled up for use in real wastewater treatment plants.
Least is known about the ecology of microbial communities which metabolise the waste or
catalyse the reactions on biocathodes. Microbial communities have been used in
conventional wastewater treatment technologies without necessarily having a deep
knowledge of the dynamics of the populations, so perhaps our lack of knowledge is not a
barrier to the adoption of MFCs. However, when microbial communities behave in
unexpected ways and treatment technologies go wrong it can be baffling. A good
understanding of the acclimatisation of the communities in MFCs and their response to
environmental perturbations would reduce the perceived risks and accelerate the adoption
of MFCs. New sequencing technologies combined with proteomics and metabolomics could
provide us with a much clearer picture of the changes in community composition and
Waste Water - Treatment and Reutilization
158
metabolic pathways which occur in response to different operating conditions. However,
even if this deep understanding of the biology at work in an MFC takes many years to
achieve it seems clear that, even in the short term, MFCs will have a role to play in
sustainable wastewater treatment.
We go on to present how a MFC can generate electricity with electron transfer from the
anode to the cathode using a mixed microbial consortium previously adapted as
biocatalysts. We examined three factors which could affect MFC operation: external
resistance, pH and the effect of temperature.
4. Methodology
4.1 Microorganisms and substrate source
The biocatalysts used for electricity generation were obtained from a previously stabilised
MFC (Alzate et al., 2010). The source of the substrate was Synthetic Wastewater (SW) (Poggi
et al., 2005), with Sigma® brand reagent grade glucose as the carbon source. The SW had a
pH of between 5 and 6 and the following composition per litre: 4g glucose; 310mg NH
4
Cl;
130mg KCl; 4.97g NaH
2
PO
4
; and 2.75g Na
2
HPO
4
.H
2
O (Lovley and Philips, 1998).
4.2 Microbial fuel cell
A large range of materials and designs have been used in MFCs. In this study a MFC was
built from glass with a working volume of 350 ml for both the anolyte and catholyte. The
anode chamber was bubbled with N
2
to displace the O
2
present before the anode was closed.
Untreated carbon paper distributed by Fuelcell (Toray carbon paper®) was used for the
electrode.
The PEM cell consisted of 2 chambers, one for the anode and one for the cathode, joined by a
proton exchange membrane called Nafion
®
117, with a film thickness of 183µm reinforced
with a PTFE copolymer (teflon/perfluorosulphonic acid). Its molecular structure permits the
absorption of water and once moist, it selectively conducts positively charged ions, blocking
those with a negative charge. This characteristic is combined with the established chemical
inertness, mechanical resistance and stability of Teflon
®
resins (Fuelcell Internacional, USA).
The membrane was activated before use with 1N H
2
SO
4
at 45°C for 24h (Kim et al., 2005).
In the cathode chamber an aqueous catholyte with air bubbling for O
2
use was used with
untreated carbon paper with Pt (0.5 mg Pt 10% per cm
2
) for the electrode, whilst the
previously selected and stabilised flocculent-type mixed inoculum was used at the anode.
No catalyst was applied to the latter electrode, given that this function is performed by the
microorganisms present in the inoculum.
The carbon paper electrodes used in each chamber were 1.7 cm x 1.6 cm, with a total area of
5.44 cm
2
.
MFC start-up consisted of colonising the electrode with the microbial consortium contained
in the inoculum in order to form a biofilm; or a complex community of microorganisms
which adhere to the electrode and produce a cellular polymer coating which helps them to
retain nutrients and protect themselves from toxic agents, and finally produce electricity.
During this process three sequential inoculum transfers were performed until a constant
electrochemical response with a constant voltage was obtained. In addition, the voltage
pattern was reproduced on the third addition of mixed inoculum to the anode. It is worth
noting that strict anaerobic conditions were not maintained for the change of inoculum. The
Microbial Fuel Cells for Wastewater Treatment
159
experiments were performed at mesophilic temperatures by placing the cell in a
thermostatic bath.
Two external resistances were used for the PEM cell circuit, one of 1000Ω over a period of
102 days and a second of 600Ω during the remaining days. Based on previous experiments
(Liu et al., 2004a; Logan, 2004), the MFC was operated for a period of no greater than 155
days, not including start-up. The changes which occurred in the microbial community
during this time were monitored via electrochemical monitoring.
4.3 Electrochemical monitoring
This was performed by measurements of power density produced by the MFC, using a
Fluke
®
multimeter. A resistance was set for the circuit to obtain current data. The current (I)
in amps was obtained as: I=VxR-1=Qxt-1, where V is the voltage (volts), Q is the charge
(coulombs) and t is the time (seconds). Power (P; watts) was measured as P=IxV and energy
production was measured in joules using the equation E=Pxt.
Efficiencies are expressed based on the experimental coulombic efficiency compared to the
theoretical one, which varies in accordance with the type of substrate used in the MFC
(Rabaey et al., 2004).
4.4 Analysis
The electrode was monitored by taking measurements of volatile fatty acids by titration,
hydrogen potential (pH), temperature and soluble chemical oxygen demand (COD) in the
liquid current. These parameters were determined in accordance with APHA procedures
(2005). Finally, current and voltage measurements were performed with a multimeter and
coulombic efficiency was calculated as
%
Cp
CE 100
Cti
=×
, where CP is total coulombs
calculated as the integral of current with respect to time and Cti is the theoretical amount of
coulombs calculated from the following equation
ti
FbSv
C
M
×××
⎡
⎤
=
⎢
⎥
⎣
⎦
, where F: Faraday’s
constant, b: is the number of moles of electrons produced per mole of substrate, S: substrate
concentration, V: liquid volume and M: molecular weight of the substrate used in the MFC.
5. Results and discussion
5.1 MFC Start-up
When the MFC was inoculated with biocatalysts from a previously stabilised MFC there
was a 30h lag phase followed by a rapid increase in voltage over the following 40h, reaching
a maximum voltage of 0.4V (Figure 5). The voltage subsequently decreased gradually as the
organic matter contained in the inoculum was consumed. On adding the third transfer of
inoculum to the MFC the behaviour was similar, producing a stability range of 0.37 ± 0.03V,
comprising the last stage in the pattern of bacterial growth. Growth ceased and cell death
occurred once the substrate was consumed, and voltage generation was affected.
After 120h in operation, part of the inoculum was replaced with SW and just 10% of the
inoculum was conserved. Electricity was immediately seen to be generated in the previously
inoculated MFC (Figure 6), reaching a maximum voltage of 1.05V and maintaining a range
of 0.90 ± 0.1V over the following 55h.
Waste Water - Treatment and Reutilization
160
0
20 40 60 80 100 120
140
0.0
0.1
0.2
0.3
0.4
0.5
3
2
1
Voltage
(V)
Time (h)
Fig. 5. Voltage generation by MFC during start-up. Arrows indicate replacement.
0 10
20
30
40 50 60
0.0
0.2
0.4
0.6
0.8
1.0
1.2
Voltage (V)
Time (h)
Fig. 6. Voltage generation from glucose as substrate.
Microbial Fuel Cells for Wastewater Treatment
161
5.2 Effect of substrate concentration
Voltage production in the MFC (Figure 7) followed a saturation kinetic, or in other words,
the use of substrate in biological systems according to concentration and transport speed
(Liu and Logan, 2004). As can be seen in the figure, voltage increased as glucose
concentration increased, and remained constant at 1.15 ± 0.05V from a concentration of 1000
mg·L-1. The maximum rate of substrate use therefore occurs in high concentrations of the
same (Metcalf and Eddy, 2003).
0
50
0
100
0
150
0
200
0
250
0
300
0
0.
0
0.
2
0.
4
0.6
0.8
1.0
1.2
1.
4
Maximum Voltage
(V)
-1
Initial Concentration (mg L )
Fig. 7. Maximum voltage generation as a function of glucose concentration.
5.3 Continuous measurement of electricity generation
In this stage electricity generation was monitored over a period of 130 days. With a
resistance of 1000Ω the voltage remained at 0.88 ± 0.17V during the first 102 days. After 102
days, a resistance of 600Ω was used, giving values of 0.91 ± 0.08V. With greater fuel
oxidation by the microorganisms we expect greater oxidation rates of the electron
transporters in the culture at low resistances. In addition, a MFC can be started at low
resistances to remove pollutants with high organic indices (Jang et al., 2004).
5.4 Power generation in the MFC
The power density generated by the MFC was measured in W·m-3 based on liquid volume,
and the power equation was used for calculations. Using a resistance of 1000Ω, the
maximum power density generated was 4.41 W·m
-3
with a voltage of 1.05V. When a
resistance of 600Ω was used, a maximum power density of 6.53 W·m
-3
was obtained with
0.99V and organic matter removal expressed in COD was 65% and 82%, with 1000 and 600Ω
respectively. Table 1, shows the comparison of selected performance parameters of MFCs
Waste Water - Treatment and Reutilization
162
with a proton exchange membrane, and we can see that there is a wide range of power
values related to the electrode and MFC architecture, the substrate, the inoculum and the
redox mediator. Our results are found in the mid-to-low range given that we used a basic
architecture, without an external redox mediator.
Substrate
Mixed
Culture
Electrode Type Redox Mediator
CE
(%)
P
(W/m
3
)
References
Glucose
Mixed
consortium
Plain graphite
Ferricyanide
solution cathode
89 216
Rabaey,
2003
Acetate
Sewage
sludge
Plain graphite
Ferricyanide
solution cathode
and Mn(4+)
graphite anode
and Fe (3+)
graphite cathode
- 32
Park,
2003
Wastewater
Bacteria
present in
wastewater
Plain graphite None 12 1.6
Liu,
2004
Wastewater
Activated
sludge
Plain graphite None - 1.7
Kim,
2004
Glucose
Bacteria
present in
wastewater
Woven
graphite
None 40 13
Liu,
2005
Synthetic
wastewater
Anaerobic
and aerobic
sludge
Granular
graphite
Hexacyanoferrate
cathode
- 258
Aelterman,
2006
Acetate
Microbial
fuel cell
Granular
graphite
None
Biocathode
exposed to air
90 65
Clauwaert,
2007
Wastewater
Bacteria
present in
wastewater
Graphite brush
anodes
None 23 2.3
Logan,
2007
Sucrose
Anaerobic
sludge
collected
from septic
tank
Stainless steel None 7.29 36.72
Behera,
2009
Sodium
acetate
Anaerobic
digested
sludge
Carbon cloth None 39.6 16.7
Cha,
2010
Synthetic
wastewater
Non-
anaerobic
Carbon paper None 59
4.41-
6.53
Alzate,
2008
Table 1. Comparison of selected performance parameters of MFC with proton exchange
membrane
The results show that operating with lower external resistances increases power density
production and leads to increased organic matter removal (Jang et al., 2004). This system
Microbial Fuel Cells for Wastewater Treatment
163
uses an aqueous catholyte to provide the electrode with dissolved O
2
, without using
external mediators. Microbial consortiums generate greater power density than pure
cultures (Pham et al., 2006; Rittmann, 2006).
One of the highest power densities reported in the literature is 386 W·m
-3
(Aelterman et al.,
2008), where sodium acetate was used as a substrate and potassium hexacyanoferrate was
used to optimise cathode performance. Ferricyanide is very popular as an electron acceptor in
MFC experiments and reaches greater voltages than using O
2
. The great advantage of
ferricyanide is the low overpotential using flat carbon cathodes. However, power generation
with ferricyanide is not sustainable as a result of insufficient reoxidation via O
2
, which requires
regular replacement of the catholyte. Furthermore, long periods of system operation can be
affected by ferricyanide diffusion to the anode chamber (Logan and Reagen, 2006b).
5.5 Influence of pH
Another important parameter in MFC performance is the pH of the anode chamber. The
experimental results clearly showed the dependence of MFC performance on the influent
pH. During the experiment the pH of the anolyte was maintained at 6.7. The highest power
densities occurred at pH values near neutral, with results ranging from 3.68 to 4.41 W·m
-3
in
the case of 1000Ω. Recorded power density decreased slightly when the pH was < 7.0,
remaining at 3.55 W·m
-3
. In the measurements taken when using a resistance of 600Ω, a
maximum power density of 6.53 W·m
-3
was obtained at a pH of between 6.8 and 7.0. This
result agrees with the results reported by Gil et al. (2003) and He et al. (2008). Both studies
observed that low pH (pH 5 and 6) resulted in lower electricity generation. The lower pH in
the MFC might have inhibited the activity of electrogenic bacteria. Other researchers have
also reported that an acidic pH in the anode chamber reduces power production. Ren et al.
(2007) reported a significant decrease in power production when the pH in the anode
compartment dropped to 5.2 due to the acidic products of fermentation, and power
production was rapidly resumed when the pH of the anolyte was increased to 7.
5.6 Effect of temperature on MFC performance
Anaerobic digestion requires 30–50°C for optimal operation but MFCs are known to operate
well at ambient temperature (Ahn and Logan, 2010; Jadhav and Ghangrekar, 2009; Min et
al., 2008). Organic removal increased but the electricity production decreased, which might
be due to increased activity of methanogens. The additional heating system to maintain
temperature may not be necessary for energy recovery or wastewater treatment using MFC
technology. The MFC operated at a mesophilic temperature of 35 ± 5°C during the first 102
days. During this period the maximum power density reached was (4.41 W·m
-3
) using
1000Ω at 37°C. A constant temperature of 40°C was maintained for the following days,
obtaining a maximum power density of (6.53 W·m
-3
) with 600Ω. Under this last scheme the
temperature was increased by 5°C, obtaining 6.54 W·m
-3
. We should note that the
temperature increase to 45°C did not lead to significant increases in power density, given
that the result obtained is very similar to the one reached at an operational temperature of
40°C. These results reflect the strong influence of the external resistance used, together with
an optimum operational temperature (Rozendal et al., 2006).
A significant advantage of MFCs is that they can produce electricity from organic matter
whilst operating at moderate temperatures, for example 20-40ºC (Min and Logan, 2004;
Niessen et al., 2004; Oh et al., 2004; Kim et al., 2005; Liu et al., 2005; Aelterman et al., 2006;
Cheng et al., 2006; Zhao et al., 2006; Logan et al., 2007; Oh and Logan, 2007).