Emerging Communications for Wireless Sensor Networks Part 4 docx
Bạn đang xem bản rút gọn của tài liệu. Xem và tải ngay bản đầy đủ của tài liệu tại đây (1.12 MB, 20 trang )
Automated Testing and Development of WSN Applications 53
Although the code for picking the log entries out can be generated, the routine represented
by the assertion has to be implemented manually. The reason is the same as for most actions
in the test case model: The routine to check for a certain failure is specific to the application
being tested. However, there is one typical failure for which the routine can be generated
without the need of manually written code. This type of failure requires the following
reasonable assumption about the test case model: The modeled sequence of actions
represents the test course that is expected in case the application being tested does not fail.
Thus, if the execution of the test case is aborted, we conclude that a failure occurred. For
example the action SendSecondPacket shown in Figure 6 may abort the execution of the test
case to indicate that the routing protocol failed to send the data packet. A generated routine
will report this failure by indicating that the action aborted the execution of the test case.
Through aborting the execution of the test case a failure can be reported very easily because
no manually written code is needed besides a single call by the action to abort. Since failures
that can be reported in this way are of common interest we save significant time to
implement code for reporting failures.
Altogether we accumulate the following test results: Failures reported by assertions, a
failure reported by aborting the execution of the test case, and the data that has been logged
by log actions. To facilitate the reading of these test results, we incorporated them into the
diagrams of the test case model. The diagram in Figure 8 incorporates the test results
indicating the failure reported by the assertion CheckPacketIntegrity. This failure is shown
by the lightening icon in the lower left of the assertion. The tooltip of that icon prints: “The
payload of the data packet was corrupted.” Additionally, the i icon in the lower left of the
log action LogRadioPacket indicates the logged data. The tooltip of that icon prints the data
of the data packet. Thus, the test results are easily accessible in the diagrams, because each
piece of information is assigned to a corresponding action in the test case model. Without
the incorporation of the test results, the user would have to read a textual log, with no
reference to the test case model. To understand the information given by the textual log the
user would have to embed it into the context of the test scenario herself which is a difficult
and time consuming task. The improved readability of the test results also makes it easier
and less time consuming to use log actions to get insights on the cause of a reported failure.
If we got the test results shown in Figure 8, we would look at the data logged by the log
action LogRadioPacket and may notice that the payload was still intact but only the last byte
was missing.
Fig. 8. Test results incorporated into the diagram by adding icons to the lower left of the
actions
After we detected a failure by executing a test case, our next step is to fix the fault within the
application being tested which caused it to fail. But before we can correct the application
code, we have to locate the fault (see Figure 9).
Fig. 9. The process of quality assurance in the context of a test case
In general, we do this by gradually isolating its code location until we can pinpoint the fault.
Therefore, Agans recommends using a divide and conquer approach (Agans, 2002). To
illustrate this approach, we shall use the test case for the application which measures the
water pollution we introduced in Dection 2: Suppose that the test case reports a failure that
not all sensory data was transmitted to the base station. The cause may lie within the activity
of each sensor node to collect and store the sensory data, or it may lie within the task to
transfer the stored data to the base station. To answer which case is true, we next check if all
sensory data was stored on each sensor node as expected. If this is true, we have to look for
a cause associated to the transmission of the data to the base station. Otherwise (the stored
data is corrupted), the code for collecting and storing the sensory data is faulty. Now, we
have identified the part of the code where we have to look for a fault. If the application
failed to collect and store the sensory data, we may divide the location of the fault again by
asking whether the collection task or the storing task went wrong. In general, we iteratively
divide the code part where the fault is located and thus narrow our focus until we are able
to locate the fault itself.
The process of isolating a fault is a very demanding cognitive task where hypotheses about
the cause of a failure are suggested and verified iteratively (Xu & Rajlich, 2004). We do so
when using the divide and conquer approach by suggesting a hypothesis that will help us –
once verified – to divide the code where the fault is located: In the above example, we may
have suggested the hypothesis that the cause of the failure lies within the activity to collect
and store the sensory data. To verify this hypothesis, we need to gather information on the
data that the sensor nodes actually store. This task to gather information on the behavior of
the faulty application is mandatory to be able to suggest and verify hypotheses. Actually,
information can be gathered by adding log actions to the test case model, which logs the
Emerging Communications for Wireless Sensor Networks54
needed information. Thus, we refine the test case model in order to get more insight on the
cause of the failure reproduced by the test case.
In summary, altering a test case – which is done many times when isolating a fault – would
involve writing and rewriting infrastructure code which is required by the platform
ScatterUnit. This task is completely done by the code generator of Model-Driven Visual
ScatterUnit, which makes the fault isolating process more efficient.
2.3 Model Checking
In order to ensure the generated code’s and with it the test cases’ quality, the test case model
is checked with regard to its syntactic and semantic rules in the form of constraints. This
happens not only before the node script’s test case model is generated, but also during the
modeling of the test case and is called for this reason Live-Validation. As the model
validation is run with the help of openArchitectureWare Framework and as the visual editor
was created with the help of the Graphical Modeling Framework, the components are
combined with the help of the GMF2 Adapters to enable Live-Validation. For this purpose
the visual editor embeds the GMF2 adapter, which allows access to the
openArchitectureWare’s model checking engine. This is repeatedly called to validate the test
case model, which is momentarily being edited, based on the constraints. Figure 10 shows
ScatterClipse’s Architecture regarding the Live-Validation.
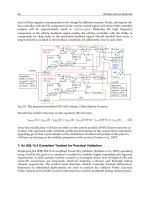
Fig. 10. Live-Validation Components
For instance the command names are used in the generated code’s method names, they are
not allowed to contain any special characters, so that the code can be compiled (see Fig. 11).
context testcase::ControlPath
ERROR "The name must only contain alphabetic and numeric letters." :
this.name.matches("[\\p{Alpha}\\p{Digit}]*");
A large number of syntactic rules can be compiled, but the true use of model validation
unfurls when checking for semantic rules. For instance as it is defined that a test case model
models a course of the test case, it is therefore sensible to check (see Fig. 12), if the test case
model consists of a linear sequence of commands:
context testcase::ControlPath
ERROR "A control path must have one incoming link." :
this.incoming.size == 1;
context testcase::ControlPath
ERROR "A control path must have at maximum one outgoing
link." : this.outgoing.size <= 1;
Fig. 11. Live-Validation detected an invalid name
Fig. 12. Live-Validation detected a control path with no predecessor
Overall the model validation secures the quality of the executable test case and increases
with it the robustness of the test case development. Furthermore the Live- Validation shows
mistakes during the test case modeling, so that the user can correct them in a timely fashion.
3. Development Track
ScatterFactory (Al Saad et al., 2007a) – similar to Visual ScatterUnit - is a generative
infrastructure for the model driven development of software for the Embedded sensor
boards of the WSN-Platform ScatterWeb. The chosen architecture centric approach
represents an instance of the Model Driven Development. The goal is the furthermost
automated and standardized production of software system families for the ScatterWeb
sensor boards. For this purpose, a component meta model was developed, which builds a
basis for a complete tool chain, from the model platform all the way to the deployment of
the generated code onto the sensor boards. To model a ScatterWeb network, a domain
specific graphical editor was developed on the basis of the Eclipse Modeling Framework
and the Graphical Modeling Framework. For the examination of static model constraints, a
real time validation was integrated into the editor. The open ArchitectureWare framework
was used for the transformation from models into code. The ScatterFactory framework was
completed with additional components like assistants or flash-components for the automatic
deployment of generated artefacts in an existing network. Our ScatterFactory tool chain was
realized with the Eclipse Framework as a basis.
Automated Testing and Development of WSN Applications 55
needed information. Thus, we refine the test case model in order to get more insight on the
cause of the failure reproduced by the test case.
In summary, altering a test case – which is done many times when isolating a fault – would
involve writing and rewriting infrastructure code which is required by the platform
ScatterUnit. This task is completely done by the code generator of Model-Driven Visual
ScatterUnit, which makes the fault isolating process more efficient.
2.3 Model Checking
In order to ensure the generated code’s and with it the test cases’ quality, the test case model
is checked with regard to its syntactic and semantic rules in the form of constraints. This
happens not only before the node script’s test case model is generated, but also during the
modeling of the test case and is called for this reason Live-Validation. As the model
validation is run with the help of openArchitectureWare Framework and as the visual editor
was created with the help of the Graphical Modeling Framework, the components are
combined with the help of the GMF2 Adapters to enable Live-Validation. For this purpose
the visual editor embeds the GMF2 adapter, which allows access to the
openArchitectureWare’s model checking engine. This is repeatedly called to validate the test
case model, which is momentarily being edited, based on the constraints. Figure 10 shows
ScatterClipse’s Architecture regarding the Live-Validation.
Fig. 10. Live-Validation Components
For instance the command names are used in the generated code’s method names, they are
not allowed to contain any special characters, so that the code can be compiled (see Fig. 11).
context testcase::ControlPath
ERROR "The name must only contain alphabetic and numeric letters." :
this.name.matches("[\\p{Alpha}\\p{Digit}]*");
A large number of syntactic rules can be compiled, but the true use of model validation
unfurls when checking for semantic rules. For instance as it is defined that a test case model
models a course of the test case, it is therefore sensible to check (see Fig. 12), if the test case
model consists of a linear sequence of commands:
context testcase::ControlPath
ERROR "A control path must have one incoming link." :
this.incoming.size == 1;
context testcase::ControlPath
ERROR "A control path must have at maximum one outgoing
link." : this.outgoing.size <= 1;
Fig. 11. Live-Validation detected an invalid name
Fig. 12. Live-Validation detected a control path with no predecessor
Overall the model validation secures the quality of the executable test case and increases
with it the robustness of the test case development. Furthermore the Live- Validation shows
mistakes during the test case modeling, so that the user can correct them in a timely fashion.
3. Development Track
ScatterFactory (Al Saad et al., 2007a) – similar to Visual ScatterUnit - is a generative
infrastructure for the model driven development of software for the Embedded sensor
boards of the WSN-Platform ScatterWeb. The chosen architecture centric approach
represents an instance of the Model Driven Development. The goal is the furthermost
automated and standardized production of software system families for the ScatterWeb
sensor boards. For this purpose, a component meta model was developed, which builds a
basis for a complete tool chain, from the model platform all the way to the deployment of
the generated code onto the sensor boards. To model a ScatterWeb network, a domain
specific graphical editor was developed on the basis of the Eclipse Modeling Framework
and the Graphical Modeling Framework. For the examination of static model constraints, a
real time validation was integrated into the editor. The open ArchitectureWare framework
was used for the transformation from models into code. The ScatterFactory framework was
completed with additional components like assistants or flash-components for the automatic
deployment of generated artefacts in an existing network. Our ScatterFactory tool chain was
realized with the Eclipse Framework as a basis.
Emerging Communications for Wireless Sensor Networks56
ScatterFactory was originally developed for the first generation ScatterWeb platform – eGate
and ESB sensor nodes – and we wanted to keep the advantage of Scatterfactory also for the
second generation ScatterWeb platform - MSB sensor nodes. So we developed
ScatterFactory2, which was modelled on the principles of the original ScatterFactory.
However ScatterFactory2 accommodates now for the innovations and improvements
brought on by the second generation ScatterWeb. ScatterFactory was originally developed
for the first generation ScatterWeb platform – eGate and ESB sensor nodes – and we wanted
to keep the advantage of Scatterfactory also for the second generation ScatterWeb platform -
MSB sensor nodes. So we developed ScatterFactory2, which was modelled on the principles
of the original ScatterFactory. However ScatterFactory2 accommodates now for the
innovations and improvements brought on by the second generation ScatterWeb.
The main difference between the first and second generation ScatterWeb platforms is the
new modular design made up of available firmware, system services and hardware drivers,
instead of the old monolithic design. Every driver and every algorithmic library has been
made available as a library and can be inserted into the run time environment as needed. In
this way only the necessary libraries for an application’s operation need to be inserted.
ScatterWeb’s modular design facilitates the configuration of the run time environment
enormously and thus lends itself to be represented with a model of an application’s run time
environment, created of course with the help of ScatterFactory2. Figure 13 shows a model
that was drawn with the help of ScatterFactory2’s graphical editor.
Fig. 13. Model of the run time environment of two applications
The model represents two applications, each with different run time environments: Both
applications use the libraries scatterweb and CC1020, which represent the system core.
Furthermore the library SD shall also be embedded into their run time environment. This
library is a driver, which allows interaction with the sensor node’s memory card. However
only applications, which allow the management of the memory card’s FAT file systems, also
receive the library FAT. The diagram elements for the libraries SD and FAT consist, apart
from the library’s name, of more details, which allow the configuration of the respective
library. If the library can be configured with ‘Defines‘ (“#define” of the language “C”), then
‘Defines’ value can also be placed into the appropriate model. In the case of the SD library,
caching for the memory card access has been activated. In the case of the FAT library a
search function has been added. These details allow the customization of the individual
libraries to fit the needs of the application. For example the activation or deactivation of the
SD library’s caching makes a big difference: If the caching is activated, then the data access
to the memory card is on average faster. If the caching is deactivated though, then memory
space can be saved, which would otherwise be used for the cache and which usually
requires about ten percent of all main memory. ScatterFactory2 basically generates out of the
model a Make file, which contains the information needed by the translator to insert the
libraries as modelled. In order to use the same modelling and code generation tools as in
ScatterFactory, the same technologies and tools were used here - especially EMF/GMF and
oAW.
3.1 The Integration of Visual ScatterUnit and ScatterFactory2
In the previous examination of the testing process it was assumed that the soon to be tested
application already existed and the preceding application development was ignored. An
important reason though requires that the application development and the testing process
are examined together: An application may need different configurations for different
sensor nodes of the same sensor network. Therefore it needs to be taken into consideration
with which configuration a sensor node modeled in a test case is associated with. For
example it is possible, that not all sensor nodes in a sensor network also have the same
sensors on board. A test case therefore, which simulates sensor measurements, may only
simulate sensor measurements on sensor nodes which actually have these sensors on board.
As the run time configuration needs to be examined, it lends itself to unite Visual
ScatterUnit and ScatterFactory2, because in a sensor network the sensor node’s
configuration can be configured with the help of ScatterFactory2. The aim during the
integration was to associate the sensor node modeled in the test case with the modeled
application, which had its run time environment configured with the help of ScatterFactory2
(see Figure 14).
Fig. 14. Test case within an application
Automated Testing and Development of WSN Applications 57
ScatterFactory was originally developed for the first generation ScatterWeb platform – eGate
and ESB sensor nodes – and we wanted to keep the advantage of Scatterfactory also for the
second generation ScatterWeb platform - MSB sensor nodes. So we developed
ScatterFactory2, which was modelled on the principles of the original ScatterFactory.
However ScatterFactory2 accommodates now for the innovations and improvements
brought on by the second generation ScatterWeb. ScatterFactory was originally developed
for the first generation ScatterWeb platform – eGate and ESB sensor nodes – and we wanted
to keep the advantage of Scatterfactory also for the second generation ScatterWeb platform -
MSB sensor nodes. So we developed ScatterFactory2, which was modelled on the principles
of the original ScatterFactory. However ScatterFactory2 accommodates now for the
innovations and improvements brought on by the second generation ScatterWeb.
The main difference between the first and second generation ScatterWeb platforms is the
new modular design made up of available firmware, system services and hardware drivers,
instead of the old monolithic design. Every driver and every algorithmic library has been
made available as a library and can be inserted into the run time environment as needed. In
this way only the necessary libraries for an application’s operation need to be inserted.
ScatterWeb’s modular design facilitates the configuration of the run time environment
enormously and thus lends itself to be represented with a model of an application’s run time
environment, created of course with the help of ScatterFactory2. Figure 13 shows a model
that was drawn with the help of ScatterFactory2’s graphical editor.
Fig. 13. Model of the run time environment of two applications
The model represents two applications, each with different run time environments: Both
applications use the libraries scatterweb and CC1020, which represent the system core.
Furthermore the library SD shall also be embedded into their run time environment. This
library is a driver, which allows interaction with the sensor node’s memory card. However
only applications, which allow the management of the memory card’s FAT file systems, also
receive the library FAT. The diagram elements for the libraries SD and FAT consist, apart
from the library’s name, of more details, which allow the configuration of the respective
library. If the library can be configured with ‘Defines‘ (“#define” of the language “C”), then
‘Defines’ value can also be placed into the appropriate model. In the case of the SD library,
caching for the memory card access has been activated. In the case of the FAT library a
search function has been added. These details allow the customization of the individual
libraries to fit the needs of the application. For example the activation or deactivation of the
SD library’s caching makes a big difference: If the caching is activated, then the data access
to the memory card is on average faster. If the caching is deactivated though, then memory
space can be saved, which would otherwise be used for the cache and which usually
requires about ten percent of all main memory. ScatterFactory2 basically generates out of the
model a Make file, which contains the information needed by the translator to insert the
libraries as modelled. In order to use the same modelling and code generation tools as in
ScatterFactory, the same technologies and tools were used here - especially EMF/GMF and
oAW.
3.1 The Integration of Visual ScatterUnit and ScatterFactory2
In the previous examination of the testing process it was assumed that the soon to be tested
application already existed and the preceding application development was ignored. An
important reason though requires that the application development and the testing process
are examined together: An application may need different configurations for different
sensor nodes of the same sensor network. Therefore it needs to be taken into consideration
with which configuration a sensor node modeled in a test case is associated with. For
example it is possible, that not all sensor nodes in a sensor network also have the same
sensors on board. A test case therefore, which simulates sensor measurements, may only
simulate sensor measurements on sensor nodes which actually have these sensors on board.
As the run time configuration needs to be examined, it lends itself to unite Visual
ScatterUnit and ScatterFactory2, because in a sensor network the sensor node’s
configuration can be configured with the help of ScatterFactory2. The aim during the
integration was to associate the sensor node modeled in the test case with the modeled
application, which had its run time environment configured with the help of ScatterFactory2
(see Figure 14).
Fig. 14. Test case within an application
Emerging Communications for Wireless Sensor Networks58
In order to make this association the model is supplemented with diagram elements, which
represent test cases. The modeled test cases are connected with the modeled sensor nodes.
The connection indicates which sensor nodes of the test case are mapped onto which
modeled sensor nodes. The modeled test case TestCollectionProcess consists of three node
scripts, whereby the node scripts for the sensor nodes 1 and 2 each run on one sensor node,
which runs the application instance DataSource and the node script for sensor node 3 runs
on one sensor node, which runs the application instance DataSink. If the node script is
generated, one receives for each of the three modelled sensor nodes a Make file. Each Make
file consists of instructions for the compiler, which makes sure that the correct node script is
compiled with the right application instance and the right run time configuration.
4. Management and Monitoring Track
Nowadays apart from text editors, used for editing plain text files, there also exist many
different types of editors, for example for the editing of audio and graphical files and of
course for web pages. The more complex the edited item is, the higher the demand is for
that editor. A good editor should simplify the user’s work a lot. This principle can be
transferred to WSN, which in the current ubiquitous and pervasive computing era plays a
central roll and can be found in more and more areas of application. The challenges
regarding programming, monitoring, managing and troubleshooting of WSN increase
accordingly and with that the challenges for the corresponding tools as well. The
Management Track of the ScatterClipse tool-suit is as an Eclipse based plugin of this
manner, which provides the above mentioned services by illustrative means and in so
doing, allows the user to utilize them interactively and thus to “edit” the WSN. With the
Management plugin’s design we attached great importance to the aspect of human-
computer interfaces for WSN. Tabfolders, which enables easy user navigation, were used to
represent the different features of the Management Plug-in. A supernode can be used as an
alternative to the eGate. A supernode is a sensor board with special software, which offers
the same functionality as an eGate and which is connected to the computer via serial cable.
In this form the supernode can also act as a sink. The Management Plug-in’s tabfolder
oriented design offers the user the possibility of combining individually required features,
so that the collaborating tabfolders function together as a coherent whole. Nevertheless the
user can navigate between them at any time, so that a separation of concerns is ensured. The
following list represents the Management Plug-in’s different features or tabfolders and their
functionality:
1. Connection: manages the connection between eGate or SuperNode and the sensor boards.
2. Property: manages the graphical representation of the sensors’ status.
3. Terminal: receives and displays information. The user can enter commands in order to
configure or control the sensor boards as well as the eGate.
4. Over The Air Flashing: flashes a selected code image Over the Air to the chosen sensor
boards and also allows that deployed sensor boards can receive their software updates.
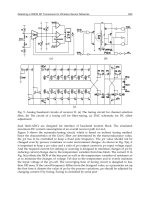
4.1 Connection
Given that the software that runs on the sensor boards is written entirely in the
programming language C and given that the Eclipse Framework is written in Java, it has
become necessary to develop a bridge between the two systems. This objective is achieved
by a ScatterWeb library for Java that is used to model the ScatterWeb platform into an object
oriented paradigm on the basis of the language Java. Thus the communication in both
directions between any Java based system and any ScatterWeb WSN, which has been
deployed in the real world, is ensured. The connection is made uncomplicatedly by the
method eGate.connect() using the javax.comm. Library. The serial port and its
corresponding input and output data streams are determined by the parameter names (like
Nr. of the COM Port) assigned to the method. Messages are sent to the network, which are
necessary for its initialization, and the connection is made.
Figure 15 shows a screenshot of our connection window, through which the connection to
the WSN is established, whereupon its components (eGate and all sensor boards) are
determined. Firstly the communication type is selected (1). If the local communication type
is chosen, the computer connects with the sensors via eGate or supernode. If the remote
communication type is chosen, the computer connects as a client with the sensors through
the server. When the local communication type is in use the user can determine if
communication with the sensors via eGate or supernode is desired (2). In the next step the
user selects the COM port’s number (3), through which shall be communicated. If this
computer acts as a server, then the other clients in the network can also access the sensors. If
the local terminal is chosen, then the sensor data will only be shown on the local computer.
If the remote terminal is chosen, then the sensor data is shown on the client computers (4).
Information regarding the connection to the WSN (like connect time, sensor ID and sensor
type) is shown in a table (5). All information of the sensors is stored in the background to
memory. The connection is established and disconnected with a mouse click (6) and the
WSN can be scanned again (7). Upon starting the Management Plug-in only the connection
tabfolder can be seen. The remaining tabfolders are only shown after the connection with a
port was successful and after the scanning of the WSN. This contributes to the clarity and
eases the interaction with the user.
Fig. 15. Connection Tabfolder
Automated Testing and Development of WSN Applications 59
In order to make this association the model is supplemented with diagram elements, which
represent test cases. The modeled test cases are connected with the modeled sensor nodes.
The connection indicates which sensor nodes of the test case are mapped onto which
modeled sensor nodes. The modeled test case TestCollectionProcess consists of three node
scripts, whereby the node scripts for the sensor nodes 1 and 2 each run on one sensor node,
which runs the application instance DataSource and the node script for sensor node 3 runs
on one sensor node, which runs the application instance DataSink. If the node script is
generated, one receives for each of the three modelled sensor nodes a Make file. Each Make
file consists of instructions for the compiler, which makes sure that the correct node script is
compiled with the right application instance and the right run time configuration.
4. Management and Monitoring Track
Nowadays apart from text editors, used for editing plain text files, there also exist many
different types of editors, for example for the editing of audio and graphical files and of
course for web pages. The more complex the edited item is, the higher the demand is for
that editor. A good editor should simplify the user’s work a lot. This principle can be
transferred to WSN, which in the current ubiquitous and pervasive computing era plays a
central roll and can be found in more and more areas of application. The challenges
regarding programming, monitoring, managing and troubleshooting of WSN increase
accordingly and with that the challenges for the corresponding tools as well. The
Management Track of the ScatterClipse tool-suit is as an Eclipse based plugin of this
manner, which provides the above mentioned services by illustrative means and in so
doing, allows the user to utilize them interactively and thus to “edit” the WSN. With the
Management plugin’s design we attached great importance to the aspect of human-
computer interfaces for WSN. Tabfolders, which enables easy user navigation, were used to
represent the different features of the Management Plug-in. A supernode can be used as an
alternative to the eGate. A supernode is a sensor board with special software, which offers
the same functionality as an eGate and which is connected to the computer via serial cable.
In this form the supernode can also act as a sink. The Management Plug-in’s tabfolder
oriented design offers the user the possibility of combining individually required features,
so that the collaborating tabfolders function together as a coherent whole. Nevertheless the
user can navigate between them at any time, so that a separation of concerns is ensured. The
following list represents the Management Plug-in’s different features or tabfolders and their
functionality:
1. Connection: manages the connection between eGate or SuperNode and the sensor boards.
2. Property: manages the graphical representation of the sensors’ status.
3. Terminal: receives and displays information. The user can enter commands in order to
configure or control the sensor boards as well as the eGate.
4. Over The Air Flashing: flashes a selected code image Over the Air to the chosen sensor
boards and also allows that deployed sensor boards can receive their software updates.
4.1 Connection
Given that the software that runs on the sensor boards is written entirely in the
programming language C and given that the Eclipse Framework is written in Java, it has
become necessary to develop a bridge between the two systems. This objective is achieved
by a ScatterWeb library for Java that is used to model the ScatterWeb platform into an object
oriented paradigm on the basis of the language Java. Thus the communication in both
directions between any Java based system and any ScatterWeb WSN, which has been
deployed in the real world, is ensured. The connection is made uncomplicatedly by the
method eGate.connect() using the javax.comm. Library. The serial port and its
corresponding input and output data streams are determined by the parameter names (like
Nr. of the COM Port) assigned to the method. Messages are sent to the network, which are
necessary for its initialization, and the connection is made.
Figure 15 shows a screenshot of our connection window, through which the connection to
the WSN is established, whereupon its components (eGate and all sensor boards) are
determined. Firstly the communication type is selected (1). If the local communication type
is chosen, the computer connects with the sensors via eGate or supernode. If the remote
communication type is chosen, the computer connects as a client with the sensors through
the server. When the local communication type is in use the user can determine if
communication with the sensors via eGate or supernode is desired (2). In the next step the
user selects the COM port’s number (3), through which shall be communicated. If this
computer acts as a server, then the other clients in the network can also access the sensors. If
the local terminal is chosen, then the sensor data will only be shown on the local computer.
If the remote terminal is chosen, then the sensor data is shown on the client computers (4).
Information regarding the connection to the WSN (like connect time, sensor ID and sensor
type) is shown in a table (5). All information of the sensors is stored in the background to
memory. The connection is established and disconnected with a mouse click (6) and the
WSN can be scanned again (7). Upon starting the Management Plug-in only the connection
tabfolder can be seen. The remaining tabfolders are only shown after the connection with a
port was successful and after the scanning of the WSN. This contributes to the clarity and
eases the interaction with the user.
Fig. 15. Connection Tabfolder
Emerging Communications for Wireless Sensor Networks60
4.2. Property
After the connection to the WSN has been established, it is possible to examine the
properties of the sensor boards as well as of the eGate. The task of the program section
“property” is of graphical representation of the sensor status. Every important sensor state is
illustrated “on the fly” and can be configured and controlled through a transparent user
interaction. Depending on the sensor’s properties, functions can be activated or deactivated,
and data, for example the temperature of the sensor’s environment, can be shown in this
tabfolder. The property tabfolder’s visual oriented design is an example for how the aspect
of human-computer interfaces for ScatterWeb-WSN is realised. Figure 16 shows a screenshot
of property tabfolders. Firstly the user selects a sensor (1). The user updates the list of
available sensors by pressing the refresh button and all available sensors are listed in the
pull-down menu. In our example we chose the sensor with the ID 8. The IDs can be changed
in the field “change sensor ID” (2). If applicable, information concerning the eGate or the
supernode is shown (3). The LED’s control panel on the sensor (4) can be switched on or off
by pressing the appropriate button. The sensor can be restarted (reset) with the restart
button, just as the beeper (6). The configuration of the Announce-Flags Serial and Radio (7)
as well as the configuration of the Firmware-Flags Programmable and DCO-Checker (8) can
be read out and changed. The data from the different measurements (like temperature,
volume, movement and vibration) in the sensing field are shown (9). Also shown are the
values for Transmit Power and Receive Limit (10), as well as the status of the battery voltage
and the optional external power supply (11).
Fig. 16. Property Tabfolder
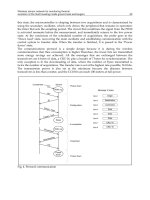
4.3. Terminal
The terminal offers an easy approach to configure and control the sensor boards through the
eGate (see in fig. 17 a screenshot of our Terminal View). This is achieved by the input of
terminal commands, which have a specific, but easy, format. In so doing the user can
interactively operate the sensor boards. The following example demonstrates how terminal
commands look and how they are used: @21 stp 99. The ID of the addressed sensor board
always follows the @ character. If the @, and in so being also the ID, is missing, then the
command refers to the eGate. After this the instruction follows. stp stands for set
transmission power. Certain commands expect parameters like the command in the example
above. In this case 99 stands for the transmission power.
If the commands are sent over the eGate, then they are sent in the form of a text with the
help of Javax.comm library through the COM port to the eGate. The received string is then
parsed by a specific parsing module in the eGate and interpreted. After this the interpreted
string is processed by creating a package, which corresponds to the command, and sending
it over the Air to the sensor board. The functionality of every terminal command is
implemented by a C macro on the sensor’s C level. With this one can flexibly define
individual terminal commands and have them carried out by the corresponding
implementation on the C level. This eases the conducting of experiments, as well as testing
and debugging of newly implemented functions. The top output window (1) in Figure 24
shows the response of the queried sensor board. When the first letter of a command is
pressed a list of commands appears above the command line (4) with the same starting letter
and these commands are taken on in the command line when they are clicked on.
Fig. 17. Terminal Tabfolder
Automated Testing and Development of WSN Applications 61
4.2. Property
After the connection to the WSN has been established, it is possible to examine the
properties of the sensor boards as well as of the eGate. The task of the program section
“property” is of graphical representation of the sensor status. Every important sensor state is
illustrated “on the fly” and can be configured and controlled through a transparent user
interaction. Depending on the sensor’s properties, functions can be activated or deactivated,
and data, for example the temperature of the sensor’s environment, can be shown in this
tabfolder. The property tabfolder’s visual oriented design is an example for how the aspect
of human-computer interfaces for ScatterWeb-WSN is realised. Figure 16 shows a screenshot
of property tabfolders. Firstly the user selects a sensor (1). The user updates the list of
available sensors by pressing the refresh button and all available sensors are listed in the
pull-down menu. In our example we chose the sensor with the ID 8. The IDs can be changed
in the field “change sensor ID” (2). If applicable, information concerning the eGate or the
supernode is shown (3). The LED’s control panel on the sensor (4) can be switched on or off
by pressing the appropriate button. The sensor can be restarted (reset) with the restart
button, just as the beeper (6). The configuration of the Announce-Flags Serial and Radio (7)
as well as the configuration of the Firmware-Flags Programmable and DCO-Checker (8) can
be read out and changed. The data from the different measurements (like temperature,
volume, movement and vibration) in the sensing field are shown (9). Also shown are the
values for Transmit Power and Receive Limit (10), as well as the status of the battery voltage
and the optional external power supply (11).
Fig. 16. Property Tabfolder
4.3. Terminal
The terminal offers an easy approach to configure and control the sensor boards through the
eGate (see in fig. 17 a screenshot of our Terminal View). This is achieved by the input of
terminal commands, which have a specific, but easy, format. In so doing the user can
interactively operate the sensor boards. The following example demonstrates how terminal
commands look and how they are used: @21 stp 99. The ID of the addressed sensor board
always follows the @ character. If the @, and in so being also the ID, is missing, then the
command refers to the eGate. After this the instruction follows. stp stands for set
transmission power. Certain commands expect parameters like the command in the example
above. In this case 99 stands for the transmission power.
If the commands are sent over the eGate, then they are sent in the form of a text with the
help of Javax.comm library through the COM port to the eGate. The received string is then
parsed by a specific parsing module in the eGate and interpreted. After this the interpreted
string is processed by creating a package, which corresponds to the command, and sending
it over the Air to the sensor board. The functionality of every terminal command is
implemented by a C macro on the sensor’s C level. With this one can flexibly define
individual terminal commands and have them carried out by the corresponding
implementation on the C level. This eases the conducting of experiments, as well as testing
and debugging of newly implemented functions. The top output window (1) in Figure 24
shows the response of the queried sensor board. When the first letter of a command is
pressed a list of commands appears above the command line (4) with the same starting letter
and these commands are taken on in the command line when they are clicked on.
Fig. 17. Terminal Tabfolder
Emerging Communications for Wireless Sensor Networks62
As an assistance the meaning and, where appropriate, the parameters of a clicked on
command are displayed below the command line (5).
4.4. Over The Air Flashing
Mass flashing over the eGate is a little more complex when compared to serial flashing. First
of all a serial connection to the eGate via Java COM Ports is made. For this task we use the
Javax.comn package. Through this the software’s binary image (Hex file) is loaded line for
line into the eGate’s EEPROM. Next the image is sent to all target nodes and at the same
time errors, which have occurred, are listened for on the serial connection to the eGate. If
necessary this will be announced by the respective dialog box. Another challenge lies in
providing the user with the clear and easy interaction possibility with this process, which
would improve the reliability and handling of the OTA flashing component in ScatterEditor.
Figure 18 shows the GUI for OTA flashing as well as the of interaction with the user after the
selection of the Hex file in the relevant folder. As shown in the Connection Tabfolder when
the refresh button is pressed, all sensors within range of the eGate are determined and the
IDs of the sensors are shown in the corresponding window. Scanning the WSN at the
beginning has the effect that only live (non defect) sensor boards come into question for the
OTA flashing process. The selected Hex file (1) is loaded into the eGate’s EEPROM and the
progression of this step is shown to the user by the progress bar (2). During the loading
process the eGate sends its respective messages, which are shown in the window (4). When
the loading process has been completed, the user can insert the IDs of the senor boards,
which should be flashed (3).Thus it is also possible to select several sensors by inserting their
IDs and to flash these at the same time with the same Hex file.
Fig. 18. OTA Flashing Tabfolder
The flashing process begins as soon as the Flash Sensors button is pressed (3). Alternatively
one can also flash the eGate by typing “egate”.
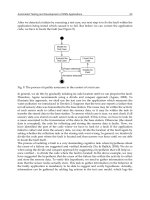
4.5. Internet Integration
Sensor networks are often deployed in areas, to which people normally have only a limited
access, for instance a nature reserve or areas with an extreme climate etc. It stands therefore
to reason to connect the management Plug-in with the internet, in order to offer access to
Plug-ins’s services and features from any, one or more, remote computers (clients). In this
case there would not be an eGate connected to these computers (clients). To solve this
problem the classical client/server approach was followed by using RMI (Remote Method
Invocation, RMI) from Java (see Figure 19). We implemented an eGate server, which runs on
the computer, to which the eGate is connected. This computer takes on the role of a server.
The Server possesses an interface, which contains the methods, which are available to all
clients. Only methods, which are defined on the server, are available to the Client.
The remote function’s security is a vital issue. If one wishes to extend the remote option
further, then it is important that the client’s access rights are clearly defined. That is why the
(server) Management Plug-in provides a generated public key during the first program start.
The administrator is advised to change the key. Clients can not use old keys to access the
server after the key has been changed. The client (user) must be contacted, in order to find
out the new key. The procedure, with which the services of the server can be accessed, is,
from the point of view of the client, as following: The first step in connecting with the server
is the input of the server IP and key. Access to the server will be denied without the correct
key. The key, as mentioned afore, can only be changed on the server side. The second
security feature is the IP address list, which was set up on the server. From the server this
list can be changed, enlarged or deleted at any time.
Fig. 19. Server Configuration
5. Conclusions: Putting It All Together
We presented ScatterClipse a model-driven Eclipse-based toolchain for developing, testing
and managing Wireless Sensor Networks. The high degree of automation accelerates the
development and testing of applications, which are already running on sensor nodes.
Furthermore substitutability and reusability of the software artefacts are increased, because
the artefacts, alongside the automated code generation, are represented by their respective
models. Both increase the development process’s productivity. The model driven code
Automated Testing and Development of WSN Applications 63
As an assistance the meaning and, where appropriate, the parameters of a clicked on
command are displayed below the command line (5).
4.4. Over The Air Flashing
Mass flashing over the eGate is a little more complex when compared to serial flashing. First
of all a serial connection to the eGate via Java COM Ports is made. For this task we use the
Javax.comn package. Through this the software’s binary image (Hex file) is loaded line for
line into the eGate’s EEPROM. Next the image is sent to all target nodes and at the same
time errors, which have occurred, are listened for on the serial connection to the eGate. If
necessary this will be announced by the respective dialog box. Another challenge lies in
providing the user with the clear and easy interaction possibility with this process, which
would improve the reliability and handling of the OTA flashing component in ScatterEditor.
Figure 18 shows the GUI for OTA flashing as well as the of interaction with the user after the
selection of the Hex file in the relevant folder. As shown in the Connection Tabfolder when
the refresh button is pressed, all sensors within range of the eGate are determined and the
IDs of the sensors are shown in the corresponding window. Scanning the WSN at the
beginning has the effect that only live (non defect) sensor boards come into question for the
OTA flashing process. The selected Hex file (1) is loaded into the eGate’s EEPROM and the
progression of this step is shown to the user by the progress bar (2). During the loading
process the eGate sends its respective messages, which are shown in the window (4). When
the loading process has been completed, the user can insert the IDs of the senor boards,
which should be flashed (3).Thus it is also possible to select several sensors by inserting their
IDs and to flash these at the same time with the same Hex file.
Fig. 18. OTA Flashing Tabfolder
The flashing process begins as soon as the Flash Sensors button is pressed (3). Alternatively
one can also flash the eGate by typing “egate”.
4.5. Internet Integration
Sensor networks are often deployed in areas, to which people normally have only a limited
access, for instance a nature reserve or areas with an extreme climate etc. It stands therefore
to reason to connect the management Plug-in with the internet, in order to offer access to
Plug-ins’s services and features from any, one or more, remote computers (clients). In this
case there would not be an eGate connected to these computers (clients). To solve this
problem the classical client/server approach was followed by using RMI (Remote Method
Invocation, RMI) from Java (see Figure 19). We implemented an eGate server, which runs on
the computer, to which the eGate is connected. This computer takes on the role of a server.
The Server possesses an interface, which contains the methods, which are available to all
clients. Only methods, which are defined on the server, are available to the Client.
The remote function’s security is a vital issue. If one wishes to extend the remote option
further, then it is important that the client’s access rights are clearly defined. That is why the
(server) Management Plug-in provides a generated public key during the first program start.
The administrator is advised to change the key. Clients can not use old keys to access the
server after the key has been changed. The client (user) must be contacted, in order to find
out the new key. The procedure, with which the services of the server can be accessed, is,
from the point of view of the client, as following: The first step in connecting with the server
is the input of the server IP and key. Access to the server will be denied without the correct
key. The key, as mentioned afore, can only be changed on the server side. The second
security feature is the IP address list, which was set up on the server. From the server this
list can be changed, enlarged or deleted at any time.
Fig. 19. Server Configuration
5. Conclusions: Putting It All Together
We presented ScatterClipse a model-driven Eclipse-based toolchain for developing, testing
and managing Wireless Sensor Networks. The high degree of automation accelerates the
development and testing of applications, which are already running on sensor nodes.
Furthermore substitutability and reusability of the software artefacts are increased, because
the artefacts, alongside the automated code generation, are represented by their respective
models. Both increase the development process’s productivity. The model driven code
Emerging Communications for Wireless Sensor Networks64
generation is used to furthermore generate a largely tailor made code, so that only the
required amount of code is generated for the sensor node’s intended roll. Thus the scarce
memory space is not only optimized, but also unnecessary calculating and energy intensive
software modules are avoided. The decreased portion of manually written code also reduces
the possibility of a programmer’s careless mistakes. However if the same code had been
written manually, then a bug would be more probable. Such a bug results in the test case
being defect, which is highly undesirable. This is why the use of a model-driven test
environment gives a certain robustness against bugs made during the development of the
test case. The model validation also makes a large contribution towards robustness by
discovering certain bugs early on, which, if manually implemented, would only be
discovered very late in the process.
Hence, several tasks of implementing an a test case and detecting a bug are delegated to the
code generator. This is beneficial because these tasks are complex and time-consuming.
Rather than performing these tasks himself, the user who tests a WSN application can
concentrate on more important matters: Regarding the implementation that is the design of
the test scenario; in case of the detection of a bug, that is the decision on an appropriate
refinement of the test case to verify a hypothesis. A contribution that could be of general
interest is our approach to incorporate the test results into formal models in the context of
the Model-Driven paradigm. In so doing models are enhanced with the results of the test
process, a method which is practical in other domains as well.
Apart from the interconnection between IP and ScatterClipse, another focus of the tool-suit
lies with the aspect of human-computer interfaces for WSN. ScatterClipse provides the
opportunity to manage and monitor different characteristics and properties of WSN
illustratively and interactively. Since the tool-chain is based on Eclipse, it offers a plug-in
oriented architecture and is comprised of free open source components. The tool’s plug-in
oriented architecture increases the adaptability for the end user and eases the updating of
components. Furthermore the open architecture simplifies the tool’s expansion, which
increases the system’s level of interoperability and flexibility.
Thus ScatterClipse is comprised of many tools for the development and operation of WSN
applications, which offer a wide spectrum of functionality. This functionality can be used
with the help of wizards, editors, views and menu items. However these can only be
accessed from many different locations within Eclipse. Hence the user has been missing an
overview of the total functionality at his disposal. In order to give the user this overview
and a chance to directly access the functionality we developed an Eclipse view called
ScatterClipse Assembly Line, which allows the access of all of ScatterClipse’s functionality
from one central location (see Figure 20).
Development: The Development stage allows access to all of ScatterFactory2’s functions.
With the first step a wizard is opened, which creates a model file or opens an already
existing model file, which then can be used for modelling. The next step activates the code
generation. First a project is chosen, in which code should be generated, and then the code
generation is activated as pertaining to the model file chosen during the first step.
Testing: The Testing stage allows access to all functions of Visual ScatterUnit and
ScatterUnit. Similar to the last stage the first two steps revolve around creating and editing a
model file and the generation of test case code. During the third step a portion of test case
code (code that will be executed on a sensor node) can be chosen, compiled and then
installed onto a sensor node. During the final step, after all portions of test case code have
been installed onto their respective sensor nodes, the test case can be run and the newly
created resolution minutes loaded, so that the test results can be visualised in the test case
model.
Deployment: The Development stage allows the application’s installation and flashing onto
the sensor nodes, not for testing purposes, but for actual service. This stage represents the
transition between application development and application operation. Furthermore it has
been taken into account that applications can be comprised of different parts. These
application parts were modelled within the Development stage with the help of
ScatterFactory2 and can be individually selected during this stage.
Troubleshooting and Configuration: The Sensor Network can be depicted by using the
proper wizards and opening the respective file. Furthermore views supplied by Plugins
regarding WSN Management and Monitoring can be opened directly. One is for instance the
Terminal-View, which allows Configuration Commands to be sent directly to the sensor
nodes.
Resulting from the collaboration between the several frameworks the user can, for example
conduct model-driven software testing and development for the sensors with
ScatterFactory2 and Visual ScatterUnit, while concurrently he can configure, control and
carry out OTA software updates of the sensors with the support of the Management Plug-in
and that not only locally but also remotely via the internet.
Overall the ScatterClipse Assembly Line represents the power of the tool chain, gives the
user an overview of the available functionalities and facilitates the access of them.
Furthermore the ease of access motivates using all tools from ScatterClipse in symbioses.
This open architecture also eases the appropriate enhancement of the platform in response
to newly arisen questions regarding WSN. A screen-cast of ScatterClipse can be found under
(ScatterClipse).
Fig. 20. The ScatterClipse Assembly Line
Automated Testing and Development of WSN Applications 65
generation is used to furthermore generate a largely tailor made code, so that only the
required amount of code is generated for the sensor node’s intended roll. Thus the scarce
memory space is not only optimized, but also unnecessary calculating and energy intensive
software modules are avoided. The decreased portion of manually written code also reduces
the possibility of a programmer’s careless mistakes. However if the same code had been
written manually, then a bug would be more probable. Such a bug results in the test case
being defect, which is highly undesirable. This is why the use of a model-driven test
environment gives a certain robustness against bugs made during the development of the
test case. The model validation also makes a large contribution towards robustness by
discovering certain bugs early on, which, if manually implemented, would only be
discovered very late in the process.
Hence, several tasks of implementing an a test case and detecting a bug are delegated to the
code generator. This is beneficial because these tasks are complex and time-consuming.
Rather than performing these tasks himself, the user who tests a WSN application can
concentrate on more important matters: Regarding the implementation that is the design of
the test scenario; in case of the detection of a bug, that is the decision on an appropriate
refinement of the test case to verify a hypothesis. A contribution that could be of general
interest is our approach to incorporate the test results into formal models in the context of
the Model-Driven paradigm. In so doing models are enhanced with the results of the test
process, a method which is practical in other domains as well.
Apart from the interconnection between IP and ScatterClipse, another focus of the tool-suit
lies with the aspect of human-computer interfaces for WSN. ScatterClipse provides the
opportunity to manage and monitor different characteristics and properties of WSN
illustratively and interactively. Since the tool-chain is based on Eclipse, it offers a plug-in
oriented architecture and is comprised of free open source components. The tool’s plug-in
oriented architecture increases the adaptability for the end user and eases the updating of
components. Furthermore the open architecture simplifies the tool’s expansion, which
increases the system’s level of interoperability and flexibility.
Thus ScatterClipse is comprised of many tools for the development and operation of WSN
applications, which offer a wide spectrum of functionality. This functionality can be used
with the help of wizards, editors, views and menu items. However these can only be
accessed from many different locations within Eclipse. Hence the user has been missing an
overview of the total functionality at his disposal. In order to give the user this overview
and a chance to directly access the functionality we developed an Eclipse view called
ScatterClipse Assembly Line, which allows the access of all of ScatterClipse’s functionality
from one central location (see Figure 20).
Development: The Development stage allows access to all of ScatterFactory2’s functions.
With the first step a wizard is opened, which creates a model file or opens an already
existing model file, which then can be used for modelling. The next step activates the code
generation. First a project is chosen, in which code should be generated, and then the code
generation is activated as pertaining to the model file chosen during the first step.
Testing: The Testing stage allows access to all functions of Visual ScatterUnit and
ScatterUnit. Similar to the last stage the first two steps revolve around creating and editing a
model file and the generation of test case code. During the third step a portion of test case
code (code that will be executed on a sensor node) can be chosen, compiled and then
installed onto a sensor node. During the final step, after all portions of test case code have
been installed onto their respective sensor nodes, the test case can be run and the newly
created resolution minutes loaded, so that the test results can be visualised in the test case
model.
Deployment: The Development stage allows the application’s installation and flashing onto
the sensor nodes, not for testing purposes, but for actual service. This stage represents the
transition between application development and application operation. Furthermore it has
been taken into account that applications can be comprised of different parts. These
application parts were modelled within the Development stage with the help of
ScatterFactory2 and can be individually selected during this stage.
Troubleshooting and Configuration: The Sensor Network can be depicted by using the
proper wizards and opening the respective file. Furthermore views supplied by Plugins
regarding WSN Management and Monitoring can be opened directly. One is for instance the
Terminal-View, which allows Configuration Commands to be sent directly to the sensor
nodes.
Resulting from the collaboration between the several frameworks the user can, for example
conduct model-driven software testing and development for the sensors with
ScatterFactory2 and Visual ScatterUnit, while concurrently he can configure, control and
carry out OTA software updates of the sensors with the support of the Management Plug-in
and that not only locally but also remotely via the internet.
Overall the ScatterClipse Assembly Line represents the power of the tool chain, gives the
user an overview of the available functionalities and facilitates the access of them.
Furthermore the ease of access motivates using all tools from ScatterClipse in symbioses.
This open architecture also eases the appropriate enhancement of the platform in response
to newly arisen questions regarding WSN. A screen-cast of ScatterClipse can be found under
(ScatterClipse).
Fig. 20. The ScatterClipse Assembly Line
Emerging Communications for Wireless Sensor Networks66
6. References
Agans, D. J. (2002). Debugging: The 9 Indispensable Rules for Finding Even the Most
Elusive Software and Hardware Problems, Amacom, ISBN 0-8144-7168-4, New
York.
Akyildiz, I. F.; Su, W.; Sankarasubramaniam, Y. & Cayirci, E. (2002). Wireless sensor
networks: a Survey. Computer Networks, Vol. 38 No. 4 (2002), pp. 393–422
Al Saad, M., Hentrich, B. & Schiller, J. (2007a). ScatterFactory: An Architecture Centric
Framework for Wireless Sensor Networks, Proceedings of the International
Conference on New Technologies, Mobility and Security, pp. 12-31, ISBN 978-1-
4020-6269-8, May 2007, Paris, Springer, Netherlands
Al Saad, M., Ding, J. & Schiller, J. (2007b). ScatterEditor: An Eclipse Based Tool for
Programming, Testing and Managing Wireless Sensor Networks, Proceedings of
the International Conference on Sensor Technologies and Applications, pp. 441-450,
ISBN 978-0-7695-2988-2, October 2007, Valencia, Spain, IEEE CS Press
Al Saad, M.; Kamenzky, N. & Schiller, J. (2008a). Visual ScatterUnit: A Visual Model Driven
Testing Framework of Wireless Sensor Networks Applications, Proceedings of
ACM/IEEE 11th International Conference on Model Driven Engineering
Languages and Systems, pp. 751-765, ISBN 978-3-540-87874-2, September/October
2008, Toulouse, France, LNCS Springer
Al Saad, M.; Fehr, E.; Kamenzky, N.; & Schiller, J. (2008b). ScatterClipse: A Model-Driven
Tool-Chain for Developing, Testing, and Prototyping Wireless Sensor Networks,
Proceedings of 6th IEEE International Symposium on Parallel and Distributed
Processing and Applications, pp. 871-885, ISBN 978-0-7695-3471-8, Sydney,
Australia, IEEE CS Press
Blumenthal, J.; Handy, M. & Timmermann D. (2004). Senets - test and validation
environment for applications in large-scale wireless sensor networks, Proceedings
of the 2nd IEEE Int. Con. on Industrial Informatics, pp. 69-73, ISBN 0-7803-8513-6,
Berlin, Germany, June 2004, IEEE CS Press
Cunha, J. C.; Loureno J. & Duarte V. (2001). Debugging of parallel and distributed programs,
In: Parallel program development for cluster computing: methodology, tools and
integrated environments, Cunha, J.C.; Kacsuk, P. & Winter, S. C. (Eds.) pp. 97-129,
Nova Science Pub. ISBN 978-1560728658, New York
Eisenecker U. & Czarnecki, K. (2000). Generative Programming. Addison-Wesley Longman,
ISBN 978-0201309775, Amsterdam
GMF,
oAW,
Rafiq O. & Cacciari, L. (2003). Coordination algorithm for distributed testing. Journal of
Supercomputing, Vol. 24 , No. 2 (February 2003), pp. 203-211, ISSN 0920-8542
ScatterClipse,
ScatterWeb,
Remote Invocation Method,
index.jsp
Schiller, J.; Liers, A. & H. Ritter (2005). ScatterWeb: A wireless Sensornet Platform for
Research and Teaching.Computer Communications, Vol. 28 (2005) pp. 1545-1551
Stahl, T.; Voelter M. & Czarnecki, K. (2006). Model-Driven Software Development:
Technology, Engineering, Management, Wiley, ISBN 978-0470025703, Hoboken,
New Jersey, USA
Ulrich, A. W.; Zimmerer, P. & Chrobok-Diening G. (1999). Test architectures for testing
distributed systems, Proceedings of the 12th Int. Software Quality Week, pp. 24-26,
San Jose, California, USA, May 1999
Xu S. & Rajlich, V. (2004). Cognitive process during program debugging, Proceedings of the
3rd IEEE Int. Conference on Cognitive Informatics, pp. 176-182, ISBN 0-7695-2190-
8,Victoria, Canada, August 2004, IEEE Computer Society, Washington, DC, USA
Automated Testing and Development of WSN Applications 67
6. References
Agans, D. J. (2002). Debugging: The 9 Indispensable Rules for Finding Even the Most
Elusive Software and Hardware Problems, Amacom, ISBN 0-8144-7168-4, New
York.
Akyildiz, I. F.; Su, W.; Sankarasubramaniam, Y. & Cayirci, E. (2002). Wireless sensor
networks: a Survey. Computer Networks, Vol. 38 No. 4 (2002), pp. 393–422
Al Saad, M., Hentrich, B. & Schiller, J. (2007a). ScatterFactory: An Architecture Centric
Framework for Wireless Sensor Networks, Proceedings of the International
Conference on New Technologies, Mobility and Security, pp. 12-31, ISBN 978-1-
4020-6269-8, May 2007, Paris, Springer, Netherlands
Al Saad, M., Ding, J. & Schiller, J. (2007b). ScatterEditor: An Eclipse Based Tool for
Programming, Testing and Managing Wireless Sensor Networks, Proceedings of
the International Conference on Sensor Technologies and Applications, pp. 441-450,
ISBN 978-0-7695-2988-2, October 2007, Valencia, Spain, IEEE CS Press
Al Saad, M.; Kamenzky, N. & Schiller, J. (2008a). Visual ScatterUnit: A Visual Model Driven
Testing Framework of Wireless Sensor Networks Applications, Proceedings of
ACM/IEEE 11th International Conference on Model Driven Engineering
Languages and Systems, pp. 751-765, ISBN 978-3-540-87874-2, September/October
2008, Toulouse, France, LNCS Springer
Al Saad, M.; Fehr, E.; Kamenzky, N.; & Schiller, J. (2008b). ScatterClipse: A Model-Driven
Tool-Chain for Developing, Testing, and Prototyping Wireless Sensor Networks,
Proceedings of 6th IEEE International Symposium on Parallel and Distributed
Processing and Applications, pp. 871-885, ISBN 978-0-7695-3471-8, Sydney,
Australia, IEEE CS Press
Blumenthal, J.; Handy, M. & Timmermann D. (2004). Senets - test and validation
environment for applications in large-scale wireless sensor networks, Proceedings
of the 2nd IEEE Int. Con. on Industrial Informatics, pp. 69-73, ISBN 0-7803-8513-6,
Berlin, Germany, June 2004, IEEE CS Press
Cunha, J. C.; Loureno J. & Duarte V. (2001). Debugging of parallel and distributed programs,
In: Parallel program development for cluster computing: methodology, tools and
integrated environments, Cunha, J.C.; Kacsuk, P. & Winter, S. C. (Eds.) pp. 97-129,
Nova Science Pub. ISBN 978-1560728658, New York
Eisenecker U. & Czarnecki, K. (2000). Generative Programming. Addison-Wesley Longman,
ISBN 978-0201309775, Amsterdam
GMF,
oAW,
Rafiq O. & Cacciari, L. (2003). Coordination algorithm for distributed testing. Journal of
Supercomputing, Vol. 24 , No. 2 (February 2003), pp. 203-211, ISSN 0920-8542
ScatterClipse,
ScatterWeb,
Remote Invocation Method,
index.jsp
Schiller, J.; Liers, A. & H. Ritter (2005). ScatterWeb: A wireless Sensornet Platform for
Research and Teaching.Computer Communications, Vol. 28 (2005) pp. 1545-1551
Stahl, T.; Voelter M. & Czarnecki, K. (2006). Model-Driven Software Development:
Technology, Engineering, Management, Wiley, ISBN 978-0470025703, Hoboken,
New Jersey, USA
Ulrich, A. W.; Zimmerer, P. & Chrobok-Diening G. (1999). Test architectures for testing
distributed systems, Proceedings of the 12th Int. Software Quality Week, pp. 24-26,
San Jose, California, USA, May 1999
Xu S. & Rajlich, V. (2004). Cognitive process during program debugging, Proceedings of the
3rd IEEE Int. Conference on Cognitive Informatics, pp. 176-182, ISBN 0-7695-2190-
8,Victoria, Canada, August 2004, IEEE Computer Society, Washington, DC, USA
Emerging Communications for Wireless Sensor Networks68
A Survey of Low Duty Cycle MAC Protocols in Wireless Sensor Networks 69
A Survey of Low Duty Cycle MAC Protocols in Wireless Sensor Networks
M. Riduan Ahmad, Eryk Dutkiewicz and Xiaojing Huang
X
A Survey of Low Duty Cycle MAC
Protocols in Wireless Sensor Networks
M. Riduan Ahmad
1
, Eryk Dutkiewicz
2
and Xiaojing Huang
3
1
Universiti Teknikal Malaysia Melaka,
2
Macquarie University,
3
CSIRO ICT Centre
1
Malaysia,
2,3
Australia
1. Introduction
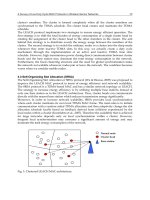
This chapter examines various important low duty cycle MAC protocols and the two most
important MAC protocols designed specifically for cooperative Multiple-Input Multiple-
Output (MIMO) transmission. In most cases, the low duty cycle MAC protocols trade off
latency for energy efficient operation. Also, we can observe later that asynchronous MAC
protocols are more scalable than synchronous MAC protocols.
On the one hand, when sensor nodes join or leave a group or a cluster, the MAC needs to re-
synchronise the network over and over in such protocols as LEACH and S-MAC. Frequent
re-synchronisation can lead to higher energy consumption. The situation becomes more
complex when global synchronisation is required instead of local synchronisation. Thus a
balance must be made between frequent synchronisation and scalability in synchronous
MAC protocol design. On the other hand, in some cases with asynchronous MAC, the
higher scalability comes at the cost of higher transmission energy due to the implementation
of a long preamble and overhearing in such protocols as RF Wake-up and B-MAC.
However, the burden of long preamble transmission is reduced gradually by the
introduction of short packet techniques such in SpeckMAC and X-MAC. Moreover, it is
important to note that little attention has been paid to increasing the link reliability in SISO
systems. The only mechanism used is the ACK packet feedback in protocols such IEEE
802.15.4 MAC and WiseMAC.
The MIMO-LEACH and CMAC
ON
protocols provide measures to increase link reliability
and at the same time reduce transmission power by exploiting spatial diversity gain. On the
one hand, the MIMO-LEACH protocol employs a duty cycle mechanism through TDMA
time slots assignments which reduces the total energy consumption. Furthermore, multi-
hop communication between cluster heads is introduced to replace the direct
communication which reduces further the total energy consumption. Also, collisions can be
avoided with the distinct time slot assignment to each sensor node. The benefits come at the
cost of higher latency (multi-hop communication). In addition, the scalability issue is not
addressed at all.
CMAC
ON
is more scalable and does not require pre-selection of cooperative nodes.
CMAC
ON
does not suffer from tight synchronisation and overhead of cluster formation.
Also, collision avoidance is provided through RTS-CTS signalling. Moreover, an ACK
5
Emerging Communications for Wireless Sensor Networks70
mechanism is used as a double measure of link reliability. However, we note that all the
sensor nodes are always on which makes the issues of idle listening and overhearing still
need to be addressed. The CMAC
ON
protocol should deploy a duty cycle mechanism to
reduce further the total energy consumption. Also, circuit energy must be included to get a
better picture of the overall energy usage in the network.
The comparative study in this chapter provides a basis for further study to design an
improved version of the CMAC
ON
protocol which employs a low duty cycle mechanism in
cooperative MIMO communication. The improved MAC will be evaluated with a set of
cooperative MIMO systems in terms of energy efficient operation and its trade-off
relationship with packet latency.
The rest of the chapter is organized as follows. The concept of a low duty cycle is introduced
in Section 2 to provide a basis of energy efficient MAC operation. We examine state-of-the-
art duty cycle MAC protocols in Sections 3 and 4. We classify these protocols into
synchronous and asynchronous. In Section 5, we explore existing MAC protocols designed
specifically for cooperative Multiple-Input Multiple-Output (MIMO) transmissions. Finally
the chapter is concluded in Section 6.
2. Low Duty Cycle Concepts
The basic idea of low duty cycle protocols is to reduce the time a node is idle or spends
overhearing an unnecessary activity by putting the node in the sleep state. The most ideal
condition of low duty cycle protocols is when a node is a sleep most of the time and wakes
up only when to transmit or receive packets. In the literature, the concept of a low duty
cycle is represented as a periodic wake-up scheme. A node wakes up periodically to
transmit or receive packets from other nodes. Usually after a node wakes up, it listens to the
channel for any activity before transmitting or receiving packets. If no packet is to be
transmitted or received, the node returns to the sleep state. A whole cycle consisting of a
sleep period and a listening period is called a sleep/wake-up period and is depicted in
Figure 1.
Duty cycle is measured as the ratio of the listening period length to the wake-up period
length which gives an indicator of how long a node spends in the listening period. A small
duty cycle means that a node is asleep most of the time in order to avoid idle listening and
overhearing. However, a balanced duty cycle size must be achieved in order to avoid higher
latency and higher transient energy due to start-up costs.
There are various low duty cycle protocols proposed for WSNs which differ in aspects of
synchronisation, the number of channels required, transmitter- or receiver-initiated
operation etc. (Karl & Willig, 2007). We categorise the low duty cycle protocols into two
major classes: namely synchronous and asynchronous schemes. The concept of
synchronisation is related with data exchanges in WSNs (Kuorilehto et al., 2007). In
asynchronous schemes, there are two basic approaches, namely transmitter-initiated and
receiver-initiated. Using a transmitter-initiated approach, a node sends frequent request
packets (preamble, control or even data packet themselves) until one of them "hits" the
listening period of the destination node. On the other hand, the receiver-initiated approach
is applicable when a node sends frequent packets (preamble, control, acknowledgment) to
inform the neighbouring nodes about the willingness of the node to receive packets. The
former approach puts the energy cost on the transmitter while the latter moves the cost to
the receiver.
Another variation of low duty cycle protocols is a synchronous scheme where all the nodes
in a group or cluster have the same wake-up phase. Usually each node sends frequent
beacon frames to inform its neighbours about its wake-up cycle schedule and other
information such as pending packets to be transmitted, etc. Thus a node schedules its
transmission and reception time from the information obtained from the beacon frames. In
another approach, a node becomes a group or cluster head and controls the data
communications while maintaining the synchronisation between the nodes in the group or
cluster. The former approach is more applicable for a distributed or flat topology while the
latter is more applicable for a clustered or centralised topology. However, in both
approaches, tight time synchronisation requires frequent resynchronisation with
neighbouring nodes consuming a significant amount of energy (Karl & Willig, 2007;
Kuorilehto et al., 2007).
In the following sections, we examine both synchronous and asynchronous low duty cycle
protocols and compare both types of protocols in terms of four major design requirements,
namely energy efficiency, latency, scalability and reliability.
3. Synchronous Low Duty Cycle MAC Protocols
Synchronised low duty cycle MAC protocols are typically equipped with predetermined
periodic wake-up schedules for data exchanges which consist of a sleep period T
sleep
and an
active period, T
active
repeated at T
wakeup_period
intervals (Kuorilehto et al., 2007). A typical
operation of synchronised low duty cycle MAC protocols is shown in Figure 2 where the
synchronisation is achieved by means of frequent beacon frames transmissions. A node
broadcasts its beacon frames once it enters the active period in order to share its current
schedule and status information with its neighbouring nodes. This way, all the nodes can
learn their neighbour's schedules and use this knowledge for data communication.
Consider a case when a node has a data packet to be transmitted. The node wakes up at the
time of the active period of the destination node and then transmits its data packet. Clearly,
we can observe that the operation of data transmission can be done in such a way due to the
advanced timing knowledge of the destination node which was obtained from frequent
beacon frames transmissions.
Moreover, synchronisation is typically maintained only within a small group or cluster due
to the difficulty of global synchronisation in a large scale WSN deployment and also to
ensure high scalability. In the following sub-sections, we examine the most important
synchronous low duty cycle MAC protocols proposed in the literature which relate closely
with the chapter direction.
Fig. 1. A periodic wake-up scheme.
Slee
p
p
eriod
Sleep/Wake-up
p
eriod
Listen period
A Survey of Low Duty Cycle MAC Protocols in Wireless Sensor Networks 71
mechanism is used as a double measure of link reliability. However, we note that all the
sensor nodes are always on which makes the issues of idle listening and overhearing still
need to be addressed. The CMAC
ON
protocol should deploy a duty cycle mechanism to
reduce further the total energy consumption. Also, circuit energy must be included to get a
better picture of the overall energy usage in the network.
The comparative study in this chapter provides a basis for further study to design an
improved version of the CMAC
ON
protocol which employs a low duty cycle mechanism in
cooperative MIMO communication. The improved MAC will be evaluated with a set of
cooperative MIMO systems in terms of energy efficient operation and its trade-off
relationship with packet latency.
The rest of the chapter is organized as follows. The concept of a low duty cycle is introduced
in Section 2 to provide a basis of energy efficient MAC operation. We examine state-of-the-
art duty cycle MAC protocols in Sections 3 and 4. We classify these protocols into
synchronous and asynchronous. In Section 5, we explore existing MAC protocols designed
specifically for cooperative Multiple-Input Multiple-Output (MIMO) transmissions. Finally
the chapter is concluded in Section 6.
2. Low Duty Cycle Concepts
The basic idea of low duty cycle protocols is to reduce the time a node is idle or spends
overhearing an unnecessary activity by putting the node in the sleep state. The most ideal
condition of low duty cycle protocols is when a node is a sleep most of the time and wakes
up only when to transmit or receive packets. In the literature, the concept of a low duty
cycle is represented as a periodic wake-up scheme. A node wakes up periodically to
transmit or receive packets from other nodes. Usually after a node wakes up, it listens to the
channel for any activity before transmitting or receiving packets. If no packet is to be
transmitted or received, the node returns to the sleep state. A whole cycle consisting of a
sleep period and a listening period is called a sleep/wake-up period and is depicted in
Figure 1.
Duty cycle is measured as the ratio of the listening period length to the wake-up period
length which gives an indicator of how long a node spends in the listening period. A small
duty cycle means that a node is asleep most of the time in order to avoid idle listening and
overhearing. However, a balanced duty cycle size must be achieved in order to avoid higher
latency and higher transient energy due to start-up costs.
There are various low duty cycle protocols proposed for WSNs which differ in aspects of
synchronisation, the number of channels required, transmitter- or receiver-initiated
operation etc. (Karl & Willig, 2007). We categorise the low duty cycle protocols into two
major classes: namely synchronous and asynchronous schemes. The concept of
synchronisation is related with data exchanges in WSNs (Kuorilehto et al., 2007). In
asynchronous schemes, there are two basic approaches, namely transmitter-initiated and
receiver-initiated. Using a transmitter-initiated approach, a node sends frequent request
packets (preamble, control or even data packet themselves) until one of them "hits" the
listening period of the destination node. On the other hand, the receiver-initiated approach
is applicable when a node sends frequent packets (preamble, control, acknowledgment) to
inform the neighbouring nodes about the willingness of the node to receive packets. The
former approach puts the energy cost on the transmitter while the latter moves the cost to
the receiver.
Another variation of low duty cycle protocols is a synchronous scheme where all the nodes
in a group or cluster have the same wake-up phase. Usually each node sends frequent
beacon frames to inform its neighbours about its wake-up cycle schedule and other
information such as pending packets to be transmitted, etc. Thus a node schedules its
transmission and reception time from the information obtained from the beacon frames. In
another approach, a node becomes a group or cluster head and controls the data
communications while maintaining the synchronisation between the nodes in the group or
cluster. The former approach is more applicable for a distributed or flat topology while the
latter is more applicable for a clustered or centralised topology. However, in both
approaches, tight time synchronisation requires frequent resynchronisation with
neighbouring nodes consuming a significant amount of energy (Karl & Willig, 2007;
Kuorilehto et al., 2007).
In the following sections, we examine both synchronous and asynchronous low duty cycle
protocols and compare both types of protocols in terms of four major design requirements,
namely energy efficiency, latency, scalability and reliability.
3. Synchronous Low Duty Cycle MAC Protocols
Synchronised low duty cycle MAC protocols are typically equipped with predetermined
periodic wake-up schedules for data exchanges which consist of a sleep period T
sleep
and an
active period, T
active
repeated at T
wakeup_period
intervals (Kuorilehto et al., 2007). A typical
operation of synchronised low duty cycle MAC protocols is shown in Figure 2 where the
synchronisation is achieved by means of frequent beacon frames transmissions. A node
broadcasts its beacon frames once it enters the active period in order to share its current
schedule and status information with its neighbouring nodes. This way, all the nodes can
learn their neighbour's schedules and use this knowledge for data communication.
Consider a case when a node has a data packet to be transmitted. The node wakes up at the
time of the active period of the destination node and then transmits its data packet. Clearly,
we can observe that the operation of data transmission can be done in such a way due to the
advanced timing knowledge of the destination node which was obtained from frequent
beacon frames transmissions.
Moreover, synchronisation is typically maintained only within a small group or cluster due
to the difficulty of global synchronisation in a large scale WSN deployment and also to
ensure high scalability. In the following sub-sections, we examine the most important
synchronous low duty cycle MAC protocols proposed in the literature which relate closely
with the chapter direction.
Fig. 1. A periodic wake-up scheme.
Sleep period
Sleep/Wake-up
p
eriod
Listen period
Emerging Communications for Wireless Sensor Networks72
Fig. 2. A synchronous periodic wake-up scheme.
3.1 Power Aware Clustered TDMA (PACT)
Power Aware Clustered Time Division Multiple Access or PACT protocol (Pei & Chien,
2001) was proposed in 2001 for networks with a clustered multi-hop topology. PACT utilises
the concept of passive clustering (Gerla et al., 2000) where nodes are allowed to take turns as
the communication backbone.
Basically there are three types of nodes in a cluster, namely a cluster head, inter-cluster
gateways and ordinary nodes. Gateway nodes are used to exchange traffic between clusters.
A simple selection algorithm is used to select the gateway nodes in a cluster which is based
on a criterion where a node with the highest number of distinct cluster heads is selected
(Kuorilehto et al., 2007). In order to reduce energy consumption within a cluster, the role
between cluster heads and gateway nodes is rotated. Furthermore, the duty cycle of each
node is adapted to the traffic conditions in the network where the radios are turned off
during inactive periods.
3.2 Low-Energy Adaptive Clustering Hierarchy (LEACH)
Low-Energy Adaptive Clustering Hierarchy or LEACH (Heinzelman et al., 2002) is a Time
Division Multiple Access (TDMA-based) MAC protocol with clustering features. A network
is formed as a star topology in two hierarchical levels as shown in Figure 3. A cluster
consists of one cluster head and a number of ordinary nodes. All the ordinary nodes
communicate with the cluster head directly. On the other hand, there is a single base station
which communicates with all the cluster heads. Direct communication with high
transmission power is used in order to ensure the cluster heads can reach the base station.
The LEACH protocol is organised in rounds and each round is subdivided into a setup
phase and a steady-state phase. The setup phase begins with the self selection of nodes to
become cluster heads. After a node properly sets up as a cluster head, it contends for the
channel using a Carrier Sense Multiple Access (CSMA) mechanism and then broadcasts an
advertisement packet to its neighbours if the channel is idle. Whenever an ordinary node
receives an advertisement packet and in the case of multiple advertisement packets, the
node selects a cluster head based on the received signal strength. Next, it contends for the
channel using CSMA and sends back an acknowledgment to the selected cluster head in
order to join the cluster. Immediately, the cluster head broadcasts a TDMA schedule to its
Rx
Tx
Rx
Tx
Source
Destination
C
T
wakeup_period
T
sleep
T
listen
Beacon
Active
Period
C
Carrier sensing Data frame
Time
cluster's members. The cluster is formed completely when all the cluster members are
synchronised to the TDMA schedule. The cluster head creates and maintains the TDMA
schedule.
The LEACH protocol implements two strategies to ensure energy efficient operation. The
first strategy is to shift the total burden of energy consumption of a single cluster head by
rotating the assignment of the cluster head to the other members in the cluster. The aim
behind this strategy is to distribute evenly the energy usage between the members of the
cluster. The second strategy is to switch the ordinary nodes in a cluster into the sleep mode
whenever they enter inactive TDMA slots. In this way, we actually create a duty cycle
mechanism through the implementation of an active and inactive TDMA time slots
schedule. However, high transmission power during direct communication between cluster
heads and the base station may dominate the total energy consumption in the network.
Furthermore, the fixed clustering structure and the need for global synchronisation make
the network not scalable whenever nodes join or leave the network. The condition becomes
worse when we consider mobile nodes.
3.3 Self-Organizing Slot Allocation (SRSA)
The Self-Organising Slot Allocation or SRSA protocol (Wu & Biswas, 2005) was proposed to
improve the LEACH MAC protocol in terms of energy efficiency and network scalability.
The SRSA protocol is a TDMA-based MAC and has a similar network topology as LEACH.
The strategy to increase energy efficiency is by utilising multiple base stations instead of
only one base station as in the LEACH architecture. Thus, cluster heads can communicate
directly with the nearest base station which reduces transmission energy significantly.
Moreover, in order to increase network scalability, SRSA provides local synchronisation
where each cluster maintains its own local TDMA MAC frame. The main idea is to initiate
communication with a random initial TDMA allocation and then adaptively change the slot
allocation schedule locally based on feedback derived from collisions experienced by the
local nodes within a cluster (Kuorilehto et al., 2007). Therefore the scalability that is achieved
for large networks depends only on local synchronisation within a cluster. However,
frequent local synchronisation may consume a significant amount of energy and may
dominate the total energy consumption of the network.
Fig. 3. Clustered LEACH MAC architecture.
Cluster head
Base station
Normal node